Onil Airbnb Market Analysis 2026: Short Term Rental Data & Vacation Rental Statistics in Valencian Community, Spain
Is Airbnb profitable in Onil in 2026? Explore comprehensive Airbnb analytics for Onil, Valencian Community, Spain to uncover income potential. This 2026 STR market report for Onil, based on AirROI data from February 2025 to January 2026, reveals key trends in the niche market of 18 active listings.
Whether you're considering an Airbnb investment in Onil, optimizing your existing vacation rental, or exploring rental arbitrage opportunities, understanding the Onil Airbnb data is crucial. Navigating the high regulation landscape is key to maximizing your short term rental income potential. Let's dive into the specifics.
Key Onil Airbnb Performance Metrics Overview
Monthly Airbnb Revenue Variations & Income Potential in Onil (2026)
Understanding the monthly revenue variations for Airbnb listings in Onil is key to maximizing your short term rental income potential. Seasonality significantly impacts earnings. Our analysis, based on data from the past 12 months, shows that the peak revenue month for STRs in Onil is typically July, while February often presents the lowest earnings, highlighting opportunities for strategic pricing adjustments during shoulder and low seasons. Explore the typical Airbnb income in Onil across different performance tiers:
- Best-in-class properties (Top 10%) achieve $3,789+ monthly, often utilizing dynamic pricing and superior guest experiences.
- Strong performing properties (Top 25%) earn $1,921 or more, indicating effective management and desirable locations/amenities.
- Typical properties (Median) generate around $1,189 per month, representing the average market performance.
- Entry-level properties (Bottom 25%) see earnings around $731, often with potential for optimization.
Average Monthly Airbnb Earnings Trend in Onil
Onil Airbnb Occupancy Rate Trends (2026)
Maximize your bookings by understanding the Onil STR occupancy trends. Seasonal demand shifts significantly influence how often properties are booked. Typically, Julysees the highest demand (peak season occupancy), while June experiences the lowest (low season). Effective strategies, like adjusting minimum stays or offering promotions, can boost occupancy during slower periods. Here's how different property tiers perform in Onil:
- Best-in-class properties (Top 10%) achieve 67%+ occupancy, indicating high desirability and potentially optimized availability.
- Strong performing properties (Top 25%) maintain 44% or higher occupancy, suggesting good market fit and guest satisfaction.
- Typical properties (Median) have an occupancy rate around 26%.
- Entry-level properties (Bottom 25%) average 14% occupancy, potentially facing higher vacancy.
Average Monthly Occupancy Rate Trend in Onil
Average Daily Rate (ADR) Airbnb Trends in Onil (2026)
Effective short term rental pricing strategy in Onil involves understanding monthly ADR fluctuations. The Average Daily Rate (ADR) for Airbnb in Onil typically peaks in October and dips lowest during February. Leveraging Airbnb dynamic pricing tools or strategies based on this seasonality can significantly boost revenue. Here's a look at the typical nightly rates achieved:
- Best-in-class properties (Top 10%) command rates of $599+ per night, often due to premium features or locations.
- Strong performing properties (Top 25%) achieve nightly rates of $280 or more.
- Typical properties (Median) charge around $162 per night.
- Entry-level properties (Bottom 25%) earn around $92 per night.
Average Daily Rate (ADR) Trend by Month in Onil
Get Live Onil Market Intelligence 👇

Explore Real-time Analytics
Airbnb Seasonality Analysis & Trends in Onil (2026)
Peak Season (July, August, January)
- Revenue averages $2,917 per month
- Occupancy rates average 39.0%
- Daily rates average $249
Shoulder Season
- Revenue averages $1,486 per month
- Occupancy maintains around 31.5%
- Daily rates hold near $256
Low Season (February, April, May)
- Revenue drops to average $902 per month
- Occupancy decreases to average 28.5%
- Daily rates adjust to average $236
Seasonality Insights for Onil
- The Airbnb seasonality in Onil shows highly seasonal trends requiring careful strategy. While the sections above show seasonal averages, it's also insightful to look at the extremes:
- During the high season, the absolute peak month showcases Onil's highest earning potential, with monthly revenues capable of climbing to $3,837, occupancy reaching a high of 46.8%, and ADRs peaking at $268.
- Conversely, the slowest single month of the year, typically falling within the low season, marks the market's lowest point. In this month, revenue might dip to $721, occupancy could drop to 24.0%, and ADRs may adjust down to $234.
- Understanding both the seasonal averages and these monthly peaks and troughs in revenue, occupancy, and ADR is crucial for maximizing your Airbnb profit potential in Onil.
Seasonal Strategies for Maximizing Profit
- Peak Season: Maximize revenue through premium pricing and potentially longer minimum stays. Ensure high availability.
- Low Season: Offer competitive pricing, special promotions (e.g., extended stay discounts), and flexible cancellation policies. Target off-season travelers like remote workers or budget-conscious guests.
- Shoulder Seasons: Implement dynamic pricing that balances peak and low rates. Target weekend travelers or specific events. Offer slightly more flexible terms than peak season.
- Regularly analyze your own performance against these Onil seasonality benchmarks and adjust your pricing and availability strategy accordingly.
Best Areas for Airbnb Investment in Onil (2026)
Exploring the top neighborhoods for short-term rentals in Onil? This section highlights key areas, outlining why they are attractive for hosts and guests, along with notable local attractions. Consider these locations based on your target guest profile and investment strategy.
| Neighborhood / Area | Why Host Here? (Target Guests & Appeal) | Key Attractions & Landmarks |
|---|---|---|
| Historic Center of Onil | Charming and picturesque area known for its rich history and traditional architecture. A favored spot for travelers looking to experience the local culture and history of Onil. | Castle of Onil, Museum of Contemporary Art, Church of Our Lady of Help, Local craft shops, Calle San Antonio |
| Natural Parks Surrounding Onil | Ideal for nature lovers and outdoor enthusiasts, this area offers beautiful landscapes, hiking trails, and recreational activities. Perfect for travelers looking to explore nature. | Sierra de Onil, Natural Park of Font Roja, Outdoor hiking trails, Parks and picnic areas |
| Nearby Villages | Suitability for visitors seeking a quiet retreat. Nearby villages like Ibi and Castalla provide additional cultural experiences and local cuisine, attracting guests looking for an authentic stay. | Castalla Castle, Ibi Toy Museum, Local festivals and fairs, Natural landscapes |
| Onil's Artisanal Market | Known for its vibrant artisanal market, attracting tourists interested in local crafts, food, and cultural experiences. This is a unique aspect of Onil that draws a crowd. | Weekly artisanal market, Local crafts, Traditional foods, Culinary workshops |
| Onil's Culinary Scene | Famous for its rich culinary tradition and local eateries, the food scene in Onil attracts foodies eager to taste traditional Valencian dishes and local delicacies. | Local taverns, Valencian paella, Wine tastings, Gastronomy festivals |
| Cultural Festivals | Onil hosts various cultural festivals throughout the year, attracting both locals and tourists. These events create a lively atmosphere and boost tourism, appealing to travelers looking to immerse themselves in local culture. | Fiesta de la Virgen de la Soledad, Midsummer Night Festival, Various musical performances, Street fairs |
| Active Sports Facilities | Onil is equipped with sports facilities for those interested in sports tourism. This attracts guests who seek active and adventurous experiences during their stay. | Sports complex, Local soccer fields, Cycling routes, Adventure sports |
| Residential Neighborhoods | Inviting neighborhoods that offer a calm environment for travelers looking for longer stays or family-friendly accommodations. This attracts those who prefer a more local living experience. | Quiet parks, Local amenities, Family-friendly services, Community events |
Understanding Airbnb License Requirements & STR Laws in Onil (2026)
Yes, Onil, Valencian Community, Spain enforces high STR regulations. Obtaining a license and ensuring compliance is almost certainly required according to current 2026 STR laws. Always verify the latest short term rental regulations and Airbnb license requirements directly with local government authorities for Onil to ensure full compliance before hosting.
(Source: AirROI data, 2026, based on 78% licensed listings)
Top Performing Airbnb Properties in Onil (2026)
Benchmark your potential! Explore examples of top-performing Airbnb properties in Onilbased on Trailing Twelve Month (TTM) revenue. Analyze their characteristics, revenue, occupancy rate, and ADR to understand what drives success in this market.
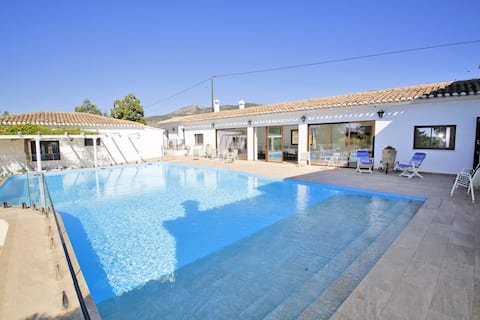
Magnificient Rural Home With Pool and BBQ.
Entire Place • 8 bedrooms

White House in Onil
Entire Place • 7 bedrooms

Fabulous house in downtown Onil (Racò D'Onil)
Entire Place • 9 bedrooms

Senia Tomaset I incredible garden
Entire Place • 5 bedrooms

Modern apartment in Onil
Entire Place • 2 bedrooms

Beautiful apartment downtown Onil
Entire Place • 3 bedrooms
Note: Performance varies based on location, size, amenities, seasonality, and management quality. Data reflects the past 12 months.
Top Performing Airbnb Hosts in Onil (2026)
Learn from the best! This table showcases top-performing Airbnb hosts in Onil based on the number of properties managed and estimated total revenue over the past year. Analyze their scale and performance metrics.
| Host Name | Properties | Grossing Revenue | Stay Reviews | Avg Rating |
|---|---|---|---|---|
| Fatima | 6 | $86,026 | 58 | 4.86/5.0 |
| Rafa | 1 | $35,403 | 1 | Not Rated |
| Guillermo | 1 | $24,562 | 30 | 4.90/5.0 |
| Stefanie | 1 | $16,978 | 128 | 4.96/5.0 |
| Sergio | 2 | $15,876 | 10 | 4.60/5.0 |
| Mª José | 1 | $15,738 | 90 | 4.88/5.0 |
| Ruben | 1 | $11,895 | 23 | 4.96/5.0 |
| Aurora | 2 | $9,910 | 138 | 4.85/5.0 |
| Marleen | 1 | $5,786 | 7 | 4.86/5.0 |
| Abdon | 1 | $5,686 | 1 | Not Rated |
Analyzing the strategies of top hosts, such as their property selection, pricing, and guest communication, can offer valuable lessons for optimizing your own Airbnb operations in Onil.
Dive Deeper: Advanced Onil STR Market Data (2026)
Ready to unlock more insights? AirROI provides access to advanced metrics and comprehensive Airbnb data for Onil. Explore detailed analytics beyond this report to refine your investment strategy, optimize pricing, and maximize your vacation rental profits.
Explore Advanced MetricsOnil Short-Term Rental Market Composition (2026): Property & Room Types
Room Type Distribution
Property Type Distribution
Market Composition Insights for Onil
- The Onil Airbnb market composition is heavily skewed towards Entire Home/Apt listings, which make up 100% of the 18 active rentals. This indicates strong guest preference for privacy and space.
- Looking at the property type distribution in Onil, House properties are the most common (61.1%), reflecting the local real estate landscape.
- Houses represent a significant 61.1% portion, catering likely to families or larger groups.
Onil Airbnb Room Capacity Analysis (2026): Bedroom Distribution
Distribution of Listings by Number of Bedrooms
Room Capacity Insights for Onil
- The dominant room capacity in Onil is 2 bedrooms listings, making up 33.3% of the market. This suggests a strong demand for properties suitable for couples or solo travelers.
- Together, 2 bedrooms and 5+ bedrooms properties represent 61.1% of the active Airbnb listings in Onil, indicating a high concentration in these sizes.
- A significant 61.1% of listings offer 3+ bedrooms, catering to larger groups and families seeking more space in Onil.
Onil Vacation Rental Guest Capacity Trends (2026)
Distribution of Listings by Guest Capacity
Guest Capacity Insights for Onil
- The most common guest capacity trend in Onil vacation rentals is listings accommodating 8+ guests (44.4%). This suggests the primary traveler segment is likely larger groups.
- Properties designed for 8+ guests and 4 guests dominate the Onil STR market, accounting for 72.2% of listings.
- 55.5% of properties accommodate 6+ guests, serving the market segment for larger families or group travel in Onil.
- On average, properties in Onil are equipped to host 6.2 guests.
Onil Airbnb Booking Patterns (2026): Available vs. Booked Days
Available Days Distribution
Booked Days Distribution
Booking Pattern Insights for Onil
- The most common availability pattern in Onil falls within the 271-366 days range, representing 72.2% of listings. This suggests many properties have significant open periods on their calendars.
- Approximately 88.9% of listings show high availability (181+ days open annually), indicating potential for increased bookings or specific owner usage patterns.
- For booked days, the 31-90 days range is most frequent in Onil (50%), reflecting common guest stay durations or potential owner blocking patterns.
- A notable 11.1% of properties secure long booking periods (181+ days booked per year), highlighting successful long-term rental strategies or significant owner usage.
Onil Airbnb Minimum Stay Requirements Analysis
Distribution of Listings by Minimum Night Requirement
1 Night
5 listings
27.8% of total
2 Nights
4 listings
22.2% of total
3 Nights
4 listings
22.2% of total
4-6 Nights
1 listings
5.6% of total
30+ Nights
4 listings
22.2% of total
Key Insights
- The most prevalent minimum stay requirement in Onil is 1 Night, adopted by 27.8% of listings. This highlights the market's preference for shorter, flexible bookings.
- A significant segment (22.2%) caters to monthly stays (30+ nights) in Onil, pointing to opportunities in the extended-stay market.
Recommendations
- Align with the market by considering a 1 Night minimum stay, as 27.8% of Onil hosts use this setting.
- If feasible, allowing 1-night stays, especially midweek or during low season, could capture last-minute bookings, as only 27.8% currently do.
- Explore offering discounts for stays of 30+ nights to attract the 22.2% of the market seeking extended stays.
- Adjust minimum nights based on seasonality – potentially shorter during low season and longer during peak demand periods in Onil.
Onil Airbnb Cancellation Policy Trends Analysis (2026)
Limited
1 listings
5.6% of total
Flexible
4 listings
22.2% of total
Moderate
3 listings
16.7% of total
Firm
9 listings
50% of total
Strict
1 listings
5.6% of total
Cancellation Policy Insights for Onil
- The prevailing Airbnb cancellation policy trend in Onil is Firm, used by 50% of listings.
- A majority (55.6%) of hosts in Onil utilize Firm or Strict policies, indicating a market where hosts prioritize booking security.
- Strict cancellation policies are quite rare (5.6%), potentially making listings with this policy less competitive unless justified by high demand or property type.
Recommendations for Hosts
- Consider adopting a Firm policy to align with the 50% market standard in Onil.
- Using a Strict policy might deter some guests, as only 5.6% of listings use it. Evaluate if potential revenue protection outweighs possible lower booking rates.
- Regularly review your cancellation policy against competitors and market demand shifts in Onil.
Onil STR Booking Lead Time Analysis (2026)
Average Booking Lead Time by Month
Booking Lead Time Insights for Onil
- The overall average booking lead time for vacation rentals in Onil is 45 days.
- Guests book furthest in advance for stays during August (average 92 days), likely coinciding with peak travel demand or local events.
- The shortest booking windows occur for stays in June (average 19 days), indicating more last-minute travel plans during this time.
- Seasonally, Summer (54 days avg.) sees the longest lead times, while Winter (43 days avg.) has the shortest, reflecting typical travel planning cycles.
Recommendations for Hosts
- Use the overall average lead time (45 days) as a baseline for your pricing and availability strategy in Onil.
- For August stays, consider implementing length-of-stay discounts or slightly higher rates for bookings made less than 92 days out to capitalize on advance planning.
- Target marketing efforts for the Summer season well in advance (at least 54 days) to capture early planners.
- Monitor your own booking lead times against these Onil averages to identify opportunities for dynamic pricing adjustments.
Popular & Essential Airbnb Amenities in Onil (2026)
Amenity Prevalence
Amenity Insights for Onil
- Essential amenities in Onil that guests expect include: TV, Kitchen. Lacking these (any) could significantly impact bookings.
- Popular amenities like Essentials, Washer, Dishes and silverware are common but not universal. Offering these can provide a competitive edge.
Recommendations for Hosts
- Ensure your listing includes all essential amenities for Onil: TV, Kitchen.
- Consider adding popular differentiators like Essentials or Washer to increase appeal.
- Highlight unique or less common amenities you offer (e.g., hot tub, dedicated workspace, EV charger) in your listing description and photos.
- Regularly check competitor amenities in Onil to stay competitive.
Onil Airbnb Guest Demographics & Profile Analysis (2026)
Guest Profile Summary for Onil
- The typical guest profile for Airbnb in Onil consists of a mix of domestic (53%) and international guests, often arriving from nearby Valencia, typically belonging to the Post-2000s (Gen Z/Alpha) group (50%), primarily speaking Spanish or English.
- Domestic travelers account for 53.4% of guests.
- Key international markets include Spain (53.4%) and France (8.6%).
- Top languages spoken are Spanish (31.1%) followed by English (26.2%).
- A significant demographic segment is the Post-2000s (Gen Z/Alpha) group, representing 50% of guests.
Recommendations for Hosts
- Balance marketing efforts between domestic and international channels based on the guest mix.
- Tailor amenities and listing descriptions to appeal to the dominant Post-2000s (Gen Z/Alpha) demographic (e.g., highlight fast WiFi, smart home features, local guides).
- Highlight unique local experiences or amenities relevant to the primary guest profile.
- Consider seasonal promotions aligned with peak travel times for key origin markets.
Nearby Short-Term Rental Market Comparison
How does the Onil Airbnb market stack up against its neighbors? Compare key performance metrics like average monthly revenue, ADR, and occupancy rates in surrounding areas to understand the broader regional STR landscape.
| Market | Active Properties | Monthly Revenue | Daily Rate | Avg. Occupancy |
|---|---|---|---|---|
| Olocau | 10 | $3,229 | $460.93 | 36% |
| Corbera | 16 | $2,781 | $231.25 | 45% |
| Picassent | 16 | $2,618 | $274.61 | 43% |
| Macastre | 15 | $2,518 | $312.89 | 34% |
| Manises | 27 | $2,511 | $201.27 | 43% |
| l'Eliana | 32 | $2,454 | $314.51 | 40% |
| Alboraia / Alboraya | 244 | $2,297 | $201.35 | 47% |
| Catral | 14 | $2,222 | $220.78 | 40% |
| Benissa | 523 | $2,182 | $303.68 | 39% |
| Bétera | 25 | $2,155 | $264.29 | 42% |