Sagunto Airbnb Market Analysis 2026: Short Term Rental Data & Vacation Rental Statistics in Valencian Community, Spain
Is Airbnb profitable in Sagunto in 2026? Explore comprehensive Airbnb analytics for Sagunto, Valencian Community, Spain to uncover income potential. This 2026 STR market report for Sagunto, based on AirROI data from February 2025 to January 2026, reveals key trends in the market of 324 active listings.
Whether you're considering an Airbnb investment in Sagunto, optimizing your existing vacation rental, or exploring rental arbitrage opportunities, understanding the Sagunto Airbnb data is crucial. Navigating the high regulation landscape is key to maximizing your short term rental income potential. Let's dive into the specifics.
Key Sagunto Airbnb Performance Metrics Overview
Monthly Airbnb Revenue Variations & Income Potential in Sagunto (2026)
Understanding the monthly revenue variations for Airbnb listings in Sagunto is key to maximizing your short term rental income potential. Seasonality significantly impacts earnings. Our analysis, based on data from the past 12 months, shows that the peak revenue month for STRs in Sagunto is typically August, while January often presents the lowest earnings, highlighting opportunities for strategic pricing adjustments during shoulder and low seasons. Explore the typical Airbnb income in Sagunto across different performance tiers:
- Best-in-class properties (Top 10%) achieve $3,286+ monthly, often utilizing dynamic pricing and superior guest experiences.
- Strong performing properties (Top 25%) earn $2,171 or more, indicating effective management and desirable locations/amenities.
- Typical properties (Median) generate around $1,268 per month, representing the average market performance.
- Entry-level properties (Bottom 25%) see earnings around $553, often with potential for optimization.
Average Monthly Airbnb Earnings Trend in Sagunto
Sagunto Airbnb Occupancy Rate Trends (2026)
Maximize your bookings by understanding the Sagunto STR occupancy trends. Seasonal demand shifts significantly influence how often properties are booked. Typically, Augustsees the highest demand (peak season occupancy), while January experiences the lowest (low season). Effective strategies, like adjusting minimum stays or offering promotions, can boost occupancy during slower periods. Here's how different property tiers perform in Sagunto:
- Best-in-class properties (Top 10%) achieve 73%+ occupancy, indicating high desirability and potentially optimized availability.
- Strong performing properties (Top 25%) maintain 54% or higher occupancy, suggesting good market fit and guest satisfaction.
- Typical properties (Median) have an occupancy rate around 31%.
- Entry-level properties (Bottom 25%) average 15% occupancy, potentially facing higher vacancy.
Average Monthly Occupancy Rate Trend in Sagunto
Average Daily Rate (ADR) Airbnb Trends in Sagunto (2026)
Effective short term rental pricing strategy in Sagunto involves understanding monthly ADR fluctuations. The Average Daily Rate (ADR) for Airbnb in Sagunto typically peaks in August and dips lowest during February. Leveraging Airbnb dynamic pricing tools or strategies based on this seasonality can significantly boost revenue. Here's a look at the typical nightly rates achieved:
- Best-in-class properties (Top 10%) command rates of $244+ per night, often due to premium features or locations.
- Strong performing properties (Top 25%) achieve nightly rates of $167 or more.
- Typical properties (Median) charge around $116 per night.
- Entry-level properties (Bottom 25%) earn around $82 per night.
Average Daily Rate (ADR) Trend by Month in Sagunto
Get Live Sagunto Market Intelligence 👇

Explore Real-time Analytics
Airbnb Seasonality Analysis & Trends in Sagunto (2026)
Peak Season (August, July, June)
- Revenue averages $2,658 per month
- Occupancy rates average 49.7%
- Daily rates average $161
Shoulder Season
- Revenue averages $1,440 per month
- Occupancy maintains around 33.4%
- Daily rates hold near $136
Low Season (January, February, December)
- Revenue drops to average $1,085 per month
- Occupancy decreases to average 28.3%
- Daily rates adjust to average $139
Seasonality Insights for Sagunto
- The Airbnb seasonality in Sagunto shows highly seasonal trends requiring careful strategy. While the sections above show seasonal averages, it's also insightful to look at the extremes:
- During the high season, the absolute peak month showcases Sagunto's highest earning potential, with monthly revenues capable of climbing to $3,350, occupancy reaching a high of 58.1%, and ADRs peaking at $171.
- Conversely, the slowest single month of the year, typically falling within the low season, marks the market's lowest point. In this month, revenue might dip to $806, occupancy could drop to 21.3%, and ADRs may adjust down to $126.
- Understanding both the seasonal averages and these monthly peaks and troughs in revenue, occupancy, and ADR is crucial for maximizing your Airbnb profit potential in Sagunto.
Seasonal Strategies for Maximizing Profit
- Peak Season: Maximize revenue through premium pricing and potentially longer minimum stays. Ensure high availability.
- Low Season: Offer competitive pricing, special promotions (e.g., extended stay discounts), and flexible cancellation policies. Target off-season travelers like remote workers or budget-conscious guests.
- Shoulder Seasons: Implement dynamic pricing that balances peak and low rates. Target weekend travelers or specific events. Offer slightly more flexible terms than peak season.
- Regularly analyze your own performance against these Sagunto seasonality benchmarks and adjust your pricing and availability strategy accordingly.
Best Areas for Airbnb Investment in Sagunto (2026)
Exploring the top neighborhoods for short-term rentals in Sagunto? This section highlights key areas, outlining why they are attractive for hosts and guests, along with notable local attractions. Consider these locations based on your target guest profile and investment strategy.
| Neighborhood / Area | Why Host Here? (Target Guests & Appeal) | Key Attractions & Landmarks |
|---|---|---|
| Sagunto Old Town | A historic area rich in culture and architectural heritage, perfect for travelers interested in history and local charm. Offers a mix of ancient Roman ruins and Spanish architecture. | Roman Theatre, Castillo de Sagunto, Casa dels Berenguer, Plaza Mayor, Museo Histórico, Templo de Diana |
| Port of Sagunto | A vibrant coastal area that attracts families and beach-goers, featuring beautiful beaches and a selection of restaurants. Excellent for summer rentals near the sea. | Sagunto Beach, Playa de Puerto de Sagunto, La Albufera Park, Restaurants along the promenade, Water sports activities, Cultural festivals |
| Sagunto Marina | Ideal for water sports enthusiasts, this area has several yacht clubs and offers beautiful views of the Mediterranean. Great for hosting groups interested in nautical activities. | Marina of Sagunto, Sailing schools, Boat rentals, Fishing opportunities, Coastal walking paths, Societies promoting water sports |
| Albalat dels Tarongers | Quiet town near Sagunto ideal for those seeking tranquility yet close enough to the beach. Attracts tourists looking for a peaceful getaway. | Natural parks, Hiking trails, Traditional Spanish cuisine, Local cultural events, Yearly fairs, Scenic viewpoints |
| Canet d'en Berenguer | A family-friendly beach destination known for its quiet ambience and safe swimming areas. Perfect for families looking for beach side accommodations. | Canet Beach, Family parks, Restaurants with local cuisine, Cycling paths, Beach sports facilities, Beach events and festivals |
| Puzol | A serene area popular with locals. Offers access to nature and is only a short distance from Sagunto's main attractions. Great for nature lovers. | Natural parks, Local markets, Cultural festivals, Traditional architecture, Outdoor events, Mountain trails |
| Benifairó de les Valls | A small village that offers a taste of rural Spanish life, it appeals to visitors looking for authentic experiences away from the tourist crowds. | Rural landscapes, Local artisanal products, Hiking trails, Traditional festivities, Cultural heritage sites, Market days |
| Los Monasterios | A luxury residential area with high-end amenities and proximity to nature. Good for those seeking a retreat with nature-filled environments. | Golf courses, Nature reserves, Villa parks, Outdoor activities, Luxury dining, Scenic views |
Understanding Airbnb License Requirements & STR Laws in Sagunto (2026)
Yes, Sagunto, Valencian Community, Spain enforces high STR regulations. Obtaining a license and ensuring compliance is almost certainly required according to current 2026 STR laws. Always verify the latest short term rental regulations and Airbnb license requirements directly with local government authorities for Sagunto to ensure full compliance before hosting.
(Source: AirROI data, 2026, based on 67% licensed listings)
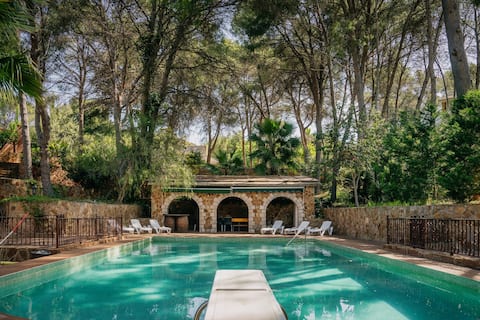
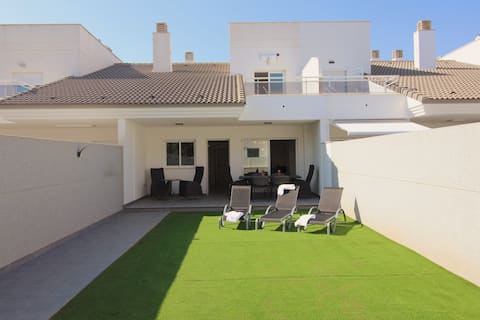
Top Performing Airbnb Properties in Sagunto (2026)
Benchmark your potential! Explore examples of top-performing Airbnb properties in Saguntobased on Trailing Twelve Month (TTM) revenue. Analyze their characteristics, revenue, occupancy rate, and ADR to understand what drives success in this market.

Luxury 7 bedroom 470 m2 villa.
Entire Place • 7 bedrooms
Impressive 9 bedroom villa.
Entire Place • 9 bedrooms

An Exquisite Oceanfront Villa
Entire Place • 3 bedrooms

Seaside home with garden
Entire Place • 4 bedrooms
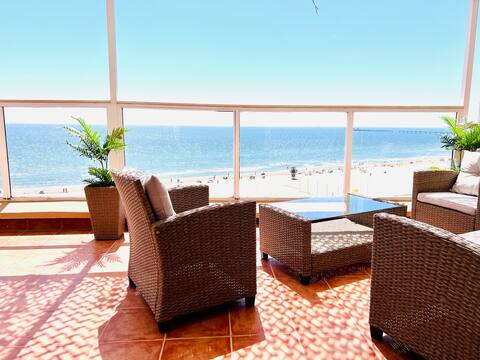
Luxe Penthouse/Beachfront/Mediterranean Sea Views
Entire Place • 3 bedrooms
Beach house (200 meters from the beach)
Entire Place • 3 bedrooms
Note: Performance varies based on location, size, amenities, seasonality, and management quality. Data reflects the past 12 months.
Top Performing Airbnb Hosts in Sagunto (2026)
Learn from the best! This table showcases top-performing Airbnb hosts in Sagunto based on the number of properties managed and estimated total revenue over the past year. Analyze their scale and performance metrics.
| Host Name | Properties | Grossing Revenue | Stay Reviews | Avg Rating |
|---|---|---|---|---|
| Union Inmobiliarias Marquez | 34 | $544,988 | 1203 | 4.44/5.0 |
| Global Vacacional | 28 | $292,124 | 191 | 4.27/5.0 |
| Luis Miguel | 16 | $277,579 | 683 | 4.40/5.0 |
| Alejandro | 2 | $275,846 | 32 | 4.78/5.0 |
| Maria Y Jose Carlos | 23 | $142,788 | 1366 | 4.52/5.0 |
| Ana María | 6 | $100,805 | 130 | 4.86/5.0 |
| Alejandro | 1 | $95,018 | 49 | 4.96/5.0 |
| Cristina | 4 | $90,193 | 159 | 4.86/5.0 |
| Teo | 4 | $85,106 | 76 | 4.86/5.0 |
| Maribel | 1 | $69,277 | 76 | 4.97/5.0 |
Analyzing the strategies of top hosts, such as their property selection, pricing, and guest communication, can offer valuable lessons for optimizing your own Airbnb operations in Sagunto.
Dive Deeper: Advanced Sagunto STR Market Data (2026)
Ready to unlock more insights? AirROI provides access to advanced metrics and comprehensive Airbnb data for Sagunto. Explore detailed analytics beyond this report to refine your investment strategy, optimize pricing, and maximize your vacation rental profits.
Explore Advanced MetricsSagunto Short-Term Rental Market Composition (2026): Property & Room Types
Room Type Distribution
Property Type Distribution
Market Composition Insights for Sagunto
- The Sagunto Airbnb market composition is heavily skewed towards Entire Home/Apt listings, which make up 92% of the 324 active rentals. This indicates strong guest preference for privacy and space.
- Looking at the property type distribution in Sagunto, Apartment/Condo properties are the most common (74.7%), reflecting the local real estate landscape.
- Houses represent a significant 23.5% portion, catering likely to families or larger groups.
- Smaller segments like hotel/boutique, others (combined 1.8%) offer potential for unique stay experiences.
Sagunto Airbnb Room Capacity Analysis (2026): Bedroom Distribution
Distribution of Listings by Number of Bedrooms
Room Capacity Insights for Sagunto
- The dominant room capacity in Sagunto is 3 bedrooms listings, making up 36.7% of the market. This suggests a strong demand for properties suitable for families or small groups.
- Together, 3 bedrooms and 2 bedrooms properties represent 64.2% of the active Airbnb listings in Sagunto, indicating a high concentration in these sizes.
- A significant 47.6% of listings offer 3+ bedrooms, catering to larger groups and families seeking more space in Sagunto.
Sagunto Vacation Rental Guest Capacity Trends (2026)
Distribution of Listings by Guest Capacity
Guest Capacity Insights for Sagunto
- The most common guest capacity trend in Sagunto vacation rentals is listings accommodating 6 guests (25.3%). This suggests the primary traveler segment is likely larger groups.
- Properties designed for 6 guests and 4 guests dominate the Sagunto STR market, accounting for 48.1% of listings.
- 48.7% of properties accommodate 6+ guests, serving the market segment for larger families or group travel in Sagunto.
- On average, properties in Sagunto are equipped to host 5.1 guests.
Sagunto Airbnb Booking Patterns (2026): Available vs. Booked Days
Available Days Distribution
Booked Days Distribution
Booking Pattern Insights for Sagunto
- The most common availability pattern in Sagunto falls within the 271-366 days range, representing 60.8% of listings. This suggests many properties have significant open periods on their calendars.
- Approximately 92.0% of listings show high availability (181+ days open annually), indicating potential for increased bookings or specific owner usage patterns.
- For booked days, the 31-90 days range is most frequent in Sagunto (37.3%), reflecting common guest stay durations or potential owner blocking patterns.
- A notable 9.5% of properties secure long booking periods (181+ days booked per year), highlighting successful long-term rental strategies or significant owner usage.
Sagunto Airbnb Minimum Stay Requirements Analysis
Distribution of Listings by Minimum Night Requirement
1 Night
68 listings
21% of total
2 Nights
41 listings
12.7% of total
3 Nights
15 listings
4.6% of total
4-6 Nights
37 listings
11.4% of total
7-29 Nights
21 listings
6.5% of total
30+ Nights
142 listings
43.8% of total
Key Insights
- The most prevalent minimum stay requirement in Sagunto is 30+ Nights, adopted by 43.8% of listings. This highlights the market's preference for longer commitments.
- A significant segment (43.8%) caters to monthly stays (30+ nights) in Sagunto, pointing to opportunities in the extended-stay market.
Recommendations
- Align with the market by considering a 30+ Nights minimum stay, as 43.8% of Sagunto hosts use this setting.
- If feasible, allowing 1-night stays, especially midweek or during low season, could capture last-minute bookings, as only 21% currently do.
- Explore offering discounts for stays of 30+ nights to attract the 43.8% of the market seeking extended stays.
- Adjust minimum nights based on seasonality – potentially shorter during low season and longer during peak demand periods in Sagunto.
Sagunto Airbnb Cancellation Policy Trends Analysis (2026)
Super Strict 60 Days
4 listings
1.2% of total
Flexible
70 listings
21.6% of total
Moderate
93 listings
28.7% of total
Firm
124 listings
38.3% of total
Strict
33 listings
10.2% of total
Cancellation Policy Insights for Sagunto
- The prevailing Airbnb cancellation policy trend in Sagunto is Firm, used by 38.3% of listings.
- There's a relatively balanced mix between guest-friendly (50.3%) and stricter (48.5%) policies, offering choices for different guest needs.
Recommendations for Hosts
- Consider adopting a Firm policy to align with the 38.3% market standard in Sagunto.
- Using a Strict policy might deter some guests, as only 10.2% of listings use it. Evaluate if potential revenue protection outweighs possible lower booking rates.
- Regularly review your cancellation policy against competitors and market demand shifts in Sagunto.
Sagunto STR Booking Lead Time Analysis (2026)
Average Booking Lead Time by Month
Booking Lead Time Insights for Sagunto
- The overall average booking lead time for vacation rentals in Sagunto is 50 days.
- Guests book furthest in advance for stays during August (average 81 days), likely coinciding with peak travel demand or local events.
- The shortest booking windows occur for stays in February (average 16 days), indicating more last-minute travel plans during this time.
- Seasonally, Summer (67 days avg.) sees the longest lead times, while Spring (34 days avg.) has the shortest, reflecting typical travel planning cycles.
Recommendations for Hosts
- Use the overall average lead time (50 days) as a baseline for your pricing and availability strategy in Sagunto.
- For August stays, consider implementing length-of-stay discounts or slightly higher rates for bookings made less than 81 days out to capitalize on advance planning.
- Target marketing efforts for the Summer season well in advance (at least 67 days) to capture early planners.
- Monitor your own booking lead times against these Sagunto averages to identify opportunities for dynamic pricing adjustments.
Popular & Essential Airbnb Amenities in Sagunto (2026)
Amenity Prevalence
Amenity Insights for Sagunto
- Essential amenities in Sagunto that guests expect include: Kitchen, TV. Lacking these (any) could significantly impact bookings.
- Popular amenities like Washer, Wifi, Hot water are common but not universal. Offering these can provide a competitive edge.
- Warning: Wifi is not universally provided but is considered essential globally. Ensure reliable Wifi is offered.
Recommendations for Hosts
- Ensure your listing includes all essential amenities for Sagunto: Kitchen, TV.
- Prioritize adding missing essentials: Kitchen, TV.
- Consider adding popular differentiators like Washer or Wifi to increase appeal.
- Highlight unique or less common amenities you offer (e.g., hot tub, dedicated workspace, EV charger) in your listing description and photos.
- Regularly check competitor amenities in Sagunto to stay competitive.
Sagunto Airbnb Guest Demographics & Profile Analysis (2026)
Guest Profile Summary for Sagunto
- The typical guest profile for Airbnb in Sagunto consists of a mix of domestic (49%) and international guests, with top international origins including France, typically belonging to the Post-2000s (Gen Z/Alpha) group (50%), primarily speaking English or Spanish.
- Domestic travelers account for 48.5% of guests.
- Key international markets include Spain (48.5%) and France (12.7%).
- Top languages spoken are English (30.3%) followed by Spanish (28.5%).
- A significant demographic segment is the Post-2000s (Gen Z/Alpha) group, representing 50% of guests.
Recommendations for Hosts
- Balance marketing efforts between domestic and international channels based on the guest mix.
- Tailor amenities and listing descriptions to appeal to the dominant Post-2000s (Gen Z/Alpha) demographic (e.g., highlight fast WiFi, smart home features, local guides).
- Highlight unique local experiences or amenities relevant to the primary guest profile.
- Consider seasonal promotions aligned with peak travel times for key origin markets.
Nearby Short-Term Rental Market Comparison
How does the Sagunto Airbnb market stack up against its neighbors? Compare key performance metrics like average monthly revenue, ADR, and occupancy rates in surrounding areas to understand the broader regional STR landscape.
| Market | Active Properties | Monthly Revenue | Daily Rate | Avg. Occupancy |
|---|---|---|---|---|
| Olocau | 10 | $3,229 | $460.93 | 36% |
| Corbera | 16 | $2,781 | $231.25 | 45% |
| Picassent | 16 | $2,618 | $274.61 | 43% |
| Macastre | 15 | $2,518 | $312.89 | 34% |
| Manises | 27 | $2,511 | $201.27 | 43% |
| l'Eliana | 32 | $2,454 | $314.51 | 40% |
| Alboraia / Alboraya | 244 | $2,297 | $201.35 | 47% |
| Catral | 14 | $2,222 | $220.78 | 40% |
| Benissa | 523 | $2,182 | $303.68 | 39% |
| Bétera | 25 | $2,155 | $264.29 | 42% |