Xeraco Airbnb Market Analysis 2026: Short Term Rental Data & Vacation Rental Statistics in Valencian Community, Spain
Is Airbnb profitable in Xeraco in 2026? Explore comprehensive Airbnb analytics for Xeraco, Valencian Community, Spain to uncover income potential. This 2026 STR market report for Xeraco, based on AirROI data from February 2025 to January 2026, reveals key trends in the niche market of 65 active listings.
Whether you're considering an Airbnb investment in Xeraco, optimizing your existing vacation rental, or exploring rental arbitrage opportunities, understanding the Xeraco Airbnb data is crucial. Navigating the high regulation landscape is key to maximizing your short term rental income potential. Let's dive into the specifics.
Key Xeraco Airbnb Performance Metrics Overview
Monthly Airbnb Revenue Variations & Income Potential in Xeraco (2026)
Understanding the monthly revenue variations for Airbnb listings in Xeraco is key to maximizing your short term rental income potential. Seasonality significantly impacts earnings. Our analysis, based on data from the past 12 months, shows that the peak revenue month for STRs in Xeraco is typically August, while January often presents the lowest earnings, highlighting opportunities for strategic pricing adjustments during shoulder and low seasons. Explore the typical Airbnb income in Xeraco across different performance tiers:
- Best-in-class properties (Top 10%) achieve $2,799+ monthly, often utilizing dynamic pricing and superior guest experiences.
- Strong performing properties (Top 25%) earn $1,745 or more, indicating effective management and desirable locations/amenities.
- Typical properties (Median) generate around $1,111 per month, representing the average market performance.
- Entry-level properties (Bottom 25%) see earnings around $534, often with potential for optimization.
Average Monthly Airbnb Earnings Trend in Xeraco
Xeraco Airbnb Occupancy Rate Trends (2026)
Maximize your bookings by understanding the Xeraco STR occupancy trends. Seasonal demand shifts significantly influence how often properties are booked. Typically, Julysees the highest demand (peak season occupancy), while January experiences the lowest (low season). Effective strategies, like adjusting minimum stays or offering promotions, can boost occupancy during slower periods. Here's how different property tiers perform in Xeraco:
- Best-in-class properties (Top 10%) achieve 54%+ occupancy, indicating high desirability and potentially optimized availability.
- Strong performing properties (Top 25%) maintain 42% or higher occupancy, suggesting good market fit and guest satisfaction.
- Typical properties (Median) have an occupancy rate around 27%.
- Entry-level properties (Bottom 25%) average 12% occupancy, potentially facing higher vacancy.
Average Monthly Occupancy Rate Trend in Xeraco
Average Daily Rate (ADR) Airbnb Trends in Xeraco (2026)
Effective short term rental pricing strategy in Xeraco involves understanding monthly ADR fluctuations. The Average Daily Rate (ADR) for Airbnb in Xeraco typically peaks in August and dips lowest during February. Leveraging Airbnb dynamic pricing tools or strategies based on this seasonality can significantly boost revenue. Here's a look at the typical nightly rates achieved:
- Best-in-class properties (Top 10%) command rates of $250+ per night, often due to premium features or locations.
- Strong performing properties (Top 25%) achieve nightly rates of $175 or more.
- Typical properties (Median) charge around $136 per night.
- Entry-level properties (Bottom 25%) earn around $105 per night.
Average Daily Rate (ADR) Trend by Month in Xeraco
Get Live Xeraco Market Intelligence 👇

Explore Real-time Analytics
Airbnb Seasonality Analysis & Trends in Xeraco (2026)
Peak Season (August, July, September)
- Revenue averages $2,754 per month
- Occupancy rates average 47.9%
- Daily rates average $172
Shoulder Season
- Revenue averages $1,028 per month
- Occupancy maintains around 24.2%
- Daily rates hold near $152
Low Season (January, February, November)
- Revenue drops to average $635 per month
- Occupancy decreases to average 19.6%
- Daily rates adjust to average $152
Seasonality Insights for Xeraco
- The Airbnb seasonality in Xeraco shows highly seasonal trends requiring careful strategy. While the sections above show seasonal averages, it's also insightful to look at the extremes:
- During the high season, the absolute peak month showcases Xeraco's highest earning potential, with monthly revenues capable of climbing to $3,474, occupancy reaching a high of 59.7%, and ADRs peaking at $174.
- Conversely, the slowest single month of the year, typically falling within the low season, marks the market's lowest point. In this month, revenue might dip to $511, occupancy could drop to 12.5%, and ADRs may adjust down to $138.
- Understanding both the seasonal averages and these monthly peaks and troughs in revenue, occupancy, and ADR is crucial for maximizing your Airbnb profit potential in Xeraco.
Seasonal Strategies for Maximizing Profit
- Peak Season: Maximize revenue through premium pricing and potentially longer minimum stays. Ensure high availability.
- Low Season: Offer competitive pricing, special promotions (e.g., extended stay discounts), and flexible cancellation policies. Target off-season travelers like remote workers or budget-conscious guests.
- Shoulder Seasons: Implement dynamic pricing that balances peak and low rates. Target weekend travelers or specific events. Offer slightly more flexible terms than peak season.
- Regularly analyze your own performance against these Xeraco seasonality benchmarks and adjust your pricing and availability strategy accordingly.
Best Areas for Airbnb Investment in Xeraco (2026)
Exploring the top neighborhoods for short-term rentals in Xeraco? This section highlights key areas, outlining why they are attractive for hosts and guests, along with notable local attractions. Consider these locations based on your target guest profile and investment strategy.
| Neighborhood / Area | Why Host Here? (Target Guests & Appeal) | Key Attractions & Landmarks |
|---|---|---|
| Xeraco Beach | Popular tourist destination with stunning beaches and a relaxed atmosphere. Ideal for visitors looking for a summer getaway with water activities and sunbathing areas. | Xeraco Beach, Water sports activities, Beachfront restaurants, Coastal promenades, Local markets |
| Old Town Xeraco | Rich in history and culture, the Old Town offers a glimpse into the traditional Spanish lifestyle with charming streets and local shops. Attractive to tourists interested in cultural experiences. | Church of Saint John the Baptist, Local artisan shops, Town square, Cultural festivals, Historic architecture |
| Valencia City (30 min drive) | Being close to Valencia, guests can enjoy day trips to explore the city’s vibrant culture, cuisine, and attractions while staying in a quieter area. | City of Arts and Sciences, Valencia Cathedral, Central Market, Turia Gardens, Malvarrosa Beach |
| Gandía (15 min drive) | Another nearby coastal city with beautiful beaches and a variety of entertainment options, popular among families and beachgoers. | Gandía Beach, Marjal de Gandía Natural Park, Palau Ducal, Museu de Gandía, Local nightlife |
| Natural Park of La Albufera (30 min drive) | A unique natural area with beautiful landscapes, ideal for nature lovers and those seeking outdoor activities like hiking and bird watching. | La Albufera Lagoon, Boat rides, Mini-golf, Nature trails, Local wildlife |
| Javea (1 hour drive) | A picturesque coastal town known for its stunning landscapes and beaches. A great getaway for those wanting to explore the Costa Blanca region. | Arenal Beach, Cape San Antonio, Old Town Javea, Marine Park, Water sports |
| Oliva (20 min drive) | A quieter beach destination known for its lovely beaches, historic sites, and local gastronomy, appealing to families and retirees. | Oliva Beach, Oliva Castle, Local cuisine, Natural parks, Golf courses |
| La Safor Region | An area known for its beautiful landscapes and rural tourism potential, attracting those looking for a peaceful retreat and local wine experiences. | Wine tasting tours, Hiking routes, Traditional villages, Festivals, Cultural heritage sites |
Understanding Airbnb License Requirements & STR Laws in Xeraco (2026)
Yes, Xeraco, Valencian Community, Spain enforces high STR regulations. Obtaining a license and ensuring compliance is almost certainly required according to current 2026 STR laws. Always verify the latest short term rental regulations and Airbnb license requirements directly with local government authorities for Xeraco to ensure full compliance before hosting.
(Source: AirROI data, 2026, based on 57% licensed listings)
Top Performing Airbnb Properties in Xeraco (2026)
Benchmark your potential! Explore examples of top-performing Airbnb properties in Xeracobased on Trailing Twelve Month (TTM) revenue. Analyze their characteristics, revenue, occupancy rate, and ADR to understand what drives success in this market.
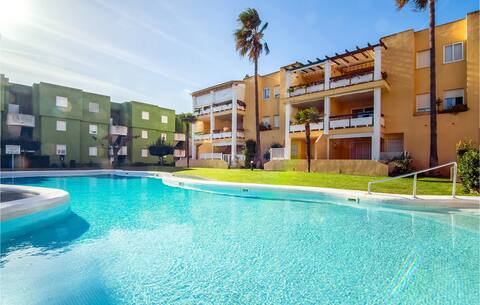
Nice apartment in Xeraco with WiFi
Entire Place • 2 bedrooms
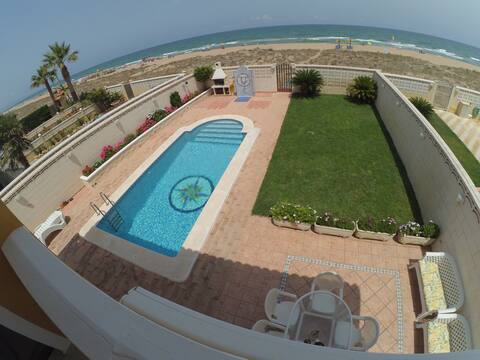
Villa with private pool facing the sea
Entire Place • 4 bedrooms
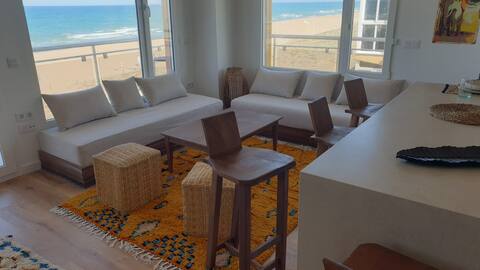
Large Cozy Sea-Facing Apartment – Xeraco Playa, Spain
Entire Place • 2 bedrooms

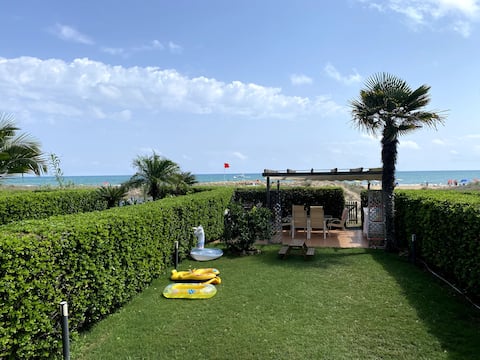
Breathtaking Beachfront Villa in Xeraco
Entire Place • 5 bedrooms

Large apartment Xeraco beach
Entire Place • 4 bedrooms
Incredible Beachfront Apartment Direct Access
Entire Place • 2 bedrooms
Note: Performance varies based on location, size, amenities, seasonality, and management quality. Data reflects the past 12 months.
Top Performing Airbnb Hosts in Xeraco (2026)
Learn from the best! This table showcases top-performing Airbnb hosts in Xeraco based on the number of properties managed and estimated total revenue over the past year. Analyze their scale and performance metrics.
| Host Name | Properties | Grossing Revenue | Stay Reviews | Avg Rating |
|---|---|---|---|---|
| Novasol | 1 | $39,669 | 7 | 4.43/5.0 |
| Victoria | 1 | $36,850 | 17 | 4.94/5.0 |
| Serviplaya | 8 | $30,585 | 9 | Not Rated |
| Francois | 1 | $29,777 | 14 | 4.93/5.0 |
| Rent With Us | 1 | $27,947 | 7 | 4.57/5.0 |
| Pablo | 1 | $26,636 | 40 | 4.88/5.0 |
| Álex | 1 | $20,081 | 13 | 4.92/5.0 |
| Vicente | 2 | $19,531 | 58 | 4.67/5.0 |
| Encarna | 1 | $18,609 | 32 | 4.94/5.0 |
| Juan Antonio | 1 | $18,317 | 40 | 4.85/5.0 |
Analyzing the strategies of top hosts, such as their property selection, pricing, and guest communication, can offer valuable lessons for optimizing your own Airbnb operations in Xeraco.
Dive Deeper: Advanced Xeraco STR Market Data (2026)
Ready to unlock more insights? AirROI provides access to advanced metrics and comprehensive Airbnb data for Xeraco. Explore detailed analytics beyond this report to refine your investment strategy, optimize pricing, and maximize your vacation rental profits.
Explore Advanced MetricsXeraco Short-Term Rental Market Composition (2026): Property & Room Types
Room Type Distribution
Property Type Distribution
Market Composition Insights for Xeraco
- The Xeraco Airbnb market composition is heavily skewed towards Entire Home/Apt listings, which make up 100% of the 65 active rentals. This indicates strong guest preference for privacy and space.
- Looking at the property type distribution in Xeraco, Apartment/Condo properties are the most common (83.1%), reflecting the local real estate landscape.
- Houses represent a significant 16.9% portion, catering likely to families or larger groups.
Xeraco Airbnb Room Capacity Analysis (2026): Bedroom Distribution
Distribution of Listings by Number of Bedrooms
Room Capacity Insights for Xeraco
- The dominant room capacity in Xeraco is 3 bedrooms listings, making up 47.7% of the market. This suggests a strong demand for properties suitable for families or small groups.
- Together, 3 bedrooms and 2 bedrooms properties represent 86.2% of the active Airbnb listings in Xeraco, indicating a high concentration in these sizes.
- A significant 55.4% of listings offer 3+ bedrooms, catering to larger groups and families seeking more space in Xeraco.
Xeraco Vacation Rental Guest Capacity Trends (2026)
Distribution of Listings by Guest Capacity
Guest Capacity Insights for Xeraco
- The most common guest capacity trend in Xeraco vacation rentals is listings accommodating 6 guests (33.8%). This suggests the primary traveler segment is likely larger groups.
- Properties designed for 6 guests and 4 guests dominate the Xeraco STR market, accounting for 67.6% of listings.
- 49.2% of properties accommodate 6+ guests, serving the market segment for larger families or group travel in Xeraco.
- On average, properties in Xeraco are equipped to host 5.3 guests.
Xeraco Airbnb Booking Patterns (2026): Available vs. Booked Days
Available Days Distribution
Booked Days Distribution
Booking Pattern Insights for Xeraco
- The most common availability pattern in Xeraco falls within the 271-366 days range, representing 80% of listings. This suggests many properties have significant open periods on their calendars.
- Approximately 98.5% of listings show high availability (181+ days open annually), indicating potential for increased bookings or specific owner usage patterns.
- For booked days, the 31-90 days range is most frequent in Xeraco (58.5%), reflecting common guest stay durations or potential owner blocking patterns.
- A notable 1.5% of properties secure long booking periods (181+ days booked per year), highlighting successful long-term rental strategies or significant owner usage.
Xeraco Airbnb Minimum Stay Requirements Analysis
Distribution of Listings by Minimum Night Requirement
1 Night
2 listings
3.1% of total
2 Nights
6 listings
9.2% of total
3 Nights
2 listings
3.1% of total
4-6 Nights
23 listings
35.4% of total
7-29 Nights
8 listings
12.3% of total
30+ Nights
24 listings
36.9% of total
Key Insights
- The most prevalent minimum stay requirement in Xeraco is 30+ Nights, adopted by 36.9% of listings. This highlights the market's preference for longer commitments.
- Very short stays (1-2 nights) are less common (12.3%), suggesting hosts prefer slightly longer bookings to optimize turnover.
- A significant segment (36.9%) caters to monthly stays (30+ nights) in Xeraco, pointing to opportunities in the extended-stay market.
Recommendations
- Align with the market by considering a 30+ Nights minimum stay, as 36.9% of Xeraco hosts use this setting.
- If feasible, allowing 1-night stays, especially midweek or during low season, could capture last-minute bookings, as only 3.1% currently do.
- Explore offering discounts for stays of 30+ nights to attract the 36.9% of the market seeking extended stays.
- Adjust minimum nights based on seasonality – potentially shorter during low season and longer during peak demand periods in Xeraco.
Xeraco Airbnb Cancellation Policy Trends Analysis (2026)
Super Strict 60 Days
1 listings
1.5% of total
Super Strict 30 Days
8 listings
12.3% of total
Flexible
9 listings
13.8% of total
Moderate
13 listings
20% of total
Firm
22 listings
33.8% of total
Strict
12 listings
18.5% of total
Cancellation Policy Insights for Xeraco
- The prevailing Airbnb cancellation policy trend in Xeraco is Firm, used by 33.8% of listings.
- A majority (52.3%) of hosts in Xeraco utilize Firm or Strict policies, indicating a market where hosts prioritize booking security.
Recommendations for Hosts
- Consider adopting a Firm policy to align with the 33.8% market standard in Xeraco.
- Regularly review your cancellation policy against competitors and market demand shifts in Xeraco.
Xeraco STR Booking Lead Time Analysis (2026)
Average Booking Lead Time by Month
Booking Lead Time Insights for Xeraco
- The overall average booking lead time for vacation rentals in Xeraco is 62 days.
- Guests book furthest in advance for stays during August (average 120 days), likely coinciding with peak travel demand or local events.
- The shortest booking windows occur for stays in February (average 6 days), indicating more last-minute travel plans during this time.
- Seasonally, Summer (88 days avg.) sees the longest lead times, while Winter (17 days avg.) has the shortest, reflecting typical travel planning cycles.
Recommendations for Hosts
- Use the overall average lead time (62 days) as a baseline for your pricing and availability strategy in Xeraco.
- For August stays, consider implementing length-of-stay discounts or slightly higher rates for bookings made less than 120 days out to capitalize on advance planning.
- During February, focus on last-minute booking availability and promotions, as guests book with very short notice (6 days avg.).
- Target marketing efforts for the Summer season well in advance (at least 88 days) to capture early planners.
- Monitor your own booking lead times against these Xeraco averages to identify opportunities for dynamic pricing adjustments.
Popular & Essential Airbnb Amenities in Xeraco (2026)
Amenity Prevalence
Amenity Insights for Xeraco
- Essential amenities in Xeraco that guests expect include: Washer, Kitchen, TV. Lacking these (any) could significantly impact bookings.
- Popular amenities like Dishes and silverware, Hot water, Refrigerator are common but not universal. Offering these can provide a competitive edge.
Recommendations for Hosts
- Ensure your listing includes all essential amenities for Xeraco: Washer, Kitchen, TV.
- Prioritize adding missing essentials: Kitchen, TV.
- Consider adding popular differentiators like Dishes and silverware or Hot water to increase appeal.
- Highlight unique or less common amenities you offer (e.g., hot tub, dedicated workspace, EV charger) in your listing description and photos.
- Regularly check competitor amenities in Xeraco to stay competitive.
Xeraco Airbnb Guest Demographics & Profile Analysis (2026)
Guest Profile Summary for Xeraco
- The typical guest profile for Airbnb in Xeraco consists of primarily domestic travelers (66%), often arriving from nearby Madrid, typically belonging to the Post-2000s (Gen Z/Alpha) group (50%), primarily speaking Spanish or English.
- Domestic travelers account for 65.7% of guests.
- Key international markets include Spain (65.7%) and France (10.8%).
- Top languages spoken are Spanish (39.7%) followed by English (24.4%).
- A significant demographic segment is the Post-2000s (Gen Z/Alpha) group, representing 50% of guests.
Recommendations for Hosts
- Target domestic marketing efforts towards travelers from Madrid and Valencia.
- Tailor amenities and listing descriptions to appeal to the dominant Post-2000s (Gen Z/Alpha) demographic (e.g., highlight fast WiFi, smart home features, local guides).
- Highlight unique local experiences or amenities relevant to the primary guest profile.
- Consider seasonal promotions aligned with peak travel times for key origin markets.
Nearby Short-Term Rental Market Comparison
How does the Xeraco Airbnb market stack up against its neighbors? Compare key performance metrics like average monthly revenue, ADR, and occupancy rates in surrounding areas to understand the broader regional STR landscape.
| Market | Active Properties | Monthly Revenue | Daily Rate | Avg. Occupancy |
|---|---|---|---|---|
| Olocau | 10 | $3,229 | $460.93 | 36% |
| Corbera | 16 | $2,781 | $231.25 | 45% |
| Picassent | 16 | $2,618 | $274.61 | 43% |
| Macastre | 15 | $2,518 | $312.89 | 34% |
| Manises | 27 | $2,511 | $201.27 | 43% |
| l'Eliana | 32 | $2,454 | $314.51 | 40% |
| Alboraia / Alboraya | 244 | $2,297 | $201.35 | 47% |
| Catral | 14 | $2,222 | $220.78 | 40% |
| Benissa | 523 | $2,182 | $303.68 | 39% |
| Bétera | 25 | $2,155 | $264.29 | 42% |