Alles Garden Airbnb Market Analysis 2026: Short Term Rental Data & Vacation Rental Statistics in Eastern Province, Sri Lanka
Is Airbnb profitable in Alles Garden in 2026? Explore comprehensive Airbnb analytics for Alles Garden, Eastern Province, Sri Lanka to uncover income potential. This 2026 STR market report for Alles Garden, based on AirROI data from February 2025 to January 2026, reveals key trends in the niche market of 22 active listings.
Whether you're considering an Airbnb investment in Alles Garden, optimizing your existing vacation rental, or exploring rental arbitrage opportunities, understanding the Alles Garden Airbnb data is crucial. Leveraging the low regulation environment is key to maximizing your short term rental income potential. Let's dive into the specifics.
Key Alles Garden Airbnb Performance Metrics Overview
Monthly Airbnb Revenue Variations & Income Potential in Alles Garden (2026)
Understanding the monthly revenue variations for Airbnb listings in Alles Garden is key to maximizing your short term rental income potential. Seasonality significantly impacts earnings. Our analysis, based on data from the past 12 months, shows that the peak revenue month for STRs in Alles Garden is typically March, while October often presents the lowest earnings, highlighting opportunities for strategic pricing adjustments during shoulder and low seasons. Explore the typical Airbnb income in Alles Garden across different performance tiers:
- Best-in-class properties (Top 10%) achieve $1,104+ monthly, often utilizing dynamic pricing and superior guest experiences.
- Strong performing properties (Top 25%) earn $645 or more, indicating effective management and desirable locations/amenities.
- Typical properties (Median) generate around $254 per month, representing the average market performance.
- Entry-level properties (Bottom 25%) see earnings around $89, often with potential for optimization.
Average Monthly Airbnb Earnings Trend in Alles Garden
Alles Garden Airbnb Occupancy Rate Trends (2026)
Maximize your bookings by understanding the Alles Garden STR occupancy trends. Seasonal demand shifts significantly influence how often properties are booked. Typically, Julysees the highest demand (peak season occupancy), while December experiences the lowest (low season). Effective strategies, like adjusting minimum stays or offering promotions, can boost occupancy during slower periods. Here's how different property tiers perform in Alles Garden:
- Best-in-class properties (Top 10%) achieve 73%+ occupancy, indicating high desirability and potentially optimized availability.
- Strong performing properties (Top 25%) maintain 54% or higher occupancy, suggesting good market fit and guest satisfaction.
- Typical properties (Median) have an occupancy rate around 27%.
- Entry-level properties (Bottom 25%) average 9% occupancy, potentially facing higher vacancy.
Average Monthly Occupancy Rate Trend in Alles Garden
Average Daily Rate (ADR) Airbnb Trends in Alles Garden (2026)
Effective short term rental pricing strategy in Alles Garden involves understanding monthly ADR fluctuations. The Average Daily Rate (ADR) for Airbnb in Alles Garden typically peaks in August and dips lowest during February. Leveraging Airbnb dynamic pricing tools or strategies based on this seasonality can significantly boost revenue. Here's a look at the typical nightly rates achieved:
- Best-in-class properties (Top 10%) command rates of $88+ per night, often due to premium features or locations.
- Strong performing properties (Top 25%) achieve nightly rates of $44 or more.
- Typical properties (Median) charge around $30 per night.
- Entry-level properties (Bottom 25%) earn around $24 per night.
Average Daily Rate (ADR) Trend by Month in Alles Garden
Get Live Alles Garden Market Intelligence 👇

Explore Real-time Analytics
Airbnb Seasonality Analysis & Trends in Alles Garden (2026)
Peak Season (March, May, July)
- Revenue averages $708 per month
- Occupancy rates average 46.5%
- Daily rates average $48
Shoulder Season
- Revenue averages $507 per month
- Occupancy maintains around 35.3%
- Daily rates hold near $46
Low Season (January, October, December)
- Revenue drops to average $305 per month
- Occupancy decreases to average 19.4%
- Daily rates adjust to average $44
Seasonality Insights for Alles Garden
- The Airbnb seasonality in Alles Garden shows highly seasonal trends requiring careful strategy. While the sections above show seasonal averages, it's also insightful to look at the extremes:
- During the high season, the absolute peak month showcases Alles Garden's highest earning potential, with monthly revenues capable of climbing to $765, occupancy reaching a high of 47.6%, and ADRs peaking at $50.
- Conversely, the slowest single month of the year, typically falling within the low season, marks the market's lowest point. In this month, revenue might dip to $269, occupancy could drop to 15.6%, and ADRs may adjust down to $43.
- Understanding both the seasonal averages and these monthly peaks and troughs in revenue, occupancy, and ADR is crucial for maximizing your Airbnb profit potential in Alles Garden.
Seasonal Strategies for Maximizing Profit
- Peak Season: Maximize revenue through premium pricing and potentially longer minimum stays. Ensure high availability.
- Low Season: Offer competitive pricing, special promotions (e.g., extended stay discounts), and flexible cancellation policies. Target off-season travelers like remote workers or budget-conscious guests.
- Shoulder Seasons: Implement dynamic pricing that balances peak and low rates. Target weekend travelers or specific events. Offer slightly more flexible terms than peak season.
- Regularly analyze your own performance against these Alles Garden seasonality benchmarks and adjust your pricing and availability strategy accordingly.
Best Areas for Airbnb Investment in Alles Garden (2026)
Exploring the top neighborhoods for short-term rentals in Alles Garden? This section highlights key areas, outlining why they are attractive for hosts and guests, along with notable local attractions. Consider these locations based on your target guest profile and investment strategy.
| Neighborhood / Area | Why Host Here? (Target Guests & Appeal) | Key Attractions & Landmarks |
|---|---|---|
| Galle Face | A popular beach area attracting tourists for sunbathing, water sports, and local food vendors. Great for casual beachgoers and families. | Galle Face Green, Galle Face Hotel, Beachfront dining, Local food stalls, Water sports activities |
| Negombo Beach | Known for its coastal beauty and vibrant nightlife, Negombo Beach attracts both local and foreign tourists looking to unwind by the sea. | Negombo Lagoon, Angurukaramulla Temple, Negombo Fish Market, Water sports and boat tours, Local seafood restaurants |
| Kandy City Center | A cultural capital with ancient temples and beautiful scenery, Kandy is perfect for travelers interested in history and culture. | Temple of the Tooth, Kandy Lake, Royal Botanical Gardens, Cultural shows, Kandy market |
| Ella | A stunning hill station known for its breathtaking views and hiking opportunities, appealing to nature lovers and adventurers. | Nine Arches Bridge, Ella Rock, Little Adam's Peak, Tea plantations, Ella town cafes |
| Yala National Park | Famed for its wildlife and safaris, Yala attracts nature enthusiasts keen on spotting leopards and diverse wildlife. | Wildlife safaris, Bird watching, Camping facilities, Beautiful landscape, Photography opportunities |
| Colombo Fort | The historical heart of Colombo, where colonial architecture meets modernity, attracting both business travelers and tourists. | Old Dutch Hospital, Colombo Dutch Museum, World Trade Center, Galle Face Green, Shopping at Odel |
| Unawatuna | A trendy beach destination known for its laid-back atmosphere, snorkeling, and vibrant nightlife, popular with backpackers and holidaymakers. | Unawatuna Beach, Japanese Peace Pagoda, Snorkeling and diving spots, Local bars and restaurants, Sea turtle hatchery |
| Hikkaduwa | Famous for its coral reefs and party scene, Hikkaduwa is a hotspot for surfers and travelers looking for a lively beach experience. | Hikkaduwa Beach, Coral reefs, Surfing spots, Beachfront cafes, Nightlife and parties |
Understanding Airbnb License Requirements & STR Laws in Alles Garden (2026)
While Alles Garden, Eastern Province, Sri Lanka currently shows low STR regulations, specific Airbnb license requirements might still exist or change. Always verify the latest short term rental regulations and Airbnb license requirements directly with local government authorities for Alles Garden to ensure full compliance before hosting.
(Source: AirROI data, 2026, finding no licensed listings among those analyzed)
Top Performing Airbnb Properties in Alles Garden (2026)
Benchmark your potential! Explore examples of top-performing Airbnb properties in Alles Gardenbased on Trailing Twelve Month (TTM) revenue. Analyze their characteristics, revenue, occupancy rate, and ADR to understand what drives success in this market.
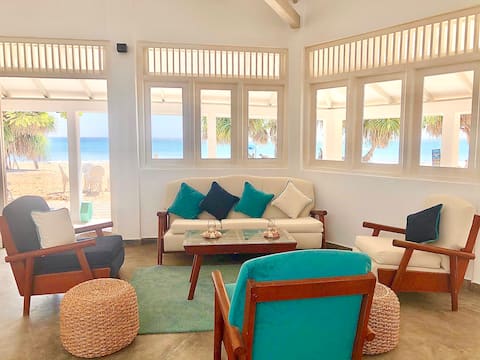
Deluxe Double Room with Sea View
Private Room • N/A
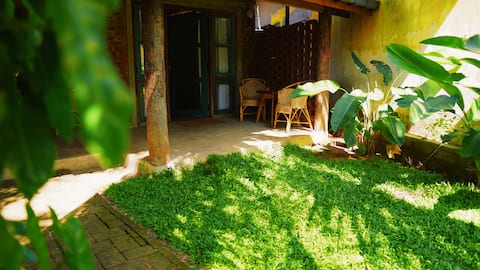
Private Garden Oasis, 6 mins to beach
Entire Place • 3 bedrooms

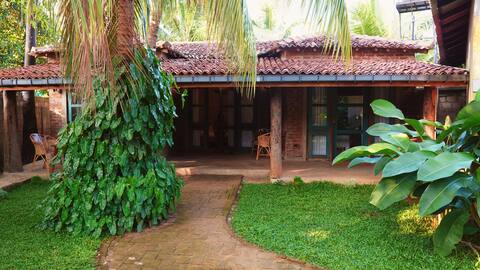
Beach 6 mins Walk: Island Home, Garden oasis
Private Room • 1 bedroom

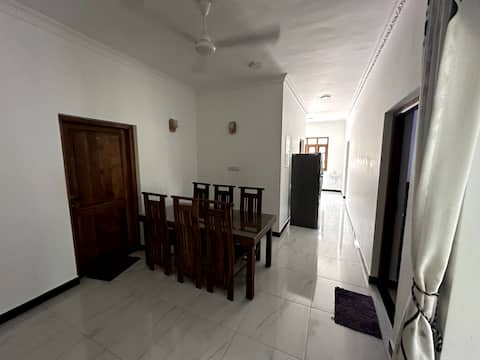
Beach 6 mins Walk: Cozy Home
Private Room • N/A
Beach 6 mins Walk: Holiday Home
Private Room • N/A
Cool Clean Contemporary Villa - 202 South Room
Private Room • N/A
Note: Performance varies based on location, size, amenities, seasonality, and management quality. Data reflects the past 12 months.
Top Performing Airbnb Hosts in Alles Garden (2026)
Learn from the best! This table showcases top-performing Airbnb hosts in Alles Garden based on the number of properties managed and estimated total revenue over the past year. Analyze their scale and performance metrics.
| Host Name | Properties | Grossing Revenue | Stay Reviews | Avg Rating |
|---|---|---|---|---|
| Rizvi | 4 | $38,796 | 119 | 4.86/5.0 |
| Amanda | 1 | $17,029 | 62 | 4.87/5.0 |
| Bernard | 5 | $7,081 | 101 | 4.60/5.0 |
| Shan | 3 | $4,432 | 316 | 4.69/5.0 |
| Kumar | 2 | $2,775 | 2 | Not Rated |
| Vahee | 2 | $1,896 | 6 | 4.20/5.0 |
| Karan | 2 | $1,214 | 5 | 4.25/5.0 |
| Nadeem | 1 | $309 | 17 | 4.12/5.0 |
| Verandas | 1 | $308 | 1 | Not Rated |
| Manojkumar | 1 | $170 | 6 | 3.00/5.0 |
Analyzing the strategies of top hosts, such as their property selection, pricing, and guest communication, can offer valuable lessons for optimizing your own Airbnb operations in Alles Garden.
Dive Deeper: Advanced Alles Garden STR Market Data (2026)
Ready to unlock more insights? AirROI provides access to advanced metrics and comprehensive Airbnb data for Alles Garden. Explore detailed analytics beyond this report to refine your investment strategy, optimize pricing, and maximize your vacation rental profits.
Explore Advanced MetricsAlles Garden Short-Term Rental Market Composition (2026): Property & Room Types
Room Type Distribution
Property Type Distribution
Market Composition Insights for Alles Garden
- The Alles Garden Airbnb market composition is heavily skewed towards Private Room listings, which make up 77.3% of the 22 active rentals. This indicates strong guest preference for privacy and space.
- Looking at the property type distribution in Alles Garden, Hotel/Boutique properties are the most common (45.5%), reflecting the local real estate landscape.
- The presence of 45.5% Hotel/Boutique listings indicates integration with traditional hospitality.
Alles Garden Airbnb Room Capacity Analysis (2026): Bedroom Distribution
Distribution of Listings by Number of Bedrooms
Room Capacity Insights for Alles Garden
- The dominant room capacity in Alles Garden is 1 bedroom listings, making up 54.5% of the market. This suggests a strong demand for properties suitable for couples or solo travelers.
- Together, 1 bedroom and 3 bedrooms properties represent 59.0% of the active Airbnb listings in Alles Garden, indicating a high concentration in these sizes.
- With over half the market (54.5%) consisting of studios or 1-bedroom units, Alles Garden is particularly well-suited for individuals or couples.
- Listings with 3+ bedrooms (9.0%) represent a smaller niche, potentially indicating an underserved market for larger group accommodations in Alles Garden.
Alles Garden Vacation Rental Guest Capacity Trends (2026)
Distribution of Listings by Guest Capacity
Guest Capacity Insights for Alles Garden
- The most common guest capacity trend in Alles Garden vacation rentals is listings accommodating 2 guests (40.9%). This suggests the primary traveler segment is likely couples or solo travelers.
- Properties designed for 2 guests and 3 guests dominate the Alles Garden STR market, accounting for 54.5% of listings.
- A significant 40.9% of listings cater specifically to 1-2 guests, highlighting strong demand from couples and solo travelers in Alles Garden.
- On average, properties in Alles Garden are equipped to host 1.9 guests.
Alles Garden Airbnb Booking Patterns (2026): Available vs. Booked Days
Available Days Distribution
Booked Days Distribution
Booking Pattern Insights for Alles Garden
- The most common availability pattern in Alles Garden falls within the 271-366 days range, representing 72.7% of listings. This suggests many properties have significant open periods on their calendars.
- Approximately 90.9% of listings show high availability (181+ days open annually), indicating potential for increased bookings or specific owner usage patterns.
- For booked days, the 31-90 days range is most frequent in Alles Garden (40.9%), reflecting common guest stay durations or potential owner blocking patterns.
- A notable 9.1% of properties secure long booking periods (181+ days booked per year), highlighting successful long-term rental strategies or significant owner usage.
Alles Garden Airbnb Minimum Stay Requirements Analysis
Distribution of Listings by Minimum Night Requirement
1 Night
17 listings
77.3% of total
2 Nights
1 listings
4.5% of total
30+ Nights
4 listings
18.2% of total
Key Insights
- The most prevalent minimum stay requirement in Alles Garden is 1 Night, adopted by 77.3% of listings. This highlights the market's preference for shorter, flexible bookings.
- A strong majority (81.8%) of the Alles Garden Airbnb data shows acceptance of very short stays (1-2 nights), indicating a dynamic, high-turnover market.
- A significant segment (18.2%) caters to monthly stays (30+ nights) in Alles Garden, pointing to opportunities in the extended-stay market.
Recommendations
- Align with the market by considering a 1 Night minimum stay, as 77.3% of Alles Garden hosts use this setting.
- Explore offering discounts for stays of 30+ nights to attract the 18.2% of the market seeking extended stays.
- Adjust minimum nights based on seasonality – potentially shorter during low season and longer during peak demand periods in Alles Garden.
Alles Garden Airbnb Cancellation Policy Trends Analysis (2026)
Flexible
15 listings
71.4% of total
Firm
6 listings
28.6% of total
Cancellation Policy Insights for Alles Garden
- The prevailing Airbnb cancellation policy trend in Alles Garden is Flexible, used by 71.4% of listings.
- The market strongly favors guest-friendly terms, with 71.4% of listings offering Flexible or Moderate policies. This suggests guests in Alles Garden may expect booking flexibility.
Recommendations for Hosts
- Consider adopting a Flexible policy to align with the 71.4% market standard in Alles Garden.
- Given the high prevalence of Flexible policies (71.4%), offering this can enhance booking appeal, especially during shoulder seasons.
- Regularly review your cancellation policy against competitors and market demand shifts in Alles Garden.
Alles Garden STR Booking Lead Time Analysis (2026)
Average Booking Lead Time by Month
Booking Lead Time Insights for Alles Garden
- The overall average booking lead time for vacation rentals in Alles Garden is 43 days.
- Guests book furthest in advance for stays during August (average 74 days), likely coinciding with peak travel demand or local events.
- The shortest booking windows occur for stays in December (average 6 days), indicating more last-minute travel plans during this time.
- Seasonally, Summer (54 days avg.) sees the longest lead times, while Winter (19 days avg.) has the shortest, reflecting typical travel planning cycles.
Recommendations for Hosts
- Use the overall average lead time (43 days) as a baseline for your pricing and availability strategy in Alles Garden.
- For August stays, consider implementing length-of-stay discounts or slightly higher rates for bookings made less than 74 days out to capitalize on advance planning.
- During December, focus on last-minute booking availability and promotions, as guests book with very short notice (6 days avg.).
- Target marketing efforts for the Summer season well in advance (at least 54 days) to capture early planners.
- Monitor your own booking lead times against these Alles Garden averages to identify opportunities for dynamic pricing adjustments.
Popular & Essential Airbnb Amenities in Alles Garden (2026)
Amenity Prevalence
Amenity Insights for Alles Garden
- Essential amenities in Alles Garden that guests expect include: Wifi. Lacking these (this) could significantly impact bookings.
- Popular amenities like Iron, Dedicated workspace, Air conditioning are common but not universal. Offering these can provide a competitive edge.
Recommendations for Hosts
- Ensure your listing includes all essential amenities for Alles Garden: Wifi.
- Consider adding popular differentiators like Iron or Dedicated workspace to increase appeal.
- Highlight unique or less common amenities you offer (e.g., hot tub, dedicated workspace, EV charger) in your listing description and photos.
- Regularly check competitor amenities in Alles Garden to stay competitive.
Alles Garden Airbnb Guest Demographics & Profile Analysis (2026)
Guest Profile Summary for Alles Garden
- The typical guest profile for Airbnb in Alles Garden consists of predominantly international visitors (99%), with top international origins including France, typically belonging to the Post-2000s (Gen Z/Alpha) group (50%), primarily speaking English or French.
- Domestic travelers account for 1.3% of guests.
- Key international markets include Germany (21.5%) and France (13.9%).
- Top languages spoken are English (41.3%) followed by French (16.3%).
- A significant demographic segment is the Post-2000s (Gen Z/Alpha) group, representing 50% of guests.
Recommendations for Hosts
- Focus marketing internationally, particularly towards travelers from France.
- Tailor amenities and listing descriptions to appeal to the dominant Post-2000s (Gen Z/Alpha) demographic (e.g., highlight fast WiFi, smart home features, local guides).
- Highlight unique local experiences or amenities relevant to the primary guest profile.
- Consider seasonal promotions aligned with peak travel times for key origin markets.
Nearby Short-Term Rental Market Comparison
How does the Alles Garden Airbnb market stack up against its neighbors? Compare key performance metrics like average monthly revenue, ADR, and occupancy rates in surrounding areas to understand the broader regional STR landscape.
| Market | Active Properties | Monthly Revenue | Daily Rate | Avg. Occupancy |
|---|---|---|---|---|
| Anniewatta | 10 | $1,421 | $76.55 | 47% |
| Maberiyatenna | 12 | $1,323 | $237.64 | 28% |
| Trincomalee | 44 | $1,092 | $115.79 | 35% |
| Nilaveli | 45 | $716 | $111.57 | 29% |
| Halloluwa | 15 | $512 | $51.01 | 33% |
| Habarana | 24 | $487 | $72.76 | 32% |
| Kimbissa | 14 | $441 | $47.06 | 29% |
| Komari | 10 | $409 | $63.18 | 34% |
| Kandy | 224 | $386 | $67.67 | 26% |
| Sigiriya | 71 | $311 | $47.00 | 31% |