Morne Fortune Airbnb Market Analysis 2026: Short Term Rental Data & Vacation Rental Statistics in Castries, St. Lucia
Is Airbnb profitable in Morne Fortune in 2026? Explore comprehensive Airbnb analytics for Morne Fortune, Castries, St. Lucia to uncover income potential. This 2026 STR market report for Morne Fortune, based on AirROI data from December 2024 to November 2025, reveals key trends in the niche market of 18 active listings.
Whether you're considering an Airbnb investment in Morne Fortune, optimizing your existing vacation rental, or exploring rental arbitrage opportunities, understanding the Morne Fortune Airbnb data is crucial. Leveraging the low regulation environment is key to maximizing your short term rental income potential. Let's dive into the specifics.
Key Morne Fortune Airbnb Performance Metrics Overview
Monthly Airbnb Revenue Variations & Income Potential in Morne Fortune (2026)
Understanding the monthly revenue variations for Airbnb listings in Morne Fortune is key to maximizing your short term rental income potential. Seasonality significantly impacts earnings. Our analysis, based on data from the past 12 months, shows that the peak revenue month for STRs in Morne Fortune is typically December, while September often presents the lowest earnings, highlighting opportunities for strategic pricing adjustments during shoulder and low seasons. Explore the typical Airbnb income in Morne Fortune across different performance tiers:
- Best-in-class properties (Top 10%) achieve $2,602+ monthly, often utilizing dynamic pricing and superior guest experiences.
- Strong performing properties (Top 25%) earn $1,773 or more, indicating effective management and desirable locations/amenities.
- Typical properties (Median) generate around $1,193 per month, representing the average market performance.
- Entry-level properties (Bottom 25%) see earnings around $731, often with potential for optimization.
Average Monthly Airbnb Earnings Trend in Morne Fortune
Morne Fortune Airbnb Occupancy Rate Trends (2026)
Maximize your bookings by understanding the Morne Fortune STR occupancy trends. Seasonal demand shifts significantly influence how often properties are booked. Typically, Februarysees the highest demand (peak season occupancy), while October experiences the lowest (low season). Effective strategies, like adjusting minimum stays or offering promotions, can boost occupancy during slower periods. Here's how different property tiers perform in Morne Fortune:
- Best-in-class properties (Top 10%) achieve 69%+ occupancy, indicating high desirability and potentially optimized availability.
- Strong performing properties (Top 25%) maintain 51% or higher occupancy, suggesting good market fit and guest satisfaction.
- Typical properties (Median) have an occupancy rate around 35%.
- Entry-level properties (Bottom 25%) average 23% occupancy, potentially facing higher vacancy.
Average Monthly Occupancy Rate Trend in Morne Fortune
Average Daily Rate (ADR) Airbnb Trends in Morne Fortune (2026)
Effective short term rental pricing strategy in Morne Fortune involves understanding monthly ADR fluctuations. The Average Daily Rate (ADR) for Airbnb in Morne Fortune typically peaks in May and dips lowest during November. Leveraging Airbnb dynamic pricing tools or strategies based on this seasonality can significantly boost revenue. Here's a look at the typical nightly rates achieved:
- Best-in-class properties (Top 10%) command rates of $215+ per night, often due to premium features or locations.
- Strong performing properties (Top 25%) achieve nightly rates of $133 or more.
- Typical properties (Median) charge around $117 per night.
- Entry-level properties (Bottom 25%) earn around $80 per night.
Average Daily Rate (ADR) Trend by Month in Morne Fortune
Get Live Morne Fortune Market Intelligence 👇
Explore Real-time Analytics
Airbnb Seasonality Analysis & Trends in Morne Fortune (2025)
Peak Season (December, March, February)
- Revenue averages $1,994 per month
- Occupancy rates average 54.0%
- Daily rates average $121
Shoulder Season
- Revenue averages $1,402 per month
- Occupancy maintains around 40.1%
- Daily rates hold near $122
Low Season (September, October, November)
- Revenue drops to average $787 per month
- Occupancy decreases to average 24.1%
- Daily rates adjust to average $117
Seasonality Insights for Morne Fortune
- The Airbnb seasonality in Morne Fortune shows highly seasonal trends requiring careful strategy. While the sections above show seasonal averages, it's also insightful to look at the extremes:
- During the high season, the absolute peak month showcases Morne Fortune's highest earning potential, with monthly revenues capable of climbing to $2,089, occupancy reaching a high of 57.9%, and ADRs peaking at $126.
- Conversely, the slowest single month of the year, typically falling within the low season, marks the market's lowest point. In this month, revenue might dip to $621, occupancy could drop to 20.4%, and ADRs may adjust down to $114.
- Understanding both the seasonal averages and these monthly peaks and troughs in revenue, occupancy, and ADR is crucial for maximizing your Airbnb profit potential in Morne Fortune.
Seasonal Strategies for Maximizing Profit
- Peak Season: Maximize revenue through premium pricing and potentially longer minimum stays. Ensure high availability.
- Low Season: Offer competitive pricing, special promotions (e.g., extended stay discounts), and flexible cancellation policies. Target off-season travelers like remote workers or budget-conscious guests.
- Shoulder Seasons: Implement dynamic pricing that balances peak and low rates. Target weekend travelers or specific events. Offer slightly more flexible terms than peak season.
- Regularly analyze your own performance against these Morne Fortune seasonality benchmarks and adjust your pricing and availability strategy accordingly.
Best Areas for Airbnb Investment in Morne Fortune (2026)
Exploring the top neighborhoods for short-term rentals in Morne Fortune? This section highlights key areas, outlining why they are attractive for hosts and guests, along with notable local attractions. Consider these locations based on your target guest profile and investment strategy.
| Neighborhood / Area | Why Host Here? (Target Guests & Appeal) | Key Attractions & Landmarks |
|---|---|---|
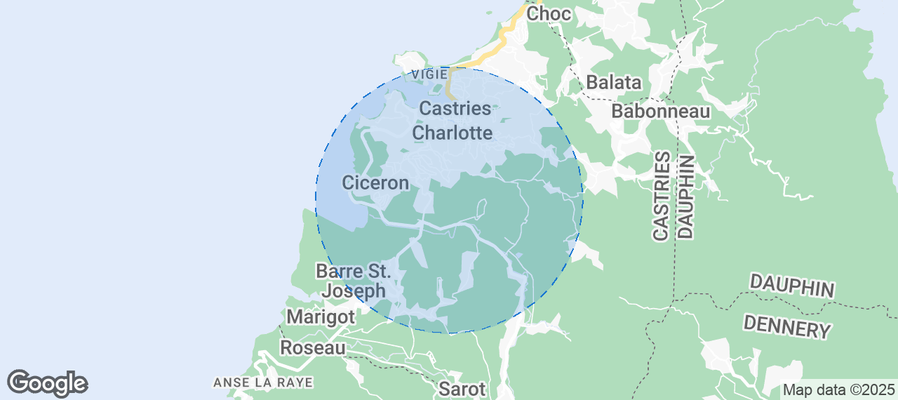
| Morne Fortune | A picturesque neighborhood with stunning views of Castries and the Caribbean Sea. Known for its historical significance and vibrant culture, it's popular among tourists looking for unique lodging options close to the city. | Fort Charlotte, The Government House, Morne Fortune Lookout, Castries Market, La Toc Beach |
| Castries Harbor | A bustling area providing beautiful waterfront views, restaurants, and the local market experience. Great for tourists wanting to explore the vibrant local culture and enjoy water activities. | Castries Market, Derek Walcott Square, The Cathedral of the Immaculate Conception, Shopping at Pointe Seraphine, Waterfront Activities |
| Anse La Raye | A charming fishing village that offers a more authentic St. Lucian experience. Known for its local festivals and seafood, it's perfect for those looking for a unique getaway. | Anse La Raye Beach, Local Fish Fry, Waterfalls, Scenic Coastal Views |
| Marigot Bay | A beautiful bay known for its picturesque views and luxury yacht marina. Attracts tourists looking for a relaxing vacation and water activities. | Marigot Bay Beach, Ziplining, Kayaking, Local Restaurants, Scenic Hiking Trails |
| Pigeon Island | A historical site and national park with stunning beaches and hiking trails. Ideal for tourists interested in history, culture, and natural beauty. | Pigeon Island National Park, Fort Rodney, Beautiful Beaches, Snorkeling and Diving Opportunities |
| Gros Islet | Popular tourist destination known for its lively nightlife, local entertainment, and gorgeous beaches. Offers a blend of relaxation and adventure for guests. | Rodney Bay, The Friday Night Street Party, Reduit Beach, Relaxing Lounges and Bars |
| Soufrière | Home to the famous Pitons and lush tropical landscapes, this area is designed for tourists interested in adventure and nature. Offers unique experiences like hiking and hot springs. | The Pitons, Sulphur Springs, Diamond Falls Botanical Gardens, Hiking Trails, Snorkeling at Anse Chastanet |
| Rodney Bay | A hub for watersports and leisure activities, this area is known for its beautiful marina and beachfront. Attracts both relaxing vacationers and active tourists looking for fun. | Rodney Bay Marina, Leisure Activities, Good Restaurants, Beachfront Properties, Nighlife |
Understanding Airbnb License Requirements & STR Laws in Morne Fortune (2026)
While Morne Fortune, Castries, St. Lucia currently shows low STR regulations, specific Airbnb license requirements might still exist or change. Always verify the latest short term rental regulations and Airbnb license requirements directly with local government authorities for Morne Fortune to ensure full compliance before hosting.
(Source: AirROI data, 2026, finding no licensed listings among those analyzed)
Top Performing Airbnb Properties in Morne Fortune (2026)
Benchmark your potential! Explore examples of top-performing Airbnb properties in Morne Fortunebased on Trailing Twelve Month (TTM) revenue. Analyze their characteristics, revenue, occupancy rate, and ADR to understand what drives success in this market.
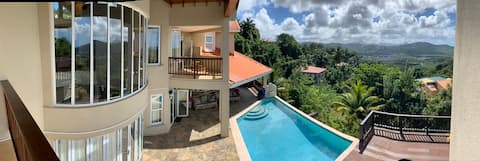
Villa Xona - Great for couples, families & friends
Entire Place • 6 bedrooms

Caribbean Sea View 2 Beds 2 Bath
Entire Place • 2 bedrooms
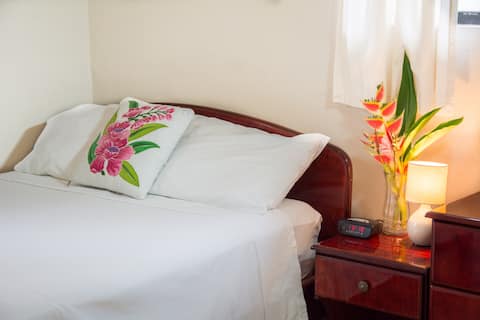
The Morne Seaview Apartment 1
Entire Place • 2 bedrooms

Hammock Suites - Kako
Private Room • 1 bedroom

Hammock Suites Ponm Danmou
Private Room • 1 bedroom

Samaan Estate - Harbour View (Studio 3 of 3)
Entire Place • 1 bedroom
Note: Performance varies based on location, size, amenities, seasonality, and management quality. Data reflects the past 12 months.
Top Performing Airbnb Hosts in Morne Fortune (2026)
Learn from the best! This table showcases top-performing Airbnb hosts in Morne Fortune based on the number of properties managed and estimated total revenue over the past year. Analyze their scale and performance metrics.
| Host Name | Properties | Grossing Revenue | Stay Reviews | Avg Rating |
|---|---|---|---|---|
| Jallim | 4 | $57,147 | 79 | 4.71/5.0 |
| Morne SeaView Apartments | 4 | $55,980 | 290 | 4.71/5.0 |
| Douglas | 4 | $48,509 | 104 | 4.98/5.0 |
| Cheryl | 1 | $34,024 | 72 | 4.79/5.0 |
| Sonia | 1 | $29,396 | 95 | 4.99/5.0 |
| Cathy | 1 | $12,929 | 26 | 4.81/5.0 |
| Knedy | 2 | $4,110 | 7 | 5.00/5.0 |
| Claudette | 1 | $1,209 | 1 | Not Rated |
Analyzing the strategies of top hosts, such as their property selection, pricing, and guest communication, can offer valuable lessons for optimizing your own Airbnb operations in Morne Fortune.
Dive Deeper: Advanced Morne Fortune STR Market Data (2026)
Ready to unlock more insights? AirROI provides access to advanced metrics and comprehensive Airbnb data for Morne Fortune. Explore detailed analytics beyond this report to refine your investment strategy, optimize pricing, and maximize your vacation rental profits.
Explore Advanced MetricsMorne Fortune Short-Term Rental Market Composition (2026): Property & Room Types
Room Type Distribution
Property Type Distribution
Market Composition Insights for Morne Fortune
- The Morne Fortune Airbnb market composition is heavily skewed towards Entire Home/Apt listings, which make up 66.7% of the 18 active rentals. This indicates strong guest preference for privacy and space.
- However, a notable 33.3% share for Private Rooms suggests opportunities for budget-conscious travelers or hosts renting out spare rooms.
- Looking at the property type distribution in Morne Fortune, Apartment/Condo properties are the most common (33.3%), reflecting the local real estate landscape.
- Houses represent a significant 27.8% portion, catering likely to families or larger groups.
- The presence of 22.2% Hotel/Boutique listings indicates integration with traditional hospitality.
Morne Fortune Airbnb Room Capacity Analysis (2026): Bedroom Distribution
Distribution of Listings by Number of Bedrooms
Room Capacity Insights for Morne Fortune
- The dominant room capacity in Morne Fortune is 1 bedroom listings, making up 50% of the market. This suggests a strong demand for properties suitable for couples or solo travelers.
- Together, 1 bedroom and 2 bedrooms properties represent 66.7% of the active Airbnb listings in Morne Fortune, indicating a high concentration in these sizes.
- A significant 22.3% of listings offer 3+ bedrooms, catering to larger groups and families seeking more space in Morne Fortune.
Morne Fortune Vacation Rental Guest Capacity Trends (2026)
Distribution of Listings by Guest Capacity
Guest Capacity Insights for Morne Fortune
- The most common guest capacity trend in Morne Fortune vacation rentals is listings accommodating 2 guests (61.1%). This suggests the primary traveler segment is likely couples or solo travelers.
- Properties designed for 2 guests and 6 guests dominate the Morne Fortune STR market, accounting for 72.2% of listings.
- A significant 61.1% of listings cater specifically to 1-2 guests, highlighting strong demand from couples and solo travelers in Morne Fortune.
- 16.7% of properties accommodate 6+ guests, serving the market segment for larger families or group travel in Morne Fortune.
- On average, properties in Morne Fortune are equipped to host 2.8 guests.
Morne Fortune Airbnb Booking Patterns (2026): Available vs. Booked Days
Available Days Distribution
Booked Days Distribution
Booking Pattern Insights for Morne Fortune
- The most common availability pattern in Morne Fortune falls within the 181-270 days range, representing 44.4% of listings. This suggests many properties have significant open periods on their calendars.
- Approximately 77.7% of listings show high availability (181+ days open annually), indicating potential for increased bookings or specific owner usage patterns.
- For booked days, the 91-180 days range is most frequent in Morne Fortune (44.4%), reflecting common guest stay durations or potential owner blocking patterns.
- A notable 22.2% of properties secure long booking periods (181+ days booked per year), highlighting successful long-term rental strategies or significant owner usage.
Morne Fortune Airbnb Minimum Stay Requirements Analysis
Distribution of Listings by Minimum Night Requirement
1 Night
7 listings
38.9% of total
2 Nights
5 listings
27.8% of total
3 Nights
1 listings
5.6% of total
4-6 Nights
3 listings
16.7% of total
30+ Nights
2 listings
11.1% of total
Key Insights
- The most prevalent minimum stay requirement in Morne Fortune is 1 Night, adopted by 38.9% of listings. This highlights the market's preference for shorter, flexible bookings.
- A strong majority (66.7%) of the Morne Fortune Airbnb data shows acceptance of very short stays (1-2 nights), indicating a dynamic, high-turnover market.
- A significant segment (11.1%) caters to monthly stays (30+ nights) in Morne Fortune, pointing to opportunities in the extended-stay market.
Recommendations
- Align with the market by considering a 1 Night minimum stay, as 38.9% of Morne Fortune hosts use this setting.
- Explore offering discounts for stays of 30+ nights to attract the 11.1% of the market seeking extended stays.
- Adjust minimum nights based on seasonality – potentially shorter during low season and longer during peak demand periods in Morne Fortune.
Morne Fortune Airbnb Cancellation Policy Trends Analysis (2026)
Flexible
10 listings
55.6% of total
Moderate
4 listings
22.2% of total
Firm
4 listings
22.2% of total
Cancellation Policy Insights for Morne Fortune
- The prevailing Airbnb cancellation policy trend in Morne Fortune is Flexible, used by 55.6% of listings.
- The market strongly favors guest-friendly terms, with 77.8% of listings offering Flexible or Moderate policies. This suggests guests in Morne Fortune may expect booking flexibility.
Recommendations for Hosts
- Consider adopting a Flexible policy to align with the 55.6% market standard in Morne Fortune.
- Given the high prevalence of Flexible policies (55.6%), offering this can enhance booking appeal, especially during shoulder seasons.
- Regularly review your cancellation policy against competitors and market demand shifts in Morne Fortune.
Morne Fortune STR Booking Lead Time Analysis (2026)
Average Booking Lead Time by Month
Booking Lead Time Insights for Morne Fortune
- The overall average booking lead time for vacation rentals in Morne Fortune is 44 days.
- Guests book furthest in advance for stays during July (average 93 days), likely coinciding with peak travel demand or local events.
- The shortest booking windows occur for stays in December (average 26 days), indicating more last-minute travel plans during this time.
- Seasonally, Summer (59 days avg.) sees the longest lead times, while Winter (31 days avg.) has the shortest, reflecting typical travel planning cycles.
Recommendations for Hosts
- Use the overall average lead time (44 days) as a baseline for your pricing and availability strategy in Morne Fortune.
- For July stays, consider implementing length-of-stay discounts or slightly higher rates for bookings made less than 93 days out to capitalize on advance planning.
- Target marketing efforts for the Summer season well in advance (at least 59 days) to capture early planners.
- Monitor your own booking lead times against these Morne Fortune averages to identify opportunities for dynamic pricing adjustments.
Popular & Essential Airbnb Amenities in Morne Fortune (2026)
Amenity Prevalence
Amenity Insights for Morne Fortune
- Essential amenities in Morne Fortune that guests expect include: Iron, Free parking on premises, Wifi. Lacking these (any) could significantly impact bookings.
- Popular amenities like TV, Hangers, Microwave are common but not universal. Offering these can provide a competitive edge.
Recommendations for Hosts
- Ensure your listing includes all essential amenities for Morne Fortune: Iron, Free parking on premises, Wifi.
- Consider adding popular differentiators like TV or Hangers to increase appeal.
- Highlight unique or less common amenities you offer (e.g., hot tub, dedicated workspace, EV charger) in your listing description and photos.
- Regularly check competitor amenities in Morne Fortune to stay competitive.
Morne Fortune Airbnb Guest Demographics & Profile Analysis (2026)
Guest Profile Summary for Morne Fortune
- The typical guest profile for Airbnb in Morne Fortune consists of predominantly international visitors (100%), with top international origins including Canada, typically belonging to the Post-2000s (Gen Z/Alpha) group (50%), primarily speaking English or French.
- Domestic travelers account for 0.0% of guests.
- Key international markets include United States (49.3%) and Canada (11.9%).
- Top languages spoken are English (61.2%) followed by French (14.3%).
- A significant demographic segment is the Post-2000s (Gen Z/Alpha) group, representing 50% of guests.
Recommendations for Hosts
- Focus marketing internationally, particularly towards travelers from Canada.
- Tailor amenities and listing descriptions to appeal to the dominant Post-2000s (Gen Z/Alpha) demographic (e.g., highlight fast WiFi, smart home features, local guides).
- Highlight unique local experiences or amenities relevant to the primary guest profile.
- Consider seasonal promotions aligned with peak travel times for key origin markets.
Nearby Short-Term Rental Market Comparison
How does the Morne Fortune Airbnb market stack up against its neighbors? Compare key performance metrics like average monthly revenue, ADR, and occupancy rates in surrounding areas to understand the broader regional STR landscape.
| Market | Active Properties | Monthly Revenue | Daily Rate | Avg. Occupancy |
|---|---|---|---|---|
| Rock Dundo | 21 | $5,330 | $583.96 | 46% |
| Belair | 33 | $5,281 | $500.83 | 39% |
| Westerhall Point | 10 | $4,871 | $485.97 | 38% |
| Gibbes | 19 | $4,846 | $475.00 | 43% |
| Prospect | 30 | $4,836 | $415.60 | 49% |
| Clinketts | 13 | $4,674 | $428.37 | 48% |
| Mount Standfast | 394 | $4,473 | $587.42 | 41% |
| Mullins | 46 | $4,205 | $423.18 | 47% |
| Cap Estate | 17 | $3,977 | $612.65 | 34% |
| Speightstown | 57 | $3,855 | $411.80 | 49% |