Laborie Airbnb Market Analysis 2025: Short Term Rental Data & Vacation Rental Statistics in Laborie, St. Lucia
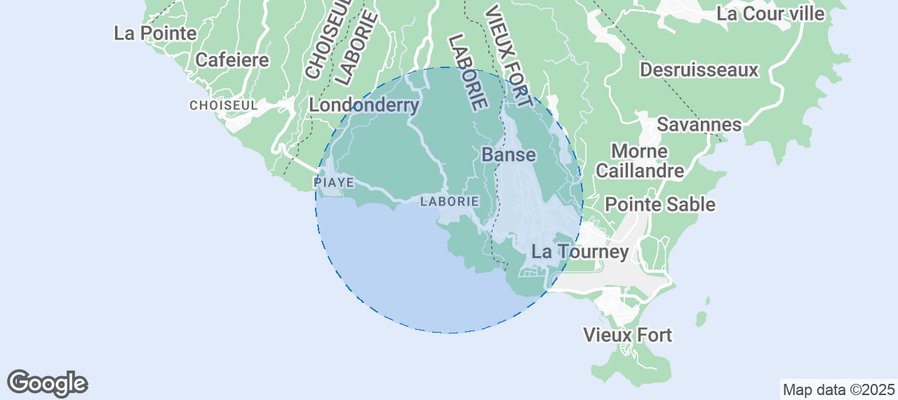
Is Airbnb profitable in Laborie in 2025? Explore comprehensive Airbnb analytics for Laborie, Laborie, St. Lucia to uncover income potential. This 2025 STR market report for Laborie, based on AirROI data from May 2024 to April 2025, reveals key trends in the niche market of 46 active listings.
Whether you're considering an Airbnb investment in Laborie, optimizing your existing vacation rental, or exploring rental arbitrage opportunities, understanding the Laborie Airbnb data is crucial. Leveraging the low regulation environment is key to maximizing your short term rental income potential. Let's dive into the specifics.
Key Laborie Airbnb Performance Metrics Overview
Monthly Airbnb Revenue Variations & Income Potential in Laborie (2025)
Understanding the monthly revenue variations for Airbnb listings in Laborie is key to maximizing your short term rental income potential. Seasonality significantly impacts earnings. Our analysis, based on data from the past 12 months, shows that the peak revenue month for STRs in Laborie is typically January, while June often presents the lowest earnings, highlighting opportunities for strategic pricing adjustments during shoulder and low seasons. Explore the typical Airbnb income in Laborie across different performance tiers:
- Best-in-class properties (Top 10%) achieve $3,321+ monthly, often utilizing dynamic pricing and superior guest experiences.
- Strong performing properties (Top 25%) earn $2,302 or more, indicating effective management and desirable locations/amenities.
- Typical properties (Median) generate around $1,285 per month, representing the average market performance.
- Entry-level properties (Bottom 25%) see earnings around $573, often with potential for optimization.
Average Monthly Airbnb Earnings Trend in Laborie
Laborie Airbnb Occupancy Rate Trends (2025)
Maximize your bookings by understanding the Laborie STR occupancy trends. Seasonal demand shifts significantly influence how often properties are booked. Typically, Januarysees the highest demand (peak season occupancy), while October experiences the lowest (low season). Effective strategies, like adjusting minimum stays or offering promotions, can boost occupancy during slower periods. Here's how different property tiers perform in Laborie:
- Best-in-class properties (Top 10%) achieve 79%+ occupancy, indicating high desirability and potentially optimized availability.
- Strong performing properties (Top 25%) maintain 68% or higher occupancy, suggesting good market fit and guest satisfaction.
- Typical properties (Median) have an occupancy rate around 43%.
- Entry-level properties (Bottom 25%) average 23% occupancy, potentially facing higher vacancy.
Average Monthly Occupancy Rate Trend in Laborie
Average Daily Rate (ADR) Airbnb Trends in Laborie (2025)
Effective short term rental pricing strategy in Laborie involves understanding monthly ADR fluctuations. The Average Daily Rate (ADR) for Airbnb in Laborie typically peaks in February and dips lowest during September. Leveraging Airbnb dynamic pricing tools or strategies based on this seasonality can significantly boost revenue. Here's a look at the typical nightly rates achieved:
- Best-in-class properties (Top 10%) command rates of $177+ per night, often due to premium features or locations.
- Strong performing properties (Top 25%) achieve nightly rates of $113 or more.
- Typical properties (Median) charge around $81 per night.
- Entry-level properties (Bottom 25%) earn around $61 per night.
Average Daily Rate (ADR) Trend by Month in Laborie
Get Live Laborie Market Intelligence 👇
Explore Real-time Analytics
Airbnb Seasonality Analysis & Trends in Laborie (2025)
Peak Season (January, March, December)
- Revenue averages $2,737 per month
- Occupancy rates average 56.0%
- Daily rates average $154
Shoulder Season
- Revenue averages $2,063 per month
- Occupancy maintains around 45.4%
- Daily rates hold near $123
Low Season (May, June, October)
- Revenue drops to average $1,348 per month
- Occupancy decreases to average 35.9%
- Daily rates adjust to average $107
Seasonality Insights for Laborie
- The Airbnb seasonality in Laborie shows highly seasonal trends requiring careful strategy. While the sections above show seasonal averages, it's also insightful to look at the extremes:
- During the high season, the absolute peak month showcases Laborie's highest earning potential, with monthly revenues capable of climbing to $2,930, occupancy reaching a high of 64.5%, and ADRs peaking at $156.
- Conversely, the slowest single month of the year, typically falling within the low season, marks the market's lowest point. In this month, revenue might dip to $1,233, occupancy could drop to 31.2%, and ADRs may adjust down to $105.
- Understanding both the seasonal averages and these monthly peaks and troughs in revenue, occupancy, and ADR is crucial for maximizing your Airbnb profit potential in Laborie.
Seasonal Strategies for Maximizing Profit
- Peak Season: Maximize revenue through premium pricing and potentially longer minimum stays. Ensure high availability.
- Low Season: Offer competitive pricing, special promotions (e.g., extended stay discounts), and flexible cancellation policies. Target off-season travelers like remote workers or budget-conscious guests.
- Shoulder Seasons: Implement dynamic pricing that balances peak and low rates. Target weekend travelers or specific events. Offer slightly more flexible terms than peak season.
- Regularly analyze your own performance against these Laborie seasonality benchmarks and adjust your pricing and availability strategy accordingly.
Best Areas for Airbnb Investment in Laborie (2025)
Exploring the top neighborhoods for short-term rentals in Laborie? This section highlights key areas, outlining why they are attractive for hosts and guests, along with notable local attractions. Consider these locations based on your target guest profile and investment strategy.
| Neighborhood / Area | Why Host Here? (Target Guests & Appeal) | Key Attractions & Landmarks |
|---|---|---|
| Anse Chastanet | A stunning beach destination known for its crystal-clear waters, coral reefs, and lush surroundings. Ideal for vacationers seeking relaxation and outdoor activities like snorkeling and diving. | Anse Chastanet Beach, Coral reefs, Jade Mountain, Snorkeling and diving excursions, Hiking trails |
| Soufrière | Famous for its natural beauty, including the Pitons and hot springs. A great location for tourists interested in adventure, wellness, and local culture. | The Pitons, Sulphur Springs, Diamond Falls Botanical Gardens, Anse Mamin Beach, Local market |
| Laborie Village | A charming fishing village with a laid-back atmosphere, authentic local culture, and beautiful beaches. Great for tourists looking for a more tranquil experience. | Laborie Beach, Local seafood restaurants, Community events, Water sports activities |
| Vieux Fort | Close to the international airport and known for its beautiful coastline and history. Perfect for travelers needing convenience and those interested in exploring the southern part of the island. | Pigeon Island, Sandy Beach, Fort Chambord, Local shops and restaurants, Windward Islands |
| Marigot Bay | A picturesque bay known for its stunning views and luxury accommodations. Attracts travelers looking for a serene getaway with options for sailing and water sports. | Marigot Bay Beach, Sailing and boating tours, Local restaurants, Scenic views, Luxury villas |
| Rodney Bay | A bustling area known for vibrant nightlife, water sports, and shopping. Excellent for young travelers and those looking for entertainment alongside relaxation. | Reduit Beach, Rodney Bay Marina, Castries Market, Shopping outlets, Nightclubs and bars |
| Pigeon Island | A historical site and nature reserve with beautiful beaches. Popular among tourists who enjoy both history and nature. | Pigeon Island National Park, Historical ruins, Beaches, Walking trails, Snorkeling and swimming |
| Castries | The capital city with rich cultural attractions and a lively atmosphere. Great for tourists interested in history, shopping, and local life. | Castries Market, Cathedral Basilica of the Immaculate Conception, Harbour views, Local cuisine, Historical sites |
Understanding Airbnb License Requirements & STR Laws in Laborie (2025)
While Laborie, Laborie, St. Lucia currently shows low STR regulations, specific Airbnb license requirements might still exist or change. Always verify the latest short term rental regulations and Airbnb license requirements directly with local government authorities for Laborie to ensure full compliance before hosting.
(Source: AirROI data, 2025, finding no licensed listings among those analyzed)
Top Performing Airbnb Properties in Laborie (2025)
Benchmark your potential! Explore examples of top-performing Airbnb properties in Laboriebased on Trailing Twelve Month (TTM) revenue. Analyze their characteristics, revenue, occupancy rate, and ADR to understand what drives success in this market.
Mango Verte Escape Caribbean Vacation Rental
Entire Place • 5 bedrooms

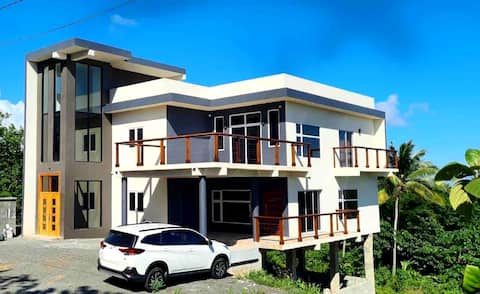
Bay Treehouse
Entire Place • 1 bedroom
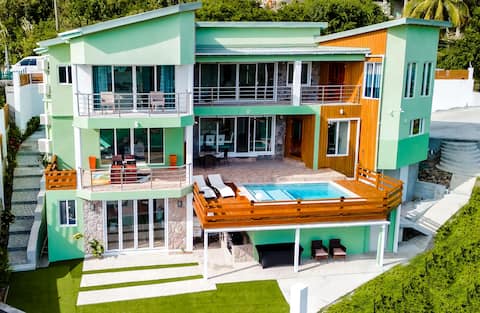
Sky Luxury Villa with Sky Pool & Scenic Ocean View
Entire Place • 2 bedrooms
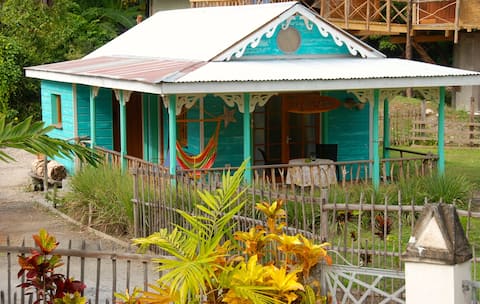
Driftwood Beach Cottage
Entire Place • 1 bedroom

Mango Splash
Entire Place • 1 bedroom

Azura - beach front house with shared secure pool
Entire Place • 2 bedrooms
Note: Performance varies based on location, size, amenities, seasonality, and management quality. Data reflects the past 12 months.
Top Performing Airbnb Hosts in Laborie (2025)
Learn from the best! This table showcases top-performing Airbnb hosts in Laborie based on the number of properties managed and estimated total revenue over the past year. Analyze their scale and performance metrics.
| Host Name | Properties | Grossing Revenue | Stay Reviews | Avg Rating |
|---|---|---|---|---|
| Esma | 1 | $248,402 | 14 | 4.93/5.0 |
| Tony | 3 | $126,863 | 455 | 4.96/5.0 |
| Myrna Elizabeth | 2 | $47,941 | 203 | 4.82/5.0 |
| Lincoln | 2 | $41,910 | 56 | 4.66/5.0 |
| Bertrand | 1 | $38,762 | 32 | 4.94/5.0 |
| Sasha | 2 | $33,773 | 7 | 4.83/5.0 |
| Evelyne | 2 | $32,179 | 242 | 4.83/5.0 |
| Irma | 2 | $28,650 | 83 | 4.75/5.0 |
| Henson | 1 | $24,207 | 19 | 4.89/5.0 |
| Philip | 1 | $23,608 | 109 | 4.88/5.0 |
Analyzing the strategies of top hosts, such as their property selection, pricing, and guest communication, can offer valuable lessons for optimizing your own Airbnb operations in Laborie.
Dive Deeper: Advanced Laborie STR Market Data (2025)
Ready to unlock more insights? AirROI provides access to advanced metrics and comprehensive Airbnb data for Laborie. Explore detailed analytics beyond this report to refine your investment strategy, optimize pricing, and maximize your vacation rental profits.
Explore Advanced MetricsLaborie Short-Term Rental Market Composition (2025): Property & Room Types
Room Type Distribution
Property Type Distribution
Market Composition Insights for Laborie
- The Laborie Airbnb market composition is heavily skewed towards Entire Home/Apt listings, which make up 95.7% of the 46 active rentals. This indicates strong guest preference for privacy and space.
- Looking at the property type distribution in Laborie, Apartment/Condo properties are the most common (47.8%), reflecting the local real estate landscape.
- Houses represent a significant 43.5% portion, catering likely to families or larger groups.
- Smaller segments like unique stays, outdoor/unique, others, hotel/boutique (combined 8.8%) offer potential for unique stay experiences.
Laborie Airbnb Room Capacity Analysis (2025): Bedroom Distribution
Distribution of Listings by Number of Bedrooms
Room Capacity Insights for Laborie
- The dominant room capacity in Laborie is 1 bedroom listings, making up 43.5% of the market. This suggests a strong demand for properties suitable for couples or solo travelers.
- Together, 1 bedroom and 2 bedrooms properties represent 78.3% of the active Airbnb listings in Laborie, indicating a high concentration in these sizes.
Laborie Vacation Rental Guest Capacity Trends (2025)
Distribution of Listings by Guest Capacity
Guest Capacity Insights for Laborie
- The most common guest capacity trend in Laborie vacation rentals is listings accommodating 2 guests (47.8%). This suggests the primary traveler segment is likely couples or solo travelers.
- Properties designed for 2 guests and 4 guests dominate the Laborie STR market, accounting for 78.2% of listings.
- A significant 47.8% of listings cater specifically to 1-2 guests, highlighting strong demand from couples and solo travelers in Laborie.
- 13.0% of properties accommodate 6+ guests, serving the market segment for larger families or group travel in Laborie.
- On average, properties in Laborie are equipped to host 3.3 guests.
Laborie Airbnb Booking Patterns (2025): Available vs. Booked Days
Available Days Distribution
Booked Days Distribution
Booking Pattern Insights for Laborie
- The most common availability pattern in Laborie falls within the 271-366 days range, representing 39.1% of listings. This suggests many properties have significant open periods on their calendars.
- Approximately 63.0% of listings show high availability (181+ days open annually), indicating potential for increased bookings or specific owner usage patterns.
- For booked days, the 181-270 days range is most frequent in Laborie (32.6%), reflecting common guest stay durations or potential owner blocking patterns.
- A notable 36.9% of properties secure long booking periods (181+ days booked per year), highlighting successful long-term rental strategies or significant owner usage.
Laborie Airbnb Minimum Stay Requirements Analysis
Distribution of Listings by Minimum Night Requirement
1 Night
10 listings
21.7% of total
2 Nights
13 listings
28.3% of total
3 Nights
14 listings
30.4% of total
4-6 Nights
3 listings
6.5% of total
30+ Nights
6 listings
13% of total
Key Insights
- The most prevalent minimum stay requirement in Laborie is 3 Nights, adopted by 30.4% of listings. This highlights the market's preference for longer commitments.
- A significant segment (13%) caters to monthly stays (30+ nights) in Laborie, pointing to opportunities in the extended-stay market.
Recommendations
- Align with the market by considering a 3 Nights minimum stay, as 30.4% of Laborie hosts use this setting.
- If feasible, allowing 1-night stays, especially midweek or during low season, could capture last-minute bookings, as only 21.7% currently do.
- Explore offering discounts for stays of 30+ nights to attract the 13% of the market seeking extended stays.
- Adjust minimum nights based on seasonality – potentially shorter during low season and longer during peak demand periods in Laborie.
Laborie Airbnb Cancellation Policy Trends Analysis (2025)
Flexible
13 listings
28.9% of total
Moderate
7 listings
15.6% of total
Firm
13 listings
28.9% of total
Strict
12 listings
26.7% of total
Cancellation Policy Insights for Laborie
- The prevailing Airbnb cancellation policy trend in Laborie is Flexible, used by 28.9% of listings.
- A majority (55.6%) of hosts in Laborie utilize Firm or Strict policies, indicating a market where hosts prioritize booking security.
Recommendations for Hosts
- Consider adopting a Flexible policy to align with the 28.9% market standard in Laborie.
- Regularly review your cancellation policy against competitors and market demand shifts in Laborie.
Laborie STR Booking Lead Time Analysis (2025)
Average Booking Lead Time by Month
Booking Lead Time Insights for Laborie
- The overall average booking lead time for vacation rentals in Laborie is 72 days.
- Guests book furthest in advance for stays during January (average 109 days), likely coinciding with peak travel demand or local events.
- The shortest booking windows occur for stays in September (average 34 days), indicating more last-minute travel plans during this time.
- Seasonally, Winter (100 days avg.) sees the longest lead times, while Summer (55 days avg.) has the shortest, reflecting typical travel planning cycles.
Recommendations for Hosts
- Use the overall average lead time (72 days) as a baseline for your pricing and availability strategy in Laborie.
- For January stays, consider implementing length-of-stay discounts or slightly higher rates for bookings made less than 109 days out to capitalize on advance planning.
- Target marketing efforts for the Winter season well in advance (at least 100 days) to capture early planners.
- Monitor your own booking lead times against these Laborie averages to identify opportunities for dynamic pricing adjustments.
Popular & Essential Airbnb Amenities in Laborie (2025)
Amenity Prevalence
Amenity Insights for Laborie
- Essential amenities in Laborie that guests expect include: Wifi, Kitchen, Hangers. Lacking these (any) could significantly impact bookings.
- Popular amenities like Refrigerator, Iron, Essentials are common but not universal. Offering these can provide a competitive edge.
Recommendations for Hosts
- Ensure your listing includes all essential amenities for Laborie: Wifi, Kitchen, Hangers.
- Prioritize adding missing essentials: Kitchen, Hangers.
- Consider adding popular differentiators like Refrigerator or Iron to increase appeal.
- Highlight unique or less common amenities you offer (e.g., hot tub, dedicated workspace, EV charger) in your listing description and photos.
- Regularly check competitor amenities in Laborie to stay competitive.
Laborie Airbnb Guest Demographics & Profile Analysis (2025)
Guest Profile Summary for Laborie
- The typical guest profile for Airbnb in Laborie consists of predominantly international visitors (100%), with top international origins including United Kingdom, typically belonging to the Post-2000s (Gen Z/Alpha) group (50%), primarily speaking English or French.
- Domestic travelers account for 0.0% of guests.
- Key international markets include United States (42.3%) and United Kingdom (26.3%).
- Top languages spoken are English (58.5%) followed by French (13.5%).
- A significant demographic segment is the Post-2000s (Gen Z/Alpha) group, representing 50% of guests.
Recommendations for Hosts
- Focus marketing internationally, particularly towards travelers from United Kingdom.
- Tailor amenities and listing descriptions to appeal to the dominant Post-2000s (Gen Z/Alpha) demographic (e.g., highlight fast WiFi, smart home features, local guides).
- Highlight unique local experiences or amenities relevant to the primary guest profile.
- Consider seasonal promotions aligned with peak travel times for key origin markets.
Nearby Short-Term Rental Market Comparison
How does the Laborie Airbnb market stack up against its neighbors? Compare key performance metrics like average monthly revenue, ADR, and occupancy rates in surrounding areas to understand the broader regional STR landscape.
| Market | Active Properties | Monthly Revenue | Daily Rate | Avg. Occupancy |
|---|---|---|---|---|
| Clinketts | 13 | $4,664 | $417.58 | 47% |
| Prospect | 34 | $4,362 | $423.54 | 45% |
| Westerhall Point | 10 | $4,214 | $524.08 | 39% |
| Belair | 24 | $4,099 | $376.70 | 39% |
| Rock Dundo | 19 | $3,815 | $394.39 | 47% |
| Mount Standfast | 354 | $3,768 | $541.78 | 41% |
| Soufrière | 88 | $3,758 | $278.09 | 51% |
| Gibbes | 18 | $3,692 | $494.14 | 44% |
| Mullins | 46 | $3,574 | $663.23 | 44% |
| Coolie Town | 86 | $3,566 | $410.41 | 43% |