Xiulin Airbnb Market Analysis 2026: Short Term Rental Data & Vacation Rental Statistics in Hualien County, Taiwan
Is Airbnb profitable in Xiulin in 2026? Explore comprehensive Airbnb analytics for Xiulin, Hualien County, Taiwan to uncover income potential. This 2026 STR market report for Xiulin, based on AirROI data from February 2025 to January 2026, reveals key trends in the niche market of 27 active listings.
Whether you're considering an Airbnb investment in Xiulin, optimizing your existing vacation rental, or exploring rental arbitrage opportunities, understanding the Xiulin Airbnb data is crucial. Leveraging the low regulation environment is key to maximizing your short term rental income potential. Let's dive into the specifics.
Key Xiulin Airbnb Performance Metrics Overview
Monthly Airbnb Revenue Variations & Income Potential in Xiulin (2026)
Understanding the monthly revenue variations for Airbnb listings in Xiulin is key to maximizing your short term rental income potential. Seasonality significantly impacts earnings. Our analysis, based on data from the past 12 months, shows that the peak revenue month for STRs in Xiulin is typically December, while November often presents the lowest earnings, highlighting opportunities for strategic pricing adjustments during shoulder and low seasons. Explore the typical Airbnb income in Xiulin across different performance tiers:
- Best-in-class properties (Top 10%) achieve $871+ monthly, often utilizing dynamic pricing and superior guest experiences.
- Strong performing properties (Top 25%) earn $424 or more, indicating effective management and desirable locations/amenities.
- Typical properties (Median) generate around $271 per month, representing the average market performance.
- Entry-level properties (Bottom 25%) see earnings around $152, often with potential for optimization.
Average Monthly Airbnb Earnings Trend in Xiulin
Xiulin Airbnb Occupancy Rate Trends (2026)
Maximize your bookings by understanding the Xiulin STR occupancy trends. Seasonal demand shifts significantly influence how often properties are booked. Typically, Aprilsees the highest demand (peak season occupancy), while February experiences the lowest (low season). Effective strategies, like adjusting minimum stays or offering promotions, can boost occupancy during slower periods. Here's how different property tiers perform in Xiulin:
- Best-in-class properties (Top 10%) achieve 32%+ occupancy, indicating high desirability and potentially optimized availability.
- Strong performing properties (Top 25%) maintain 18% or higher occupancy, suggesting good market fit and guest satisfaction.
- Typical properties (Median) have an occupancy rate around 13%.
- Entry-level properties (Bottom 25%) average 7% occupancy, potentially facing higher vacancy.
Average Monthly Occupancy Rate Trend in Xiulin
Average Daily Rate (ADR) Airbnb Trends in Xiulin (2026)
Effective short term rental pricing strategy in Xiulin involves understanding monthly ADR fluctuations. The Average Daily Rate (ADR) for Airbnb in Xiulin typically peaks in July and dips lowest during January. Leveraging Airbnb dynamic pricing tools or strategies based on this seasonality can significantly boost revenue. Here's a look at the typical nightly rates achieved:
- Best-in-class properties (Top 10%) command rates of $131+ per night, often due to premium features or locations.
- Strong performing properties (Top 25%) achieve nightly rates of $106 or more.
- Typical properties (Median) charge around $73 per night.
- Entry-level properties (Bottom 25%) earn around $56 per night.
Average Daily Rate (ADR) Trend by Month in Xiulin
Get Live Xiulin Market Intelligence 👇

Explore Real-time Analytics
Airbnb Seasonality Analysis & Trends in Xiulin (2026)
Peak Season (December, October, June)
- Revenue averages $474 per month
- Occupancy rates average 16.9%
- Daily rates average $91
Shoulder Season
- Revenue averages $404 per month
- Occupancy maintains around 16.9%
- Daily rates hold near $92
Low Season (February, March, November)
- Revenue drops to average $299 per month
- Occupancy decreases to average 12.5%
- Daily rates adjust to average $90
Seasonality Insights for Xiulin
- The Airbnb seasonality in Xiulin shows moderate seasonality with distinct peak and low periods. While the sections above show seasonal averages, it's also insightful to look at the extremes:
- During the high season, the absolute peak month showcases Xiulin's highest earning potential, with monthly revenues capable of climbing to $497, occupancy reaching a high of 21.5%, and ADRs peaking at $97.
- Conversely, the slowest single month of the year, typically falling within the low season, marks the market's lowest point. In this month, revenue might dip to $257, occupancy could drop to 11.1%, and ADRs may adjust down to $88.
- Understanding both the seasonal averages and these monthly peaks and troughs in revenue, occupancy, and ADR is crucial for maximizing your Airbnb profit potential in Xiulin.
Seasonal Strategies for Maximizing Profit
- Peak Season: Maximize revenue through premium pricing and potentially longer minimum stays. Ensure high availability.
- Low Season: Offer competitive pricing, special promotions (e.g., extended stay discounts), and flexible cancellation policies. Target off-season travelers like remote workers or budget-conscious guests.
- Shoulder Seasons: Implement dynamic pricing that balances peak and low rates. Target weekend travelers or specific events. Offer slightly more flexible terms than peak season.
- Regularly analyze your own performance against these Xiulin seasonality benchmarks and adjust your pricing and availability strategy accordingly.
Best Areas for Airbnb Investment in Xiulin (2026)
Exploring the top neighborhoods for short-term rentals in Xiulin? This section highlights key areas, outlining why they are attractive for hosts and guests, along with notable local attractions. Consider these locations based on your target guest profile and investment strategy.
| Neighborhood / Area | Why Host Here? (Target Guests & Appeal) | Key Attractions & Landmarks |
|---|---|---|
| Taroko Gorge | One of Taiwan's most famous natural attractions, known for its stunning marble cliffs and hiking trails. A great location for nature lovers and adventure seekers looking to explore the area. | Taroko National Park, Shakadang Trail, Eternal Spring Shrine, Liwu River, Taroko Gorge, Swallow Grotto |
| Qingshui Cliffs | Breathtaking cliffs that drop dramatically into the Pacific Ocean, offering stunning ocean views. Ideal for those looking to escape the city and enjoy picturesque coastal scenery. | Qingshui Cliffs, Coastal hiking trails, Scenic viewpoints, Beach access, Photography spots, Nature observation |
| Hualien City Center | The bustling heart of Hualien with restaurants, shops, and local markets. Appeals to travelers looking for convenience and local culture. | Hualien Night Market, Dongdamen Night Market, National Dong Hwa University, Pine Garden, Cultural and creative industries park, Qixing Lake |
| Farglory Ocean Park | An amusement park and ocean park that offers fun for families and children. A great spot for family-friendly lodging. | Amusement rides, Aquarium exhibits, Shows and live performances, Beach access, Water activities, Restaurants |
| Liyu Lake | A serene lake surrounded by beautiful mountains, perfect for outdoor activities like boating and cycling. Attracts visitors looking for relaxation and nature. | Liyu Lake, Boating, Cycling trails, Nature hikes, Scenic picnic spots, Bird watching |
| Shitiping | Known for its unique coastal rock formations and clear waters, making it a popular site for snorkeling and exploring marine life. | Shitiping scenic area, Snorkeling, Walking trails, Coral reefs, Beach access, Marine wildlife observation |
| Cingjing Farm | Popular for its beautiful farm landscapes and sheep grazing, perfect for travelers seeking a rural experience and interaction with nature and animals. | Cingjing Farm, Green Green Grasslands, Sheep shearing shows, Scenic views, Hiking trails, Local produce |
| Nanbin Park | A scenic coastal park in Hualien that offers leisurely walks, bike paths, and beach access. Ideal for outdoor enthusiasts and relaxation. | Nanbin Park beach, Bike paths, Walking trails, Picnic areas, Seaside views, Water sports |
Understanding Airbnb License Requirements & STR Laws in Xiulin (2026)
While Xiulin, Hualien County, Taiwan currently shows low STR regulations, specific Airbnb license requirements might still exist or change. Always verify the latest short term rental regulations and Airbnb license requirements directly with local government authorities for Xiulin to ensure full compliance before hosting.
(Source: AirROI data, 2026, finding no licensed listings among those analyzed)
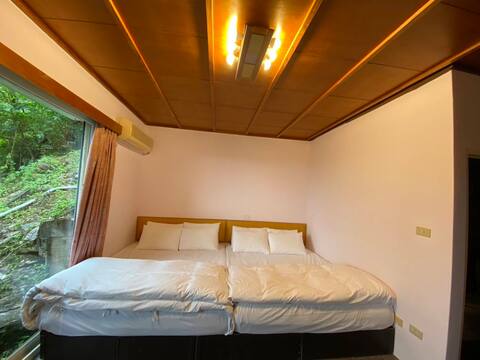
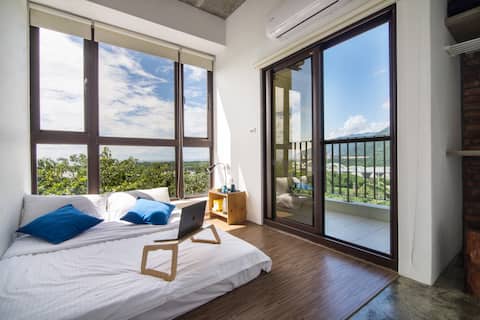
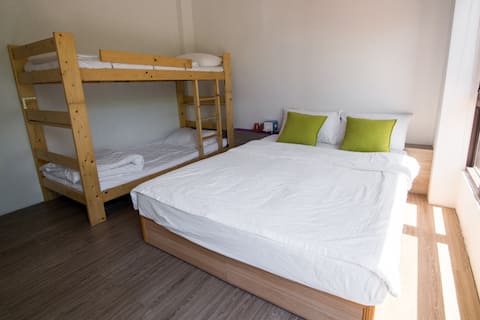
Top Performing Airbnb Properties in Xiulin (2026)
Benchmark your potential! Explore examples of top-performing Airbnb properties in Xiulinbased on Trailing Twelve Month (TTM) revenue. Analyze their characteristics, revenue, occupancy rate, and ADR to understand what drives success in this market.

Hualien Taroko YU's B&B 和室雙人房Cabin
Private Room • 1 bedroom

Mountain Silhouette Cottage 1 by Tiny Away (山影小屋1)
Entire Place • 1 bedroom
Entire house 12-16 people (please ask before booking)
Private Room • 5 bedrooms
【Be my guest】SAPAHSuliGuesthouse。Silung wz seaview
Private Room • 1 bedroom
【Be my guest】SAPAH Suli Guesthouse。Elug For 4pp
Private Room • N/A

Hualien Taroko YU's B&B Hexagon Quadruple Room Cabin
Private Room • N/A
Note: Performance varies based on location, size, amenities, seasonality, and management quality. Data reflects the past 12 months.
Top Performing Airbnb Hosts in Xiulin (2026)
Learn from the best! This table showcases top-performing Airbnb hosts in Xiulin based on the number of properties managed and estimated total revenue over the past year. Analyze their scale and performance metrics.
| Host Name | Properties | Grossing Revenue | Stay Reviews | Avg Rating |
|---|---|---|---|---|
| 秀蘭 | 3 | $15,052 | 510 | 4.93/5.0 |
| SAPAH Suli | 3 | $10,781 | 294 | 4.71/5.0 |
| Tiny Away | 1 | $7,000 | 16 | 4.81/5.0 |
| Veronica | 5 | $6,998 | 20 | 4.67/5.0 |
| 崇德太平洋沙灘~挪亞方舟 | 4 | $6,266 | 436 | 4.84/5.0 |
| Tiny Away Taiwan | 1 | $2,967 | 4 | 5.00/5.0 |
| 鳳書 | 1 | $2,408 | 20 | 4.95/5.0 |
| Mika | 1 | $1,722 | 14 | 5.00/5.0 |
| 貞粉 | 3 | $1,496 | 118 | 4.70/5.0 |
| 紅 | 2 | $1,041 | 11 | 4.94/5.0 |
Analyzing the strategies of top hosts, such as their property selection, pricing, and guest communication, can offer valuable lessons for optimizing your own Airbnb operations in Xiulin.
Dive Deeper: Advanced Xiulin STR Market Data (2026)
Ready to unlock more insights? AirROI provides access to advanced metrics and comprehensive Airbnb data for Xiulin. Explore detailed analytics beyond this report to refine your investment strategy, optimize pricing, and maximize your vacation rental profits.
Explore Advanced MetricsXiulin Short-Term Rental Market Composition (2026): Property & Room Types
Room Type Distribution
Property Type Distribution
Market Composition Insights for Xiulin
- The Xiulin Airbnb market composition is heavily skewed towards Private Room listings, which make up 85.2% of the 27 active rentals. This indicates strong guest preference for privacy and space.
- Looking at the property type distribution in Xiulin, House properties are the most common (37%), reflecting the local real estate landscape.
- Houses represent a significant 37% portion, catering likely to families or larger groups.
- The presence of 29.6% Hotel/Boutique listings indicates integration with traditional hospitality.
- Smaller segments like apartment/condo (combined 3.7%) offer potential for unique stay experiences.
Xiulin Airbnb Room Capacity Analysis (2026): Bedroom Distribution
Distribution of Listings by Number of Bedrooms
Room Capacity Insights for Xiulin
- The dominant room capacity in Xiulin is 1 bedroom listings, making up 37% of the market. This suggests a strong demand for properties suitable for couples or solo travelers.
- Together, 1 bedroom and 3 bedrooms properties represent 44.4% of the active Airbnb listings in Xiulin, indicating a high concentration in these sizes.
Xiulin Vacation Rental Guest Capacity Trends (2026)
Distribution of Listings by Guest Capacity
Guest Capacity Insights for Xiulin
- The most common guest capacity trend in Xiulin vacation rentals is listings accommodating 2 guests (18.5%). This suggests the primary traveler segment is likely couples or solo travelers.
- Properties designed for 2 guests and 4 guests dominate the Xiulin STR market, accounting for 33.3% of listings.
- On average, properties in Xiulin are equipped to host 1.6 guests.
Xiulin Airbnb Booking Patterns (2026): Available vs. Booked Days
Available Days Distribution
Booked Days Distribution
Booking Pattern Insights for Xiulin
- The most common availability pattern in Xiulin falls within the 271-366 days range, representing 96.3% of listings. This suggests many properties have significant open periods on their calendars.
- Approximately 100.0% of listings show high availability (181+ days open annually), indicating potential for increased bookings or specific owner usage patterns.
- For booked days, the 1-30 days range is most frequent in Xiulin (70.4%), reflecting common guest stay durations or potential owner blocking patterns.
Xiulin Airbnb Minimum Stay Requirements Analysis
Distribution of Listings by Minimum Night Requirement
1 Night
27 listings
100% of total
Key Insights
- The most prevalent minimum stay requirement in Xiulin is 1 Night, adopted by 100% of listings. This highlights the market's preference for shorter, flexible bookings.
- A strong majority (100.0%) of the Xiulin Airbnb data shows acceptance of very short stays (1-2 nights), indicating a dynamic, high-turnover market.
Recommendations
- Align with the market by considering a 1 Night minimum stay, as 100% of Xiulin hosts use this setting.
- Adjust minimum nights based on seasonality – potentially shorter during low season and longer during peak demand periods in Xiulin.
Xiulin Airbnb Cancellation Policy Trends Analysis (2026)
Limited
2 listings
7.4% of total
Flexible
3 listings
11.1% of total
Moderate
14 listings
51.9% of total
Firm
7 listings
25.9% of total
Strict
1 listings
3.7% of total
Cancellation Policy Insights for Xiulin
- The prevailing Airbnb cancellation policy trend in Xiulin is Moderate, used by 51.9% of listings.
- There's a relatively balanced mix between guest-friendly (63.0%) and stricter (29.6%) policies, offering choices for different guest needs.
- Strict cancellation policies are quite rare (3.7%), potentially making listings with this policy less competitive unless justified by high demand or property type.
Recommendations for Hosts
- Consider adopting a Moderate policy to align with the 51.9% market standard in Xiulin.
- Using a Strict policy might deter some guests, as only 3.7% of listings use it. Evaluate if potential revenue protection outweighs possible lower booking rates.
- Regularly review your cancellation policy against competitors and market demand shifts in Xiulin.
Xiulin STR Booking Lead Time Analysis (2026)
Average Booking Lead Time by Month
Booking Lead Time Insights for Xiulin
- The overall average booking lead time for vacation rentals in Xiulin is 51 days.
- Guests book furthest in advance for stays during October (average 117 days), likely coinciding with peak travel demand or local events.
- The shortest booking windows occur for stays in January (average 24 days), indicating more last-minute travel plans during this time.
- Seasonally, Fall (103 days avg.) sees the longest lead times, while Winter (54 days avg.) has the shortest, reflecting typical travel planning cycles.
Recommendations for Hosts
- Use the overall average lead time (51 days) as a baseline for your pricing and availability strategy in Xiulin.
- For October stays, consider implementing length-of-stay discounts or slightly higher rates for bookings made less than 117 days out to capitalize on advance planning.
- Target marketing efforts for the Fall season well in advance (at least 103 days) to capture early planners.
- Monitor your own booking lead times against these Xiulin averages to identify opportunities for dynamic pricing adjustments.
Popular & Essential Airbnb Amenities in Xiulin (2026)
Amenity Prevalence
Amenity Insights for Xiulin
- Essential amenities in Xiulin that guests expect include: Air conditioning. Lacking these (this) could significantly impact bookings.
- Popular amenities like Hair dryer, Wifi, Shampoo are common but not universal. Offering these can provide a competitive edge.
- Warning: Wifi is not universally provided but is considered essential globally. Ensure reliable Wifi is offered.
Recommendations for Hosts
- Ensure your listing includes all essential amenities for Xiulin: Air conditioning.
- Prioritize adding missing essentials: Air conditioning.
- Consider adding popular differentiators like Hair dryer or Wifi to increase appeal.
- Highlight unique or less common amenities you offer (e.g., hot tub, dedicated workspace, EV charger) in your listing description and photos.
- Regularly check competitor amenities in Xiulin to stay competitive.
Xiulin Airbnb Guest Demographics & Profile Analysis (2026)
Guest Profile Summary for Xiulin
- The typical guest profile for Airbnb in Xiulin consists of predominantly international visitors (86%), with top international origins including Taiwan, typically belonging to the Post-2000s (Gen Z/Alpha) group (50%), primarily speaking English or Chinese.
- Domestic travelers account for 14.3% of guests.
- Key international markets include United States (26.2%) and Taiwan (14.3%).
- Top languages spoken are English (43.4%) followed by Chinese (13.2%).
- A significant demographic segment is the Post-2000s (Gen Z/Alpha) group, representing 50% of guests.
Recommendations for Hosts
- Focus marketing internationally, particularly towards travelers from Taiwan.
- Tailor amenities and listing descriptions to appeal to the dominant Post-2000s (Gen Z/Alpha) demographic (e.g., highlight fast WiFi, smart home features, local guides).
- Highlight unique local experiences or amenities relevant to the primary guest profile.
- Consider seasonal promotions aligned with peak travel times for key origin markets.
Nearby Short-Term Rental Market Comparison
How does the Xiulin Airbnb market stack up against its neighbors? Compare key performance metrics like average monthly revenue, ADR, and occupancy rates in surrounding areas to understand the broader regional STR landscape.
| Market | Active Properties | Monthly Revenue | Daily Rate | Avg. Occupancy |
|---|---|---|---|---|
| 建泰里 | 10 | $4,049 | $265.74 | 70% |
| 建明里 | 12 | $3,291 | $202.85 | 68% |
| Zhuangwei | 19 | $2,573 | $278.09 | 30% |
| Alishan Township | 50 | $2,201 | $159.46 | 43% |
| 新起里 | 13 | $1,842 | $135.78 | 54% |
| Nanzhuang | 12 | $1,761 | $237.52 | 23% |
| Caotun Township | 10 | $1,601 | $197.95 | 28% |
| 黎明里 | 14 | $1,562 | $155.28 | 55% |
| Huwei Township | 15 | $1,541 | $136.23 | 29% |
| Yuanshan | 37 | $1,361 | $215.39 | 25% |