Taichung Airbnb Market Analysis 2026: Short Term Rental Data & Vacation Rental Statistics in Taichung, Taiwan
Is Airbnb profitable in Taichung in 2026? Explore comprehensive Airbnb analytics for Taichung, Taichung, Taiwan to uncover income potential. This 2026 STR market report for Taichung, based on AirROI data from June 2024 to May 2025, reveals key trends in the market of 959 active listings.
Whether you're considering an Airbnb investment in Taichung, optimizing your existing vacation rental, or exploring rental arbitrage opportunities, understanding the Taichung Airbnb data is crucial. Leveraging the low regulation environment is key to maximizing your short term rental income potential. Let's dive into the specifics.
Key Taichung Airbnb Performance Metrics Overview
Monthly Airbnb Revenue Variations & Income Potential in Taichung (2026)
Understanding the monthly revenue variations for Airbnb listings in Taichung is key to maximizing your short term rental income potential. Seasonality significantly impacts earnings. Our analysis, based on data from the past 12 months, shows that the peak revenue month for STRs in Taichung is typically January, while June often presents the lowest earnings, highlighting opportunities for strategic pricing adjustments during shoulder and low seasons. Explore the typical Airbnb income in Taichung across different performance tiers:
- Best-in-class properties (Top 10%) achieve $2,681+ monthly, often utilizing dynamic pricing and superior guest experiences.
- Strong performing properties (Top 25%) earn $1,365 or more, indicating effective management and desirable locations/amenities.
- Typical properties (Median) generate around $599 per month, representing the average market performance.
- Entry-level properties (Bottom 25%) see earnings around $241, often with potential for optimization.
Average Monthly Airbnb Earnings Trend in Taichung
Taichung Airbnb Occupancy Rate Trends (2026)
Maximize your bookings by understanding the Taichung STR occupancy trends. Seasonal demand shifts significantly influence how often properties are booked. Typically, Decembersees the highest demand (peak season occupancy), while September experiences the lowest (low season). Effective strategies, like adjusting minimum stays or offering promotions, can boost occupancy during slower periods. Here's how different property tiers perform in Taichung:
- Best-in-class properties (Top 10%) achieve 69%+ occupancy, indicating high desirability and potentially optimized availability.
- Strong performing properties (Top 25%) maintain 48% or higher occupancy, suggesting good market fit and guest satisfaction.
- Typical properties (Median) have an occupancy rate around 26%.
- Entry-level properties (Bottom 25%) average 12% occupancy, potentially facing higher vacancy.
Average Monthly Occupancy Rate Trend in Taichung
Average Daily Rate (ADR) Airbnb Trends in Taichung (2026)
Effective short term rental pricing strategy in Taichung involves understanding monthly ADR fluctuations. The Average Daily Rate (ADR) for Airbnb in Taichung typically peaks in January and dips lowest during June. Leveraging Airbnb dynamic pricing tools or strategies based on this seasonality can significantly boost revenue. Here's a look at the typical nightly rates achieved:
- Best-in-class properties (Top 10%) command rates of $282+ per night, often due to premium features or locations.
- Strong performing properties (Top 25%) achieve nightly rates of $117 or more.
- Typical properties (Median) charge around $59 per night.
- Entry-level properties (Bottom 25%) earn around $34 per night.
Average Daily Rate (ADR) Trend by Month in Taichung
Get Live Taichung Market Intelligence 👇

Explore Real-time Analytics
Airbnb Seasonality Analysis & Trends in Taichung (2025)
Peak Season (January, December, April)
- Revenue averages $1,435 per month
- Occupancy rates average 34.2%
- Daily rates average $129
Shoulder Season
- Revenue averages $1,176 per month
- Occupancy maintains around 32.8%
- Daily rates hold near $116
Low Season (June, September, October)
- Revenue drops to average $921 per month
- Occupancy decreases to average 28.7%
- Daily rates adjust to average $103
Seasonality Insights for Taichung
- The Airbnb seasonality in Taichung shows highly seasonal trends requiring careful strategy. While the sections above show seasonal averages, it's also insightful to look at the extremes:
- During the high season, the absolute peak month showcases Taichung's highest earning potential, with monthly revenues capable of climbing to $1,715, occupancy reaching a high of 35.3%, and ADRs peaking at $153.
- Conversely, the slowest single month of the year, typically falling within the low season, marks the market's lowest point. In this month, revenue might dip to $817, occupancy could drop to 28.1%, and ADRs may adjust down to $103.
- Understanding both the seasonal averages and these monthly peaks and troughs in revenue, occupancy, and ADR is crucial for maximizing your Airbnb profit potential in Taichung.
Seasonal Strategies for Maximizing Profit
- Peak Season: Maximize revenue through premium pricing and potentially longer minimum stays. Ensure high availability.
- Low Season: Offer competitive pricing, special promotions (e.g., extended stay discounts), and flexible cancellation policies. Target off-season travelers like remote workers or budget-conscious guests.
- Shoulder Seasons: Implement dynamic pricing that balances peak and low rates. Target weekend travelers or specific events. Offer slightly more flexible terms than peak season.
- Regularly analyze your own performance against these Taichung seasonality benchmarks and adjust your pricing and availability strategy accordingly.
Best Areas for Airbnb Investment in Taichung (2026)
Exploring the top neighborhoods for short-term rentals in Taichung? This section highlights key areas, outlining why they are attractive for hosts and guests, along with notable local attractions. Consider these locations based on your target guest profile and investment strategy.
| Neighborhood / Area | Why Host Here? (Target Guests & Appeal) | Key Attractions & Landmarks |
|---|---|---|
| Central District | The heart of Taichung, known for its cultural attractions, shopping, and dining. It is a popular spot for both domestic and international tourists. | National Museum of Natural Science, Taichung Park, Feng Chia Night Market, Calligraphy Greenway, Taichung Metropolitan Opera House |
| Feng Chia | Home to the famous Feng Chia Night Market, this area attracts a young crowd and food lovers. It's particularly popular among students and visitors. | Feng Chia Night Market, Feng Chia University, Shopping malls, Street food vendors |
| Nantun District | A lively district that combines modern living with traditional culture. It’s a great area for families and those interested in local experiences. | Taichung Folklore Park, National Taiwan Museum of Fine Arts, Local eateries, Cultural centers |
| Xitun District | This district is known for its vibrant nightlife, shopping, and entertainment options. Close to Feng Chia University, it attracts many young travelers. | Feng Chia Night Market, National Taichung Theater, Cultural and creative parks, Shopping centers |
| West District | A central area with many attractions, parks, and dining options. Great for tourists looking to explore Taichung on foot. | National Museum of Natural Science, Lin Family Garden, Shopping districts, Restaurants and cafes |
| Daya District | A quieter residential area with beautiful parks and local markets, suitable for travelers who prefer a more relaxed atmosphere. | Daya Park, Local markets, Cycling paths, Family-friendly venues |
| Beitun District | Known for its mountainous terrain and outdoor activities. A great location for nature lovers looking for tranquility and adventure. | Gongqing Park, Outdoor trails, Nature parks, Scenic views |
| Sha Lu District | A developing area with a mix of urban and rural settings. Offers potential for investment and caters to visitors exploring the outskirts of Taichung. | Cultural heritage sites, Nature exploration, Local farms, Rural experiences |
Understanding Airbnb License Requirements & STR Laws in Taichung (2026)
While Taichung, Taichung, Taiwan currently shows low STR regulations, specific Airbnb license requirements might still exist or change. Always verify the latest short term rental regulations and Airbnb license requirements directly with local government authorities for Taichung to ensure full compliance before hosting.
(Source: AirROI data, 2026, based on 3% licensed listings)
Top Performing Airbnb Properties in Taichung (2026)
Benchmark your potential! Explore examples of top-performing Airbnb properties in Taichungbased on Trailing Twelve Month (TTM) revenue. Analyze their characteristics, revenue, occupancy rate, and ADR to understand what drives success in this market.

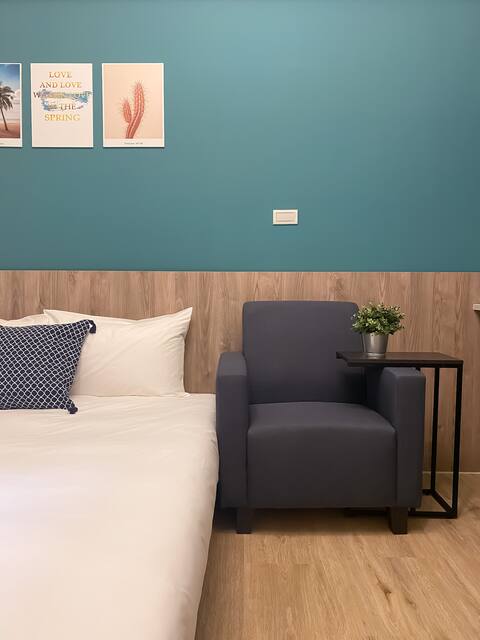
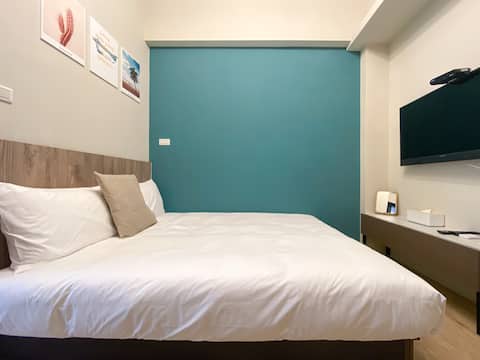
珊居秋鳴
Entire Place • 4 bedrooms
![[Booking first inquire about vacancies] 12 ~ 23 people/Near Kusakudo/Kusakudo/Audit New Village/Depa](https://a0.muscache.com/im/pictures/5ff54ce6-e27b-498a-9a82-c3ad7f8d77fc.jpg?im_w=480&im_format=avif)
[Booking first inquire about vacancies] 12 ~ 23 people/Near Kusakudo/Kusakudo/Audit New Village/Depa
Entire Place • 5 bedrooms
![[Private building 12 ~ 18 people] Near Science Museum/Business District/Kitchen/Living Room/Free Was](https://a0.muscache.com/im/pictures/miso/Hosting-776634961052035533/original/df919b89-054d-4472-b367-00a1c9ac0083.jpeg?im_w=480&im_format=avif)
[Private building 12 ~ 18 people] Near Science Museum/Business District/Kitchen/Living Room/Free Was
Entire Place • 4 bedrooms
2D3 "Come out and play!Help you choose this "floor-to-ceiling window · Washing machine · Double room
Private Room • N/A
golden years
Entire Place • 7 bedrooms
4D1 "Quality ~ One person comes out with peace of mind!Balcony. Exclusive washing machine. Double ro
Private Room • N/A
Note: Performance varies based on location, size, amenities, seasonality, and management quality. Data reflects the past 12 months.
Top Performing Airbnb Hosts in Taichung (2026)
Learn from the best! This table showcases top-performing Airbnb hosts in Taichung based on the number of properties managed and estimated total revenue over the past year. Analyze their scale and performance metrics.
| Host Name | Properties | Grossing Revenue | Stay Reviews | Avg Rating |
|---|---|---|---|---|
| Winnie | 37 | $1,357,081 | 79 | 4.72/5.0 |
| Adagio | 41 | $584,536 | 1854 | 4.67/5.0 |
| Sting And Tina | 15 | $394,382 | 615 | 4.79/5.0 |
| Jiun-Yun | 14 | $316,544 | 500 | 4.83/5.0 |
| Ben | 2 | $235,240 | 822 | 4.91/5.0 |
| Fonia | 33 | $178,970 | 1765 | 4.88/5.0 |
| Chen | 6 | $151,982 | 311 | 4.85/5.0 |
| Carey | 16 | $136,149 | 1434 | 4.87/5.0 |
| 元珊 | 1 | $130,442 | 36 | 5.00/5.0 |
| Jim | 10 | $129,768 | 313 | 4.75/5.0 |
Analyzing the strategies of top hosts, such as their property selection, pricing, and guest communication, can offer valuable lessons for optimizing your own Airbnb operations in Taichung.
Dive Deeper: Advanced Taichung STR Market Data (2026)
Ready to unlock more insights? AirROI provides access to advanced metrics and comprehensive Airbnb data for Taichung. Explore detailed analytics beyond this report to refine your investment strategy, optimize pricing, and maximize your vacation rental profits.
Explore Advanced MetricsTaichung Short-Term Rental Market Composition (2026): Property & Room Types
Room Type Distribution
Property Type Distribution
Market Composition Insights for Taichung
- The Taichung Airbnb market composition is heavily skewed towards Private Room listings, which make up 56.6% of the 959 active rentals. This indicates strong guest preference for privacy and space.
- Looking at the property type distribution in Taichung, Apartment/Condo properties are the most common (37.7%), reflecting the local real estate landscape.
- Houses represent a significant 36.3% portion, catering likely to families or larger groups.
- The presence of 16.4% Hotel/Boutique listings indicates integration with traditional hospitality.
- Smaller segments like outdoor/unique (combined 3.5%) offer potential for unique stay experiences.
Taichung Airbnb Room Capacity Analysis (2026): Bedroom Distribution
Distribution of Listings by Number of Bedrooms
Room Capacity Insights for Taichung
- The dominant room capacity in Taichung is 1 bedroom listings, making up 45.7% of the market. This suggests a strong demand for properties suitable for couples or solo travelers.
- Together, 1 bedroom and 2 bedrooms properties represent 56.0% of the active Airbnb listings in Taichung, indicating a high concentration in these sizes.
Taichung Vacation Rental Guest Capacity Trends (2026)
Distribution of Listings by Guest Capacity
Guest Capacity Insights for Taichung
- The most common guest capacity trend in Taichung vacation rentals is listings accommodating 2 guests (29.4%). This suggests the primary traveler segment is likely couples or solo travelers.
- Properties designed for 2 guests and 8+ guests dominate the Taichung STR market, accounting for 41.7% of listings.
- 21.9% of properties accommodate 6+ guests, serving the market segment for larger families or group travel in Taichung.
- On average, properties in Taichung are equipped to host 2.8 guests.
Taichung Airbnb Booking Patterns (2026): Available vs. Booked Days
Available Days Distribution
Booked Days Distribution
Booking Pattern Insights for Taichung
- The most common availability pattern in Taichung falls within the 271-366 days range, representing 62.6% of listings. This suggests many properties have significant open periods on their calendars.
- Approximately 89.1% of listings show high availability (181+ days open annually), indicating potential for increased bookings or specific owner usage patterns.
- For booked days, the 31-90 days range is most frequent in Taichung (32%), reflecting common guest stay durations or potential owner blocking patterns.
- A notable 11.5% of properties secure long booking periods (181+ days booked per year), highlighting successful long-term rental strategies or significant owner usage.
Taichung Airbnb Minimum Stay Requirements Analysis
Distribution of Listings by Minimum Night Requirement
1 Night
722 listings
77.4% of total
2 Nights
65 listings
7% of total
3 Nights
7 listings
0.8% of total
4-6 Nights
4 listings
0.4% of total
7-29 Nights
87 listings
9.3% of total
30+ Nights
48 listings
5.1% of total
Key Insights
- The most prevalent minimum stay requirement in Taichung is 1 Night, adopted by 77.4% of listings. This highlights the market's preference for shorter, flexible bookings.
- A strong majority (84.4%) of the Taichung Airbnb data shows acceptance of very short stays (1-2 nights), indicating a dynamic, high-turnover market.
Recommendations
- Align with the market by considering a 1 Night minimum stay, as 77.4% of Taichung hosts use this setting.
- Explore offering discounts for stays of 30+ nights to attract the 5.1% of the market seeking extended stays.
- Adjust minimum nights based on seasonality – potentially shorter during low season and longer during peak demand periods in Taichung.
Taichung Airbnb Cancellation Policy Trends Analysis (2026)
Flexible
280 listings
32.8% of total
Moderate
237 listings
27.8% of total
Firm
192 listings
22.5% of total
Strict
144 listings
16.9% of total
Cancellation Policy Insights for Taichung
- The prevailing Airbnb cancellation policy trend in Taichung is Flexible, used by 32.8% of listings.
- There's a relatively balanced mix between guest-friendly (60.6%) and stricter (39.4%) policies, offering choices for different guest needs.
Recommendations for Hosts
- Consider adopting a Flexible policy to align with the 32.8% market standard in Taichung.
- Regularly review your cancellation policy against competitors and market demand shifts in Taichung.
Taichung STR Booking Lead Time Analysis (2026)
Average Booking Lead Time by Month
Booking Lead Time Insights for Taichung
- The overall average booking lead time for vacation rentals in Taichung is 44 days.
- Guests book furthest in advance for stays during October (average 71 days), likely coinciding with peak travel demand or local events.
- The shortest booking windows occur for stays in July (average 22 days), indicating more last-minute travel plans during this time.
- Seasonally, Fall (59 days avg.) sees the longest lead times, while Spring (31 days avg.) has the shortest, reflecting typical travel planning cycles.
Recommendations for Hosts
- Use the overall average lead time (44 days) as a baseline for your pricing and availability strategy in Taichung.
- For October stays, consider implementing length-of-stay discounts or slightly higher rates for bookings made less than 71 days out to capitalize on advance planning.
- Target marketing efforts for the Fall season well in advance (at least 59 days) to capture early planners.
- Monitor your own booking lead times against these Taichung averages to identify opportunities for dynamic pricing adjustments.
Popular & Essential Airbnb Amenities in Taichung (2026)
Amenity Prevalence
Amenity Insights for Taichung
- Essential amenities in Taichung that guests expect include: Air conditioning, Wifi. Lacking these (any) could significantly impact bookings.
- Popular amenities like TV, Hair dryer, Essentials are common but not universal. Offering these can provide a competitive edge.
Recommendations for Hosts
- Ensure your listing includes all essential amenities for Taichung: Air conditioning, Wifi.
- Prioritize adding missing essentials: Air conditioning, Wifi.
- Consider adding popular differentiators like TV or Hair dryer to increase appeal.
- Highlight unique or less common amenities you offer (e.g., hot tub, dedicated workspace, EV charger) in your listing description and photos.
- Regularly check competitor amenities in Taichung to stay competitive.
Taichung Airbnb Guest Demographics & Profile Analysis (2026)
Guest Profile Summary for Taichung
- The typical guest profile for Airbnb in Taichung consists of a mix of domestic (51%) and international guests, often arriving from nearby Taipei, typically belonging to the Post-2000s (Gen Z/Alpha) group (50%), primarily speaking Chinese or English.
- Domestic travelers account for 50.7% of guests.
- Key international markets include Taiwan (50.7%) and Singapore (9.7%).
- Top languages spoken are Chinese (42%) followed by English (39.7%).
- A significant demographic segment is the Post-2000s (Gen Z/Alpha) group, representing 50% of guests.
Recommendations for Hosts
- Balance marketing efforts between domestic and international channels based on the guest mix.
- Tailor amenities and listing descriptions to appeal to the dominant Post-2000s (Gen Z/Alpha) demographic (e.g., highlight fast WiFi, smart home features, local guides).
- Highlight unique local experiences or amenities relevant to the primary guest profile.
- Consider seasonal promotions aligned with peak travel times for key origin markets.
Nearby Short-Term Rental Market Comparison
How does the Taichung Airbnb market stack up against its neighbors? Compare key performance metrics like average monthly revenue, ADR, and occupancy rates in surrounding areas to understand the broader regional STR landscape.
| Market | Active Properties | Monthly Revenue | Daily Rate | Avg. Occupancy |
|---|---|---|---|---|
| Nanzhuang | 13 | $2,087 | $270.51 | 26% |
| Alishan Township | 52 | $1,883 | $156.39 | 40% |
| Zhongpu Township | 11 | $1,711 | $386.79 | 27% |
| Zhuangwei | 30 | $1,663 | $251.13 | 22% |
| Zhuqi Township | 26 | $1,353 | $113.25 | 38% |
| Yuanshan | 46 | $1,349 | $218.74 | 25% |
| Taipei | 4,426 | $1,211 | $100.86 | 51% |
| Fanlu Township | 29 | $1,117 | $168.40 | 32% |
| Sanxing | 85 | $1,103 | $275.06 | 21% |
| Dongshan | 111 | $1,091 | $240.05 | 21% |