Sanxing Airbnb Market Analysis 2026: Short Term Rental Data & Vacation Rental Statistics in Yilan County, Taiwan
Is Airbnb profitable in Sanxing in 2026? Explore comprehensive Airbnb analytics for Sanxing, Yilan County, Taiwan to uncover income potential. This 2026 STR market report for Sanxing, based on AirROI data from February 2025 to January 2026, reveals key trends in the niche market of 53 active listings.
Whether you're considering an Airbnb investment in Sanxing, optimizing your existing vacation rental, or exploring rental arbitrage opportunities, understanding the Sanxing Airbnb data is crucial. Leveraging the low regulation environment is key to maximizing your short term rental income potential. Let's dive into the specifics.
Key Sanxing Airbnb Performance Metrics Overview
Monthly Airbnb Revenue Variations & Income Potential in Sanxing (2026)
Understanding the monthly revenue variations for Airbnb listings in Sanxing is key to maximizing your short term rental income potential. Seasonality significantly impacts earnings. Our analysis, based on data from the past 12 months, shows that the peak revenue month for STRs in Sanxing is typically August, while December often presents the lowest earnings, highlighting opportunities for strategic pricing adjustments during shoulder and low seasons. Explore the typical Airbnb income in Sanxing across different performance tiers:
- Best-in-class properties (Top 10%) achieve $4,387+ monthly, often utilizing dynamic pricing and superior guest experiences.
- Strong performing properties (Top 25%) earn $2,470 or more, indicating effective management and desirable locations/amenities.
- Typical properties (Median) generate around $1,004 per month, representing the average market performance.
- Entry-level properties (Bottom 25%) see earnings around $389, often with potential for optimization.
Average Monthly Airbnb Earnings Trend in Sanxing
Sanxing Airbnb Occupancy Rate Trends (2026)
Maximize your bookings by understanding the Sanxing STR occupancy trends. Seasonal demand shifts significantly influence how often properties are booked. Typically, Augustsees the highest demand (peak season occupancy), while February experiences the lowest (low season). Effective strategies, like adjusting minimum stays or offering promotions, can boost occupancy during slower periods. Here's how different property tiers perform in Sanxing:
- Best-in-class properties (Top 10%) achieve 54%+ occupancy, indicating high desirability and potentially optimized availability.
- Strong performing properties (Top 25%) maintain 30% or higher occupancy, suggesting good market fit and guest satisfaction.
- Typical properties (Median) have an occupancy rate around 19%.
- Entry-level properties (Bottom 25%) average 10% occupancy, potentially facing higher vacancy.
Average Monthly Occupancy Rate Trend in Sanxing
Average Daily Rate (ADR) Airbnb Trends in Sanxing (2026)
Effective short term rental pricing strategy in Sanxing involves understanding monthly ADR fluctuations. The Average Daily Rate (ADR) for Airbnb in Sanxing typically peaks in July and dips lowest during January. Leveraging Airbnb dynamic pricing tools or strategies based on this seasonality can significantly boost revenue. Here's a look at the typical nightly rates achieved:
- Best-in-class properties (Top 10%) command rates of $504+ per night, often due to premium features or locations.
- Strong performing properties (Top 25%) achieve nightly rates of $316 or more.
- Typical properties (Median) charge around $141 per night.
- Entry-level properties (Bottom 25%) earn around $90 per night.
Average Daily Rate (ADR) Trend by Month in Sanxing
Get Live Sanxing Market Intelligence 👇

Explore Real-time Analytics
Airbnb Seasonality Analysis & Trends in Sanxing (2026)
Peak Season (August, September, July)
- Revenue averages $2,118 per month
- Occupancy rates average 29.4%
- Daily rates average $233
Shoulder Season
- Revenue averages $1,706 per month
- Occupancy maintains around 23.1%
- Daily rates hold near $230
Low Season (January, November, December)
- Revenue drops to average $1,337 per month
- Occupancy decreases to average 19.6%
- Daily rates adjust to average $222
Seasonality Insights for Sanxing
- The Airbnb seasonality in Sanxing shows moderate seasonality with distinct peak and low periods. While the sections above show seasonal averages, it's also insightful to look at the extremes:
- During the high season, the absolute peak month showcases Sanxing's highest earning potential, with monthly revenues capable of climbing to $2,481, occupancy reaching a high of 34.7%, and ADRs peaking at $237.
- Conversely, the slowest single month of the year, typically falling within the low season, marks the market's lowest point. In this month, revenue might dip to $1,289, occupancy could drop to 18.3%, and ADRs may adjust down to $221.
- Understanding both the seasonal averages and these monthly peaks and troughs in revenue, occupancy, and ADR is crucial for maximizing your Airbnb profit potential in Sanxing.
Seasonal Strategies for Maximizing Profit
- Peak Season: Maximize revenue through premium pricing and potentially longer minimum stays. Ensure high availability.
- Low Season: Offer competitive pricing, special promotions (e.g., extended stay discounts), and flexible cancellation policies. Target off-season travelers like remote workers or budget-conscious guests.
- Shoulder Seasons: Implement dynamic pricing that balances peak and low rates. Target weekend travelers or specific events. Offer slightly more flexible terms than peak season.
- Regularly analyze your own performance against these Sanxing seasonality benchmarks and adjust your pricing and availability strategy accordingly.
Best Areas for Airbnb Investment in Sanxing (2026)
Exploring the top neighborhoods for short-term rentals in Sanxing? This section highlights key areas, outlining why they are attractive for hosts and guests, along with notable local attractions. Consider these locations based on your target guest profile and investment strategy.
| Neighborhood / Area | Why Host Here? (Target Guests & Appeal) | Key Attractions & Landmarks |
|---|---|---|
| Wulai | A picturesque mountain town known for its hot springs and beautiful natural scenery, attracting both domestic and international tourists seeking relaxation and natural beauty. | Wulai Hot Springs, Wulai Waterfall, Taipei-Xinbei River Bike Path, Formosan Aboriginal Culture Village, Wulai Old Street |
| Jiaoxi | Famous for its hot springs and wellness resorts, Jiaoxi is a popular destination for relaxation and health tourism, making it a prime location for Airbnb hosting. | Jiaoxi Hot Springs, Wufengchi Waterfall, Jiaoxi Tourism Night Market, Toucheng Cultural and Creative Park, Wushih Harbor |
| Dongshan River | Known for its scenic river views and outdoor activities, it attracts many visitors looking for nature experiences as well as local culture. | Dongshan River Water Park, Dongshan River Eco Farm, cycling along the river, Fisherman's Wharf, Taiwan Potato Culture Theme Park |
| Yilan City | The capital of Yilan County, offering a mix of urban life and local culture, ideal for tourists wanting to experience local food and festivals. | Yilan Night Market, National Center for Traditional Arts, Yilan Museum of Art, Chiaohsi Hot Springs, Yilan City God Temple |
| Luodong | A vibrant town with a famous night market, it's a great base for exploring Yilan's countryside and nearby attractions. | Luodong Night Market, National Center for Traditional Arts, Luodong Forestry Culture Park, Huilong Elementary School Art Village, Qingyun Temple |
| Nanao | A coastal town known for its surf spots and beautiful beaches, appealing to travelers looking for sun and sea activities. | Nanao Beach, Jiaoxi Surfing Zone, Shanwei Beach, Nanao Bridge, Nanao Lighthouse |
| Zhongshan | A scenic area with a combination of mountains and rivers, perfect for travelers interested in hiking and eco-tourism. | Sihchao Bridge, Sunset Viewing Platform, Zhongshan Fishing Port, Pineapple Cake Factory, Firefly Park |
| Toucheng Township | Close to both the beach and mountains, providing a range of activities from surfing to hiking, making it an attractive destination for diverse travelers. | Toucheng Beach, Fengjia Night Market, Green Island, Yuanwangkeng Scenic Area, Yangmingshan National Park |
Understanding Airbnb License Requirements & STR Laws in Sanxing (2026)
While Sanxing, Yilan County, Taiwan currently shows low STR regulations, specific Airbnb license requirements might still exist or change. Always verify the latest short term rental regulations and Airbnb license requirements directly with local government authorities for Sanxing to ensure full compliance before hosting.
(Source: AirROI data, 2026, based on 2% licensed listings)
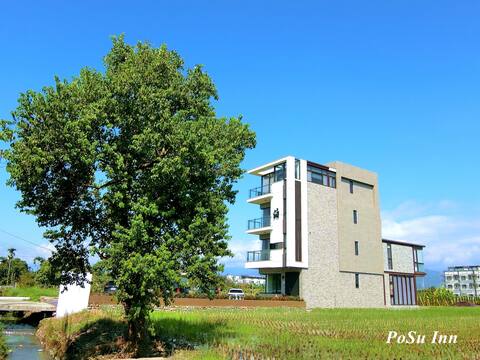
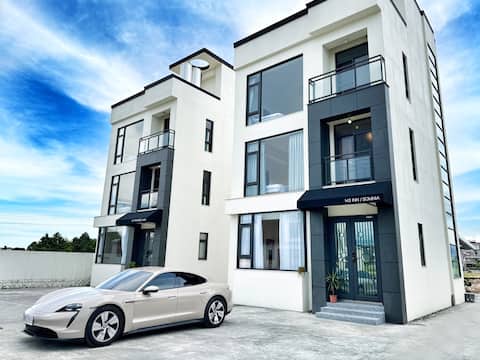
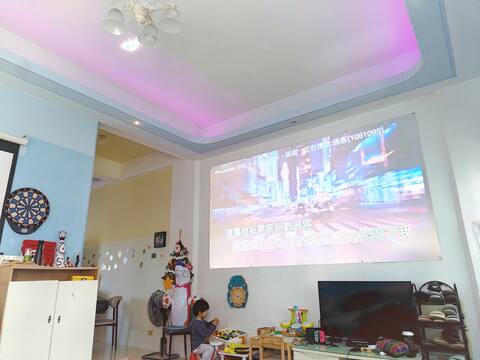
Top Performing Airbnb Properties in Sanxing (2026)
Benchmark your potential! Explore examples of top-performing Airbnb properties in Sanxingbased on Trailing Twelve Month (TTM) revenue. Analyze their characteristics, revenue, occupancy rate, and ADR to understand what drives success in this market.

Warm House 8-person private B&B 3 rooms (only one group of guests)
Entire Place • 3 bedrooms
♠泊宿Inn ♣漂泊之時 緣宿之鄉
Entire Place • 5 bedrooms
Pet-friendly British-style homestay with elevator in Yilan (electric mahjong, kitchen, barbecue area
Entire Place • 4 bedrooms

Book a room on weekdays and enjoy a super low price for a private house
Entire Place • 4 bedrooms
Blue and White Villa/January-March Booking Discount/133-inch Super Screen/KTV/Electric Mahjong Table
Entire Place • 5 bedrooms

2 rooms (only one group)
Entire Place • 2 bedrooms
Note: Performance varies based on location, size, amenities, seasonality, and management quality. Data reflects the past 12 months.
Top Performing Airbnb Hosts in Sanxing (2026)
Learn from the best! This table showcases top-performing Airbnb hosts in Sanxing based on the number of properties managed and estimated total revenue over the past year. Analyze their scale and performance metrics.
| Host Name | Properties | Grossing Revenue | Stay Reviews | Avg Rating |
|---|---|---|---|---|
| Eric | 6 | $162,429 | 105 | 4.99/5.0 |
| 柏辰 | 1 | $66,738 | 4 | 5.00/5.0 |
| 宸旭 Nina | 2 | $58,102 | 41 | 4.91/5.0 |
| 蕙蕙 | 1 | $46,509 | 1 | Not Rated |
| 富哥 | 1 | $43,326 | 35 | 5.00/5.0 |
| Mandy | 1 | $35,815 | 3 | 5.00/5.0 |
| 依暽 | 1 | $34,315 | 2 | Not Rated |
| Evan | 1 | $28,373 | 12 | 5.00/5.0 |
| Yu Shan | 1 | $23,626 | 10 | 5.00/5.0 |
| Host #130704850 | 1 | $21,929 | 0 | Not Rated |
Analyzing the strategies of top hosts, such as their property selection, pricing, and guest communication, can offer valuable lessons for optimizing your own Airbnb operations in Sanxing.
Dive Deeper: Advanced Sanxing STR Market Data (2026)
Ready to unlock more insights? AirROI provides access to advanced metrics and comprehensive Airbnb data for Sanxing. Explore detailed analytics beyond this report to refine your investment strategy, optimize pricing, and maximize your vacation rental profits.
Explore Advanced MetricsSanxing Short-Term Rental Market Composition (2026): Property & Room Types
Room Type Distribution
Property Type Distribution
Market Composition Insights for Sanxing
- The Sanxing Airbnb market composition is heavily skewed towards Entire Home/Apt listings, which make up 52.8% of the 53 active rentals. This indicates strong guest preference for privacy and space.
- However, a notable 45.3% share for Private Rooms suggests opportunities for budget-conscious travelers or hosts renting out spare rooms.
- Looking at the property type distribution in Sanxing, House properties are the most common (86.8%), reflecting the local real estate landscape.
- Houses represent a significant 86.8% portion, catering likely to families or larger groups.
- The presence of 13.2% Hotel/Boutique listings indicates integration with traditional hospitality.
Sanxing Airbnb Room Capacity Analysis (2026): Bedroom Distribution
Distribution of Listings by Number of Bedrooms
Room Capacity Insights for Sanxing
- The dominant room capacity in Sanxing is 4 bedrooms listings, making up 17% of the market. This suggests a strong demand for properties suitable for families or small groups.
- Together, 4 bedrooms and 3 bedrooms properties represent 34.0% of the active Airbnb listings in Sanxing, indicating a high concentration in these sizes.
- A significant 47.2% of listings offer 3+ bedrooms, catering to larger groups and families seeking more space in Sanxing.
Sanxing Vacation Rental Guest Capacity Trends (2026)
Distribution of Listings by Guest Capacity
Guest Capacity Insights for Sanxing
- The most common guest capacity trend in Sanxing vacation rentals is listings accommodating 8+ guests (41.5%). This suggests the primary traveler segment is likely larger groups.
- Properties designed for 8+ guests and 2 guests dominate the Sanxing STR market, accounting for 49.0% of listings.
- 45.3% of properties accommodate 6+ guests, serving the market segment for larger families or group travel in Sanxing.
- On average, properties in Sanxing are equipped to host 4.0 guests.
Sanxing Airbnb Booking Patterns (2026): Available vs. Booked Days
Available Days Distribution
Booked Days Distribution
Booking Pattern Insights for Sanxing
- The most common availability pattern in Sanxing falls within the 271-366 days range, representing 79.2% of listings. This suggests many properties have significant open periods on their calendars.
- Approximately 96.2% of listings show high availability (181+ days open annually), indicating potential for increased bookings or specific owner usage patterns.
- For booked days, the 31-90 days range is most frequent in Sanxing (45.3%), reflecting common guest stay durations or potential owner blocking patterns.
- A notable 3.8% of properties secure long booking periods (181+ days booked per year), highlighting successful long-term rental strategies or significant owner usage.
Sanxing Airbnb Minimum Stay Requirements Analysis
Distribution of Listings by Minimum Night Requirement
1 Night
53 listings
100% of total
Key Insights
- The most prevalent minimum stay requirement in Sanxing is 1 Night, adopted by 100% of listings. This highlights the market's preference for shorter, flexible bookings.
- A strong majority (100.0%) of the Sanxing Airbnb data shows acceptance of very short stays (1-2 nights), indicating a dynamic, high-turnover market.
Recommendations
- Align with the market by considering a 1 Night minimum stay, as 100% of Sanxing hosts use this setting.
- Adjust minimum nights based on seasonality – potentially shorter during low season and longer during peak demand periods in Sanxing.
Sanxing Airbnb Cancellation Policy Trends Analysis (2026)
Flexible
14 listings
26.4% of total
Moderate
9 listings
17% of total
Firm
27 listings
50.9% of total
Strict
3 listings
5.7% of total
Cancellation Policy Insights for Sanxing
- The prevailing Airbnb cancellation policy trend in Sanxing is Firm, used by 50.9% of listings.
- A majority (56.6%) of hosts in Sanxing utilize Firm or Strict policies, indicating a market where hosts prioritize booking security.
- Strict cancellation policies are quite rare (5.7%), potentially making listings with this policy less competitive unless justified by high demand or property type.
Recommendations for Hosts
- Consider adopting a Firm policy to align with the 50.9% market standard in Sanxing.
- Using a Strict policy might deter some guests, as only 5.7% of listings use it. Evaluate if potential revenue protection outweighs possible lower booking rates.
- Regularly review your cancellation policy against competitors and market demand shifts in Sanxing.
Sanxing STR Booking Lead Time Analysis (2026)
Average Booking Lead Time by Month
Booking Lead Time Insights for Sanxing
- The overall average booking lead time for vacation rentals in Sanxing is 52 days.
- Guests book furthest in advance for stays during November (average 75 days), likely coinciding with peak travel demand or local events.
- The shortest booking windows occur for stays in June (average 28 days), indicating more last-minute travel plans during this time.
- Seasonally, Fall (62 days avg.) sees the longest lead times, while Summer (36 days avg.) has the shortest, reflecting typical travel planning cycles.
Recommendations for Hosts
- Use the overall average lead time (52 days) as a baseline for your pricing and availability strategy in Sanxing.
- For November stays, consider implementing length-of-stay discounts or slightly higher rates for bookings made less than 75 days out to capitalize on advance planning.
- Target marketing efforts for the Fall season well in advance (at least 62 days) to capture early planners.
- Monitor your own booking lead times against these Sanxing averages to identify opportunities for dynamic pricing adjustments.
Popular & Essential Airbnb Amenities in Sanxing (2026)
Amenity Prevalence
Amenity Insights for Sanxing
- Essential amenities in Sanxing that guests expect include: Air conditioning, Fire extinguisher, TV. Lacking these (any) could significantly impact bookings.
- Popular amenities like Wifi, Shampoo, Essentials are common but not universal. Offering these can provide a competitive edge.
- Warning: Wifi is not universally provided but is considered essential globally. Ensure reliable Wifi is offered.
Recommendations for Hosts
- Ensure your listing includes all essential amenities for Sanxing: Air conditioning, Fire extinguisher, TV.
- Prioritize adding missing essentials: Fire extinguisher, TV.
- Consider adding popular differentiators like Wifi or Shampoo to increase appeal.
- Highlight unique or less common amenities you offer (e.g., hot tub, dedicated workspace, EV charger) in your listing description and photos.
- Regularly check competitor amenities in Sanxing to stay competitive.
Sanxing Airbnb Guest Demographics & Profile Analysis (2026)
Guest Profile Summary for Sanxing
- The typical guest profile for Airbnb in Sanxing consists of primarily domestic travelers (76%), often arriving from nearby Taipei, typically belonging to the Post-2000s (Gen Z/Alpha) group (50%), primarily speaking Chinese or English.
- Domestic travelers account for 75.5% of guests.
- Key international markets include Taiwan (75.5%) and Singapore (7.5%).
- Top languages spoken are Chinese (39.6%) followed by English (37.7%).
- A significant demographic segment is the Post-2000s (Gen Z/Alpha) group, representing 50% of guests.
Recommendations for Hosts
- Target domestic marketing efforts towards travelers from Taipei and New Taipei City.
- Tailor amenities and listing descriptions to appeal to the dominant Post-2000s (Gen Z/Alpha) demographic (e.g., highlight fast WiFi, smart home features, local guides).
- Highlight unique local experiences or amenities relevant to the primary guest profile.
- Consider seasonal promotions aligned with peak travel times for key origin markets.
Nearby Short-Term Rental Market Comparison
How does the Sanxing Airbnb market stack up against its neighbors? Compare key performance metrics like average monthly revenue, ADR, and occupancy rates in surrounding areas to understand the broader regional STR landscape.
| Market | Active Properties | Monthly Revenue | Daily Rate | Avg. Occupancy |
|---|---|---|---|---|
| 建泰里 | 10 | $4,049 | $265.74 | 70% |
| 建明里 | 12 | $3,291 | $202.85 | 68% |
| Zhuangwei | 19 | $2,573 | $278.09 | 30% |
| Alishan Township | 50 | $2,201 | $159.46 | 43% |
| 新起里 | 13 | $1,842 | $135.78 | 54% |
| Nanzhuang | 12 | $1,761 | $237.52 | 23% |
| Caotun Township | 10 | $1,601 | $197.95 | 28% |
| �黎明里 | 14 | $1,562 | $155.28 | 55% |
| Huwei Township | 15 | $1,541 | $136.23 | 29% |
| Yuanshan | 37 | $1,361 | $215.39 | 25% |