Arusha Airbnb Market Analysis 2025: Short Term Rental Data & Vacation Rental Statistics in Arusha Region, Tanzania
Is Airbnb profitable in Arusha in 2025? Explore comprehensive Airbnb analytics for Arusha, Arusha Region, Tanzania to uncover income potential. This 2025 STR market report for Arusha, based on AirROI data from June 2024 to May 2025, reveals key trends in the niche market of 52 active listings.
Whether you're considering an Airbnb investment in Arusha, optimizing your existing vacation rental, or exploring rental arbitrage opportunities, understanding the Arusha Airbnb data is crucial. Leveraging the low regulation environment is key to maximizing your short term rental income potential. Let's dive into the specifics.
Key Arusha Airbnb Performance Metrics Overview
Monthly Airbnb Revenue Variations & Income Potential in Arusha (2025)
Understanding the monthly revenue variations for Airbnb listings in Arusha is key to maximizing your short term rental income potential. Seasonality significantly impacts earnings. Our analysis, based on data from the past 12 months, shows that the peak revenue month for STRs in Arusha is typically December, while May often presents the lowest earnings, highlighting opportunities for strategic pricing adjustments during shoulder and low seasons. Explore the typical Airbnb income in Arusha across different performance tiers:
- Best-in-class properties (Top 10%) achieve $1,058+ monthly, often utilizing dynamic pricing and superior guest experiences.
- Strong performing properties (Top 25%) earn $561 or more, indicating effective management and desirable locations/amenities.
- Typical properties (Median) generate around $300 per month, representing the average market performance.
- Entry-level properties (Bottom 25%) see earnings around $104, often with potential for optimization.
Average Monthly Airbnb Earnings Trend in Arusha
Arusha Airbnb Occupancy Rate Trends (2025)
Maximize your bookings by understanding the Arusha STR occupancy trends. Seasonal demand shifts significantly influence how often properties are booked. Typically, Augustsees the highest demand (peak season occupancy), while May experiences the lowest (low season). Effective strategies, like adjusting minimum stays or offering promotions, can boost occupancy during slower periods. Here's how different property tiers perform in Arusha:
- Best-in-class properties (Top 10%) achieve 53%+ occupancy, indicating high desirability and potentially optimized availability.
- Strong performing properties (Top 25%) maintain 34% or higher occupancy, suggesting good market fit and guest satisfaction.
- Typical properties (Median) have an occupancy rate around 18%.
- Entry-level properties (Bottom 25%) average 9% occupancy, potentially facing higher vacancy.
Average Monthly Occupancy Rate Trend in Arusha
Average Daily Rate (ADR) Airbnb Trends in Arusha (2025)
Effective short term rental pricing strategy in Arusha involves understanding monthly ADR fluctuations. The Average Daily Rate (ADR) for Airbnb in Arusha typically peaks in May and dips lowest during January. Leveraging Airbnb dynamic pricing tools or strategies based on this seasonality can significantly boost revenue. Here's a look at the typical nightly rates achieved:
- Best-in-class properties (Top 10%) command rates of $112+ per night, often due to premium features or locations.
- Strong performing properties (Top 25%) achieve nightly rates of $60 or more.
- Typical properties (Median) charge around $31 per night.
- Entry-level properties (Bottom 25%) earn around $17 per night.
Average Daily Rate (ADR) Trend by Month in Arusha
Get Live Arusha Market Intelligence 👇

Explore Real-time Analytics
Airbnb Seasonality Analysis & Trends in Arusha (2025)
Peak Season (December, August, June)
- Revenue averages $534 per month
- Occupancy rates average 29.1%
- Daily rates average $55
Shoulder Season
- Revenue averages $448 per month
- Occupancy maintains around 24.9%
- Daily rates hold near $56
Low Season (May, July, November)
- Revenue drops to average $310 per month
- Occupancy decreases to average 17.5%
- Daily rates adjust to average $56
Seasonality Insights for Arusha
- The Airbnb seasonality in Arusha shows highly seasonal trends requiring careful strategy. While the sections above show seasonal averages, it's also insightful to look at the extremes:
- During the high season, the absolute peak month showcases Arusha's highest earning potential, with monthly revenues capable of climbing to $619, occupancy reaching a high of 36.0%, and ADRs peaking at $58.
- Conversely, the slowest single month of the year, typically falling within the low season, marks the market's lowest point. In this month, revenue might dip to $197, occupancy could drop to 10.2%, and ADRs may adjust down to $53.
- Understanding both the seasonal averages and these monthly peaks and troughs in revenue, occupancy, and ADR is crucial for maximizing your Airbnb profit potential in Arusha.
Seasonal Strategies for Maximizing Profit
- Peak Season: Maximize revenue through premium pricing and potentially longer minimum stays. Ensure high availability.
- Low Season: Offer competitive pricing, special promotions (e.g., extended stay discounts), and flexible cancellation policies. Target off-season travelers like remote workers or budget-conscious guests.
- Shoulder Seasons: Implement dynamic pricing that balances peak and low rates. Target weekend travelers or specific events. Offer slightly more flexible terms than peak season.
- Regularly analyze your own performance against these Arusha seasonality benchmarks and adjust your pricing and availability strategy accordingly.
Best Areas for Airbnb Investment in Arusha (2025)
Exploring the top neighborhoods for short-term rentals in Arusha? This section highlights key areas, outlining why they are attractive for hosts and guests, along with notable local attractions. Consider these locations based on your target guest profile and investment strategy.
| Neighborhood / Area | Why Host Here? (Target Guests & Appeal) | Key Attractions & Landmarks |
|---|---|---|
| Moshi Road | A popular area due to its proximity to Kili Trekking and local attractions. Great for tourists looking to access Mount Kilimanjaro. | Kilimanjaro National Park, Materuni Waterfalls, Kilimanjaro Coffee Estates |
| Unga Limited | A central residential area that is well-connected to amenities and attractions, ideal for families and long-stay visitors. | Cultural Heritage Centre, Arusha National Park, shops and local markets |
| Arusha City Centre | The bustling heart of Arusha with a mix of local culture and tourist amenities. Highly attractive for those wanting to explore the city. | Arusha Declaration Museum, The Clock Tower, Local bazaars |
| Njiro | A residential suburb popular among expats and tourists alike, known for its tranquility and good restaurants. | Njiro Complex, local shops, cafes and restaurants |
| Olasiti | A scenic suburb with beautiful views and modern facilities, appealing to those seeking a peaceful environment close to the city. | Olasiti Hills, local parks, traditional Maasai villages |
| Sakina | Close to Arusha National Park and popular with travelers seeking outdoor activities and experiences. | Arusha National Park, Maasai Market, Cultural tours |
| Kijenge | A vibrant neighborhood that is popular for its nightlife and dining options. Suitable for younger travelers and groups. | Kijenge Residents Club, local bars and restaurants, Nightlife experiences |
| Larmudiac | A cozy residential area, known for its hospitality and close-knit community, great for long-term stays. | local community events, traditional food markets, sightseeing tours |
Understanding Airbnb License Requirements & STR Laws in Arusha (2025)
While Arusha, Arusha Region, Tanzania currently shows low STR regulations, specific Airbnb license requirements might still exist or change. Always verify the latest short term rental regulations and Airbnb license requirements directly with local government authorities for Arusha to ensure full compliance before hosting.
(Source: AirROI data, 2025, based on 10% licensed listings)
Top Performing Airbnb Properties in Arusha (2025)
Benchmark your potential! Explore examples of top-performing Airbnb properties in Arushabased on Trailing Twelve Month (TTM) revenue. Analyze their characteristics, revenue, occupancy rate, and ADR to understand what drives success in this market.

Toiwo Residence Arusha
Entire Place • 4 bedrooms

comfortable and spacious house
Entire Place • 5 bedrooms
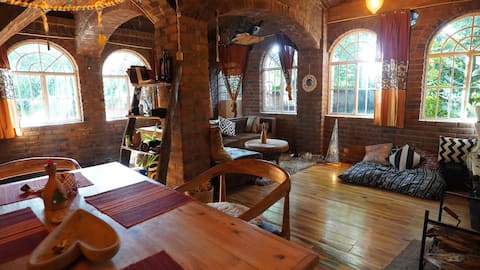
Cozy Brick House
Entire Place • 1 bedroom
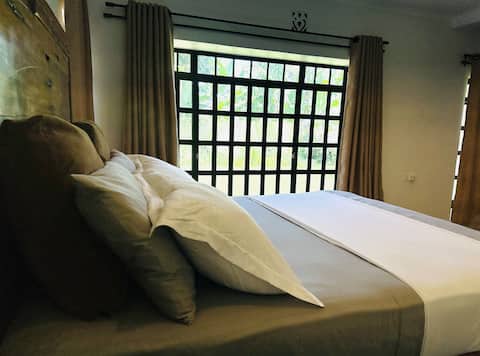
Arusha maasai home
Entire Place • 3 bedrooms

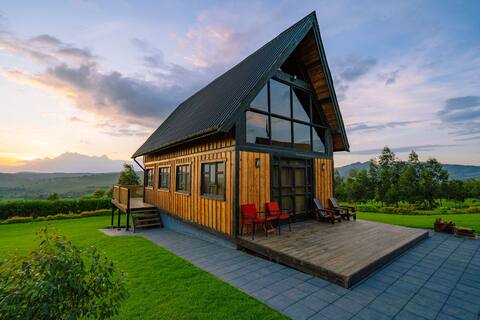
Giraffe Eco Cottage
Entire Place • 2 bedrooms
Cabin A! One of 4 beautiful cabins. Sleeps 4-6.
Entire Place • 1 bedroom
Note: Performance varies based on location, size, amenities, seasonality, and management quality. Data reflects the past 12 months.
Top Performing Airbnb Hosts in Arusha (2025)
Learn from the best! This table showcases top-performing Airbnb hosts in Arusha based on the number of properties managed and estimated total revenue over the past year. Analyze their scale and performance metrics.
| Host Name | Properties | Grossing Revenue | Stay Reviews | Avg Rating |
|---|---|---|---|---|
| Jessica | 1 | $12,374 | 16 | 5.00/5.0 |
| Nimo And G | 2 | $11,100 | 1 | Not Rated |
| Host #438708461 | 1 | $8,100 | 1 | Not Rated |
| Martin | 1 | $7,817 | 115 | 4.77/5.0 |
| Emil | 1 | $7,245 | 24 | 4.71/5.0 |
| Nathalie | 1 | $6,719 | 12 | 4.92/5.0 |
| Host #64452802 | 1 | $6,088 | 1 | Not Rated |
| Ally Ally | 4 | $4,943 | 126 | 4.93/5.0 |
| Host #329281177 | 1 | $4,839 | 0 | Not Rated |
| Key | 2 | $4,838 | 12 | 5.00/5.0 |
Analyzing the strategies of top hosts, such as their property selection, pricing, and guest communication, can offer valuable lessons for optimizing your own Airbnb operations in Arusha.
Dive Deeper: Advanced Arusha STR Market Data (2025)
Ready to unlock more insights? AirROI provides access to advanced metrics and comprehensive Airbnb data for Arusha. Explore detailed analytics beyond this report to refine your investment strategy, optimize pricing, and maximize your vacation rental profits.
Explore Advanced MetricsArusha Short-Term Rental Market Composition (2025): Property & Room Types
Room Type Distribution
Property Type Distribution
Market Composition Insights for Arusha
- The Arusha Airbnb market composition is heavily skewed towards Entire Home/Apt listings, which make up 61.5% of the 52 active rentals. This indicates strong guest preference for privacy and space.
- However, a notable 38.5% share for Private Rooms suggests opportunities for budget-conscious travelers or hosts renting out spare rooms.
- Looking at the property type distribution in Arusha, House properties are the most common (65.4%), reflecting the local real estate landscape.
- Houses represent a significant 65.4% portion, catering likely to families or larger groups.
- The presence of 11.5% Hotel/Boutique listings indicates integration with traditional hospitality.
Arusha Airbnb Room Capacity Analysis (2025): Bedroom Distribution
Distribution of Listings by Number of Bedrooms
Room Capacity Insights for Arusha
- The dominant room capacity in Arusha is 1 bedroom listings, making up 34.6% of the market. This suggests a strong demand for properties suitable for couples or solo travelers.
- Together, 1 bedroom and 2 bedrooms properties represent 57.7% of the active Airbnb listings in Arusha, indicating a high concentration in these sizes.
- A significant 30.8% of listings offer 3+ bedrooms, catering to larger groups and families seeking more space in Arusha.
Arusha Vacation Rental Guest Capacity Trends (2025)
Distribution of Listings by Guest Capacity
Guest Capacity Insights for Arusha
- The most common guest capacity trend in Arusha vacation rentals is listings accommodating 4 guests (26.9%). This suggests the primary traveler segment is likely small families or groups.
- Properties designed for 4 guests and 2 guests dominate the Arusha STR market, accounting for 50.0% of listings.
- 24.9% of properties accommodate 6+ guests, serving the market segment for larger families or group travel in Arusha.
- On average, properties in Arusha are equipped to host 3.8 guests.
Arusha Airbnb Booking Patterns (2025): Available vs. Booked Days
Available Days Distribution
Booked Days Distribution
Booking Pattern Insights for Arusha
- The most common availability pattern in Arusha falls within the 271-366 days range, representing 92.3% of listings. This suggests many properties have significant open periods on their calendars.
- Approximately 100.0% of listings show high availability (181+ days open annually), indicating potential for increased bookings or specific owner usage patterns.
- For booked days, the 1-30 days range is most frequent in Arusha (51.9%), reflecting common guest stay durations or potential owner blocking patterns.
Arusha Airbnb Minimum Stay Requirements Analysis
Distribution of Listings by Minimum Night Requirement
1 Night
45 listings
86.5% of total
2 Nights
3 listings
5.8% of total
3 Nights
2 listings
3.8% of total
30+ Nights
2 listings
3.8% of total
Key Insights
- The most prevalent minimum stay requirement in Arusha is 1 Night, adopted by 86.5% of listings. This highlights the market's preference for shorter, flexible bookings.
- A strong majority (92.3%) of the Arusha Airbnb data shows acceptance of very short stays (1-2 nights), indicating a dynamic, high-turnover market.
Recommendations
- Align with the market by considering a 1 Night minimum stay, as 86.5% of Arusha hosts use this setting.
- Adjust minimum nights based on seasonality – potentially shorter during low season and longer during peak demand periods in Arusha.
Arusha Airbnb Cancellation Policy Trends Analysis (2025)
Refundable
2 listings
5% of total
Non-refundable
1 listings
2.5% of total
Flexible
25 listings
62.5% of total
Moderate
7 listings
17.5% of total
Firm
1 listings
2.5% of total
Strict
4 listings
10% of total
Cancellation Policy Insights for Arusha
- The prevailing Airbnb cancellation policy trend in Arusha is Flexible, used by 62.5% of listings.
- The market strongly favors guest-friendly terms, with 80.0% of listings offering Flexible or Moderate policies. This suggests guests in Arusha may expect booking flexibility.
Recommendations for Hosts
- Consider adopting a Flexible policy to align with the 62.5% market standard in Arusha.
- Given the high prevalence of Flexible policies (62.5%), offering this can enhance booking appeal, especially during shoulder seasons.
- Using a Strict policy might deter some guests, as only 10% of listings use it. Evaluate if potential revenue protection outweighs possible lower booking rates.
- Regularly review your cancellation policy against competitors and market demand shifts in Arusha.
Arusha STR Booking Lead Time Analysis (2025)
Average Booking Lead Time by Month
Booking Lead Time Insights for Arusha
- The overall average booking lead time for vacation rentals in Arusha is 16 days.
- Guests book furthest in advance for stays during June (average 36 days), likely coinciding with peak travel demand or local events.
- The shortest booking windows occur for stays in November (average 11 days), indicating more last-minute travel plans during this time.
- Seasonally, Summer (34 days avg.) sees the longest lead times, while Winter (15 days avg.) has the shortest, reflecting typical travel planning cycles.
Recommendations for Hosts
- Use the overall average lead time (16 days) as a baseline for your pricing and availability strategy in Arusha.
- For June stays, consider implementing length-of-stay discounts or slightly higher rates for bookings made less than 36 days out to capitalize on advance planning.
- Target marketing efforts for the Summer season well in advance (at least 34 days) to capture early planners.
- Monitor your own booking lead times against these Arusha averages to identify opportunities for dynamic pricing adjustments.
Popular & Essential Airbnb Amenities in Arusha (2025)
Amenity Prevalence
Amenity Insights for Arusha
- Popular amenities like Kitchen, Wifi, Free parking on premises are common but not universal. Offering these can provide a competitive edge.
- Warning: Wifi is not universally provided but is considered essential globally. Ensure reliable Wifi is offered.
Recommendations for Hosts
- Consider adding popular differentiators like Kitchen or Wifi to increase appeal.
- Highlight unique or less common amenities you offer (e.g., hot tub, dedicated workspace, EV charger) in your listing description and photos.
- Regularly check competitor amenities in Arusha to stay competitive.
Arusha Airbnb Guest Demographics & Profile Analysis (2025)
Guest Profile Summary for Arusha
- The typical guest profile for Airbnb in Arusha consists of predominantly international visitors (91%), with top international origins including United States, typically belonging to the Post-2000s (Gen Z/Alpha) group (50%), primarily speaking English or Swahili.
- Domestic travelers account for 9.1% of guests.
- Key international markets include Germany (15.7%) and United States (14.9%).
- Top languages spoken are English (43.2%) followed by Swahili (12.3%).
- A significant demographic segment is the Post-2000s (Gen Z/Alpha) group, representing 50% of guests.
Recommendations for Hosts
- Focus marketing internationally, particularly towards travelers from United States.
- Tailor amenities and listing descriptions to appeal to the dominant Post-2000s (Gen Z/Alpha) demographic (e.g., highlight fast WiFi, smart home features, local guides).
- Highlight unique local experiences or amenities relevant to the primary guest profile.
- Consider seasonal promotions aligned with peak travel times for key origin markets.
Nearby Short-Term Rental Market Comparison
How does the Arusha Airbnb market stack up against its neighbors? Compare key performance metrics like average monthly revenue, ADR, and occupancy rates in surrounding areas to understand the broader regional STR landscape.
| Market | Active Properties | Monthly Revenue | Daily Rate | Avg. Occupancy |
|---|---|---|---|---|
| Usa River | 29 | $735 | $111.87 | 29% |
| Kilimanjaro | 10 | $643 | $81.90 | 33% |
| Kimana ward | 16 | $619 | $86.73 | 20% |
| Arusha | 232 | $302 | $65.43 | 28% |
| Shangarai | 14 | $249 | $47.15 | 32% |
| Moshi | 109 | $191 | $56.60 | 21% |