Malindi Airbnb Market Analysis 2026: Short Term Rental Data & Vacation Rental Statistics in Zanzibar Urban/West, Tanzania
Is Airbnb profitable in Malindi in 2026? Explore comprehensive Airbnb analytics for Malindi, Zanzibar Urban/West, Tanzania to uncover income potential. This 2026 STR market report for Malindi, based on AirROI data from February 2025 to January 2026, reveals key trends in the niche market of 23 active listings.
Whether you're considering an Airbnb investment in Malindi, optimizing your existing vacation rental, or exploring rental arbitrage opportunities, understanding the Malindi Airbnb data is crucial. Leveraging the low regulation environment is key to maximizing your short term rental income potential. Let's dive into the specifics.
Key Malindi Airbnb Performance Metrics Overview
Monthly Airbnb Revenue Variations & Income Potential in Malindi (2026)
Understanding the monthly revenue variations for Airbnb listings in Malindi is key to maximizing your short term rental income potential. Seasonality significantly impacts earnings. Our analysis, based on data from the past 12 months, shows that the peak revenue month for STRs in Malindi is typically September, while November often presents the lowest earnings, highlighting opportunities for strategic pricing adjustments during shoulder and low seasons. Explore the typical Airbnb income in Malindi across different performance tiers:
- Best-in-class properties (Top 10%) achieve $1,745+ monthly, often utilizing dynamic pricing and superior guest experiences.
- Strong performing properties (Top 25%) earn $618 or more, indicating effective management and desirable locations/amenities.
- Typical properties (Median) generate around $296 per month, representing the average market performance.
- Entry-level properties (Bottom 25%) see earnings around $114, often with potential for optimization.
Average Monthly Airbnb Earnings Trend in Malindi
Malindi Airbnb Occupancy Rate Trends (2026)
Maximize your bookings by understanding the Malindi STR occupancy trends. Seasonal demand shifts significantly influence how often properties are booked. Typically, Februarysees the highest demand (peak season occupancy), while November experiences the lowest (low season). Effective strategies, like adjusting minimum stays or offering promotions, can boost occupancy during slower periods. Here's how different property tiers perform in Malindi:
- Best-in-class properties (Top 10%) achieve 49%+ occupancy, indicating high desirability and potentially optimized availability.
- Strong performing properties (Top 25%) maintain 31% or higher occupancy, suggesting good market fit and guest satisfaction.
- Typical properties (Median) have an occupancy rate around 16%.
- Entry-level properties (Bottom 25%) average 8% occupancy, potentially facing higher vacancy.
Average Monthly Occupancy Rate Trend in Malindi
Average Daily Rate (ADR) Airbnb Trends in Malindi (2026)
Effective short term rental pricing strategy in Malindi involves understanding monthly ADR fluctuations. The Average Daily Rate (ADR) for Airbnb in Malindi typically peaks in July and dips lowest during January. Leveraging Airbnb dynamic pricing tools or strategies based on this seasonality can significantly boost revenue. Here's a look at the typical nightly rates achieved:
- Best-in-class properties (Top 10%) command rates of $90+ per night, often due to premium features or locations.
- Strong performing properties (Top 25%) achieve nightly rates of $67 or more.
- Typical properties (Median) charge around $49 per night.
- Entry-level properties (Bottom 25%) earn around $33 per night.
Average Daily Rate (ADR) Trend by Month in Malindi
Get Live Malindi Market Intelligence 👇

Explore Real-time Analytics
Airbnb Seasonality Analysis & Trends in Malindi (2026)
Peak Season (September, January, February)
- Revenue averages $903 per month
- Occupancy rates average 27.0%
- Daily rates average $56
Shoulder Season
- Revenue averages $570 per month
- Occupancy maintains around 23.9%
- Daily rates hold near $58
Low Season (June, November, December)
- Revenue drops to average $184 per month
- Occupancy decreases to average 13.7%
- Daily rates adjust to average $58
Seasonality Insights for Malindi
- The Airbnb seasonality in Malindi shows highly seasonal trends requiring careful strategy. While the sections above show seasonal averages, it's also insightful to look at the extremes:
- During the high season, the absolute peak month showcases Malindi's highest earning potential, with monthly revenues capable of climbing to $1,002, occupancy reaching a high of 34.0%, and ADRs peaking at $60.
- Conversely, the slowest single month of the year, typically falling within the low season, marks the market's lowest point. In this month, revenue might dip to $83, occupancy could drop to 5.8%, and ADRs may adjust down to $56.
- Understanding both the seasonal averages and these monthly peaks and troughs in revenue, occupancy, and ADR is crucial for maximizing your Airbnb profit potential in Malindi.
Seasonal Strategies for Maximizing Profit
- Peak Season: Maximize revenue through premium pricing and potentially longer minimum stays. Ensure high availability.
- Low Season: Offer competitive pricing, special promotions (e.g., extended stay discounts), and flexible cancellation policies. Target off-season travelers like remote workers or budget-conscious guests.
- Shoulder Seasons: Implement dynamic pricing that balances peak and low rates. Target weekend travelers or specific events. Offer slightly more flexible terms than peak season.
- Regularly analyze your own performance against these Malindi seasonality benchmarks and adjust your pricing and availability strategy accordingly.
Best Areas for Airbnb Investment in Malindi (2026)
Exploring the top neighborhoods for short-term rentals in Malindi? This section highlights key areas, outlining why they are attractive for hosts and guests, along with notable local attractions. Consider these locations based on your target guest profile and investment strategy.
| Neighborhood / Area | Why Host Here? (Target Guests & Appeal) | Key Attractions & Landmarks |
|---|---|---|
| Nungwi Beach | Famous for its stunning white sandy beaches and crystal clear waters, Nungwi is a popular destination for tourists looking to relax and enjoy water sports. | Nungwi Beach, Mnarani Natural Aquarium, Diving and snorkeling tours, Sunset cruises, Local markets |
| Stone Town | A UNESCO World Heritage Site, known for its rich history and vibrant culture. Stone Town offers a unique experience with its narrow streets, markets, and historic buildings. | Forodhani Gardens, House of Wonders, Old Fort, Spice Market, Slave Museum |
| Kendwa Beach | Known for its beautiful sunsets and vibrant nightlife, Kendwa Beach attracts both beachgoers and party enthusiasts, making it ideal for Airbnb hosting. | Kendwa Beach, Kendwa Rocks, Snorkeling trips, Beach parties, Sunset dhow cruises |
| Paje | A hotspot for kite surfing and beach lovers, Paje offers a relaxed atmosphere and is popular with a younger crowd seeking adventure and beach time. | Paje Beach, Kite surfing schools, Beach bars, Jozani Forest, Local seafood restaurants |
| Jambiani | A picturesque fishing village known for its tranquility and beautiful beaches, Jambiani attracts visitors looking for a peaceful getaway. | Jambiani Beach, Local fishers, Tidal pools, Relaxed beach cafes, Cultural tours |
| Kizimkazi | Famous for dolphin tours and rich cultural heritage, Kizimkazi offers a unique experience for tourists willing to explore rural Zanzibar. | Dolphin watching, Kizimkazi Mosque, Historical site tours, Local village visits, Beautiful beaches |
| Matemwe | Known for its serene environment and beautiful coral reefs, Matemwe is perfect for tourists seeking relaxation and a more secluded experience. | Matemwe Beach, Coral reefs for snorkeling, Quiet fishing village atmosphere, Palm-fringed beaches, Local seafood dining |
| Uroa Bay | A hidden gem with stunning beaches and tranquil waters, Uroa Bay is becoming a popular choice for those looking for a less commercialized experience. | Uroa Beach, Snorkeling opportunities, Beachfront resorts, Local cultural experiences, Calm waters for swimming |
Understanding Airbnb License Requirements & STR Laws in Malindi (2026)
While Malindi, Zanzibar Urban/West, Tanzania currently shows low STR regulations, specific Airbnb license requirements might still exist or change. Always verify the latest short term rental regulations and Airbnb license requirements directly with local government authorities for Malindi to ensure full compliance before hosting.
(Source: AirROI data, 2026, finding no licensed listings among those analyzed)
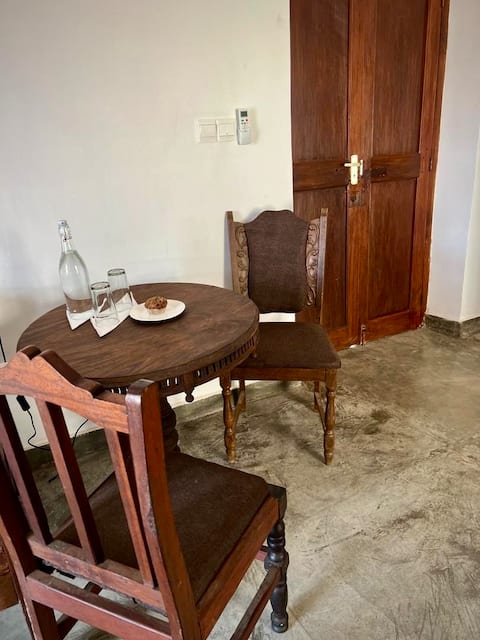
Top Performing Airbnb Properties in Malindi (2026)
Benchmark your potential! Explore examples of top-performing Airbnb properties in Malindibased on Trailing Twelve Month (TTM) revenue. Analyze their characteristics, revenue, occupancy rate, and ADR to understand what drives success in this market.
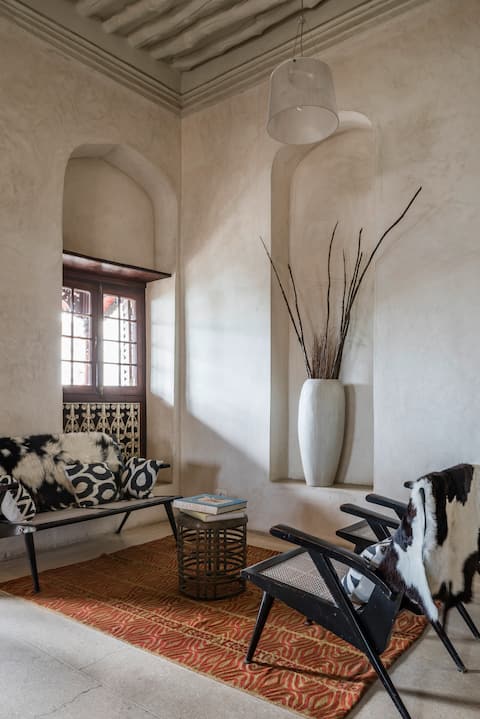
Villa Forodhani: Room in noble oceanfront palazzo
Private Room • 2 bedrooms
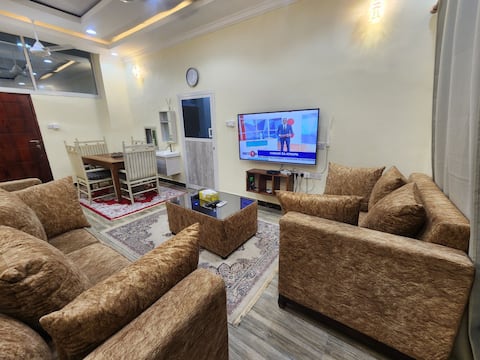
A home far away from home
Entire Place • 2 bedrooms
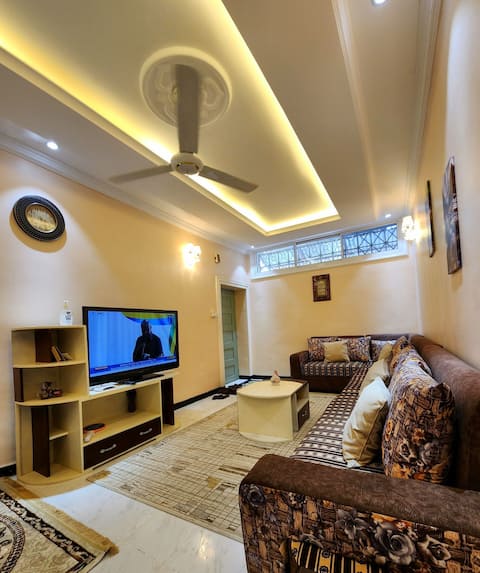
spacious, cosy second home
Entire Place • 2 bedrooms
Prestige Suite
Private Room • 4 bedrooms
"Dust" @ Barber - Zanzibar Cat Caravanserai
Private Room • N/A
“Mashungi” @ Manyoya - Zanzibar Cat Caravanserai
Private Room • N/A
Note: Performance varies based on location, size, amenities, seasonality, and management quality. Data reflects the past 12 months.
Top Performing Airbnb Hosts in Malindi (2026)
Learn from the best! This table showcases top-performing Airbnb hosts in Malindi based on the number of properties managed and estimated total revenue over the past year. Analyze their scale and performance metrics.
| Host Name | Properties | Grossing Revenue | Stay Reviews | Avg Rating |
|---|---|---|---|---|
| Raphael | 1 | $24,193 | 137 | 4.91/5.0 |
| Noreen | 4 | $12,057 | 19 | 5.00/5.0 |
| Hamid | 2 | $10,481 | 38 | 4.72/5.0 |
| Host #196647775 | 1 | $3,859 | 2 | Not Rated |
| The Train'S House Boutique Apa | 2 | $2,851 | 18 | 3.90/5.0 |
| Omary | 1 | $2,709 | 3 | 3.67/5.0 |
| Hamza | 1 | $1,830 | 24 | 4.38/5.0 |
| Nahir | 3 | $1,516 | 16 | 4.28/5.0 |
| Host #554775676 | 1 | $926 | 0 | Not Rated |
| Abdul | 3 | $890 | 306 | 4.73/5.0 |
Analyzing the strategies of top hosts, such as their property selection, pricing, and guest communication, can offer valuable lessons for optimizing your own Airbnb operations in Malindi.
Dive Deeper: Advanced Malindi STR Market Data (2026)
Ready to unlock more insights? AirROI provides access to advanced metrics and comprehensive Airbnb data for Malindi. Explore detailed analytics beyond this report to refine your investment strategy, optimize pricing, and maximize your vacation rental profits.
Explore Advanced MetricsMalindi Short-Term Rental Market Composition (2026): Property & Room Types
Room Type Distribution
Property Type Distribution
Market Composition Insights for Malindi
- The Malindi Airbnb market composition is heavily skewed towards Private Room listings, which make up 47.8% of the 23 active rentals. This indicates strong guest preference for privacy and space.
- Looking at the property type distribution in Malindi, Apartment/Condo properties are the most common (56.5%), reflecting the local real estate landscape.
- Houses represent a significant 39.1% portion, catering likely to families or larger groups.
- Smaller segments like hotel/boutique (combined 4.3%) offer potential for unique stay experiences.
Malindi Airbnb Room Capacity Analysis (2026): Bedroom Distribution
Distribution of Listings by Number of Bedrooms
Room Capacity Insights for Malindi
- The dominant room capacity in Malindi is 2 bedrooms listings, making up 26.1% of the market. This suggests a strong demand for properties suitable for couples or solo travelers.
- Together, 2 bedrooms and 1 bedroom properties represent 43.5% of the active Airbnb listings in Malindi, indicating a high concentration in these sizes.
Malindi Vacation Rental Guest Capacity Trends (2026)
Distribution of Listings by Guest Capacity
Guest Capacity Insights for Malindi
- The most common guest capacity trend in Malindi vacation rentals is listings accommodating 4 guests (26.1%). This suggests the primary traveler segment is likely small families or groups.
- Properties designed for 4 guests and 2 guests dominate the Malindi STR market, accounting for 47.8% of listings.
- Listings for large groups (6+ guests) are relatively rare (4.3%), potentially indicating an opportunity for hosts targeting this segment in Malindi.
- On average, properties in Malindi are equipped to host 1.7 guests.
Malindi Airbnb Booking Patterns (2026): Available vs. Booked Days
Available Days Distribution
Booked Days Distribution
Booking Pattern Insights for Malindi
- The most common availability pattern in Malindi falls within the 271-366 days range, representing 91.3% of listings. This suggests many properties have significant open periods on their calendars.
- Approximately 100.0% of listings show high availability (181+ days open annually), indicating potential for increased bookings or specific owner usage patterns.
- For booked days, the 1-30 days range is most frequent in Malindi (56.5%), reflecting common guest stay durations or potential owner blocking patterns.
Malindi Airbnb Minimum Stay Requirements Analysis
Distribution of Listings by Minimum Night Requirement
1 Night
16 listings
69.6% of total
2 Nights
6 listings
26.1% of total
30+ Nights
1 listings
4.3% of total
Key Insights
- The most prevalent minimum stay requirement in Malindi is 1 Night, adopted by 69.6% of listings. This highlights the market's preference for shorter, flexible bookings.
- A strong majority (95.7%) of the Malindi Airbnb data shows acceptance of very short stays (1-2 nights), indicating a dynamic, high-turnover market.
Recommendations
- Align with the market by considering a 1 Night minimum stay, as 69.6% of Malindi hosts use this setting.
- Adjust minimum nights based on seasonality – potentially shorter during low season and longer during peak demand periods in Malindi.
Malindi Airbnb Cancellation Policy Trends Analysis (2026)
Non-refundable
1 listings
4.5% of total
Flexible
11 listings
50% of total
Moderate
9 listings
40.9% of total
Firm
1 listings
4.5% of total
Cancellation Policy Insights for Malindi
- The prevailing Airbnb cancellation policy trend in Malindi is Flexible, used by 50% of listings.
- The market strongly favors guest-friendly terms, with 90.9% of listings offering Flexible or Moderate policies. This suggests guests in Malindi may expect booking flexibility.
Recommendations for Hosts
- Consider adopting a Flexible policy to align with the 50% market standard in Malindi.
- Regularly review your cancellation policy against competitors and market demand shifts in Malindi.
Malindi STR Booking Lead Time Analysis (2026)
Average Booking Lead Time by Month
Booking Lead Time Insights for Malindi
- The overall average booking lead time for vacation rentals in Malindi is 43 days.
- Guests book furthest in advance for stays during January (average 121 days), likely coinciding with peak travel demand or local events.
- The shortest booking windows occur for stays in May (average 3 days), indicating more last-minute travel plans during this time.
- Seasonally, Winter (67 days avg.) sees the longest lead times, while Spring (17 days avg.) has the shortest, reflecting typical travel planning cycles.
Recommendations for Hosts
- Use the overall average lead time (43 days) as a baseline for your pricing and availability strategy in Malindi.
- For January stays, consider implementing length-of-stay discounts or slightly higher rates for bookings made less than 121 days out to capitalize on advance planning.
- During May, focus on last-minute booking availability and promotions, as guests book with very short notice (3 days avg.).
- Target marketing efforts for the Winter season well in advance (at least 67 days) to capture early planners.
- Monitor your own booking lead times against these Malindi averages to identify opportunities for dynamic pricing adjustments.
Popular & Essential Airbnb Amenities in Malindi (2026)
Amenity Prevalence
Amenity Insights for Malindi
- Essential amenities in Malindi that guests expect include: Kitchen. Lacking these (this) could significantly impact bookings.
- Popular amenities like Wifi, Air conditioning, Dishes and silverware are common but not universal. Offering these can provide a competitive edge.
- Warning: Wifi is not universally provided but is considered essential globally. Ensure reliable Wifi is offered.
Recommendations for Hosts
- Ensure your listing includes all essential amenities for Malindi: Kitchen.
- Prioritize adding missing essentials: Kitchen.
- Consider adding popular differentiators like Wifi or Air conditioning to increase appeal.
- Highlight unique or less common amenities you offer (e.g., hot tub, dedicated workspace, EV charger) in your listing description and photos.
- Regularly check competitor amenities in Malindi to stay competitive.
Malindi Airbnb Guest Demographics & Profile Analysis (2026)
Guest Profile Summary for Malindi
- The typical guest profile for Airbnb in Malindi consists of predominantly international visitors (83%), with top international origins including United States, typically belonging to the Post-2000s (Gen Z/Alpha) group (50%), primarily speaking English or German.
- Domestic travelers account for 16.7% of guests.
- Key international markets include Tanzania (16.7%) and United States (13.9%).
- Top languages spoken are English (41.5%) followed by German (11.3%).
- A significant demographic segment is the Post-2000s (Gen Z/Alpha) group, representing 50% of guests.
Recommendations for Hosts
- Focus marketing internationally, particularly towards travelers from United States.
- Tailor amenities and listing descriptions to appeal to the dominant Post-2000s (Gen Z/Alpha) demographic (e.g., highlight fast WiFi, smart home features, local guides).
- Highlight unique local experiences or amenities relevant to the primary guest profile.
- Consider seasonal promotions aligned with peak travel times for key origin markets.
Nearby Short-Term Rental Market Comparison
How does the Malindi Airbnb market stack up against its neighbors? Compare key performance metrics like average monthly revenue, ADR, and occupancy rates in surrounding areas to understand the broader regional STR landscape.
| Market | Active Properties | Monthly Revenue | Daily Rate | Avg. Occupancy |
|---|---|---|---|---|
| Dongwe | 26 | $3,034 | $269.05 | 44% |
| Bwejuu | 45 | $2,252 | $239.42 | 39% |
| Matemwe | 22 | $2,061 | $230.11 | 29% |
| Kigomane | 21 | $1,967 | $186.76 | 36% |
| Bweleo | 14 | $1,926 | $302.10 | 27% |
| Kiwengwa | 101 | $1,377 | $177.91 | 32% |
| Jambiani | 231 | $1,335 | $134.98 | 36% |
| Pingwe | 21 | $1,184 | $208.15 | 22% |
| Fumba | 28 | $819 | $109.34 | 31% |
| Zanzibar | 93 | $735 | $107.50 | 31% |