Mhiri Airbnb Market Analysis 2026: Short Term Rental Data & Vacation Rental Statistics in Médenine, Tunisia
Is Airbnb profitable in Mhiri in 2026? Explore comprehensive Airbnb analytics for Mhiri, Médenine, Tunisia to uncover income potential. This 2026 STR market report for Mhiri, based on AirROI data from February 2025 to January 2026, reveals key trends in the niche market of 31 active listings.
Whether you're considering an Airbnb investment in Mhiri, optimizing your existing vacation rental, or exploring rental arbitrage opportunities, understanding the Mhiri Airbnb data is crucial. Leveraging the low regulation environment is key to maximizing your short term rental income potential. Let's dive into the specifics.
Key Mhiri Airbnb Performance Metrics Overview
Monthly Airbnb Revenue Variations & Income Potential in Mhiri (2026)
Understanding the monthly revenue variations for Airbnb listings in Mhiri is key to maximizing your short term rental income potential. Seasonality significantly impacts earnings. Our analysis, based on data from the past 12 months, shows that the peak revenue month for STRs in Mhiri is typically August, while January often presents the lowest earnings, highlighting opportunities for strategic pricing adjustments during shoulder and low seasons. Explore the typical Airbnb income in Mhiri across different performance tiers:
- Best-in-class properties (Top 10%) achieve $2,937+ monthly, often utilizing dynamic pricing and superior guest experiences.
- Strong performing properties (Top 25%) earn $2,165 or more, indicating effective management and desirable locations/amenities.
- Typical properties (Median) generate around $1,149 per month, representing the average market performance.
- Entry-level properties (Bottom 25%) see earnings around $636, often with potential for optimization.
Average Monthly Airbnb Earnings Trend in Mhiri
Mhiri Airbnb Occupancy Rate Trends (2026)
Maximize your bookings by understanding the Mhiri STR occupancy trends. Seasonal demand shifts significantly influence how often properties are booked. Typically, Augustsees the highest demand (peak season occupancy), while January experiences the lowest (low season). Effective strategies, like adjusting minimum stays or offering promotions, can boost occupancy during slower periods. Here's how different property tiers perform in Mhiri:
- Best-in-class properties (Top 10%) achieve 71%+ occupancy, indicating high desirability and potentially optimized availability.
- Strong performing properties (Top 25%) maintain 56% or higher occupancy, suggesting good market fit and guest satisfaction.
- Typical properties (Median) have an occupancy rate around 36%.
- Entry-level properties (Bottom 25%) average 18% occupancy, potentially facing higher vacancy.
Average Monthly Occupancy Rate Trend in Mhiri
Average Daily Rate (ADR) Airbnb Trends in Mhiri (2026)
Effective short term rental pricing strategy in Mhiri involves understanding monthly ADR fluctuations. The Average Daily Rate (ADR) for Airbnb in Mhiri typically peaks in August and dips lowest during February. Leveraging Airbnb dynamic pricing tools or strategies based on this seasonality can significantly boost revenue. Here's a look at the typical nightly rates achieved:
- Best-in-class properties (Top 10%) command rates of $167+ per night, often due to premium features or locations.
- Strong performing properties (Top 25%) achieve nightly rates of $130 or more.
- Typical properties (Median) charge around $92 per night.
- Entry-level properties (Bottom 25%) earn around $60 per night.
Average Daily Rate (ADR) Trend by Month in Mhiri
Get Live Mhiri Market Intelligence 👇

Explore Real-time Analytics
Airbnb Seasonality Analysis & Trends in Mhiri (2026)
Peak Season (August, July, September)
- Revenue averages $2,813 per month
- Occupancy rates average 55.8%
- Daily rates average $122
Shoulder Season
- Revenue averages $1,221 per month
- Occupancy maintains around 37.6%
- Daily rates hold near $98
Low Season (January, February, November)
- Revenue drops to average $566 per month
- Occupancy decreases to average 24.0%
- Daily rates adjust to average $97
Seasonality Insights for Mhiri
- The Airbnb seasonality in Mhiri shows highly seasonal trends requiring careful strategy. While the sections above show seasonal averages, it's also insightful to look at the extremes:
- During the high season, the absolute peak month showcases Mhiri's highest earning potential, with monthly revenues capable of climbing to $3,415, occupancy reaching a high of 63.4%, and ADRs peaking at $126.
- Conversely, the slowest single month of the year, typically falling within the low season, marks the market's lowest point. In this month, revenue might dip to $419, occupancy could drop to 20.7%, and ADRs may adjust down to $86.
- Understanding both the seasonal averages and these monthly peaks and troughs in revenue, occupancy, and ADR is crucial for maximizing your Airbnb profit potential in Mhiri.
Seasonal Strategies for Maximizing Profit
- Peak Season: Maximize revenue through premium pricing and potentially longer minimum stays. Ensure high availability.
- Low Season: Offer competitive pricing, special promotions (e.g., extended stay discounts), and flexible cancellation policies. Target off-season travelers like remote workers or budget-conscious guests.
- Shoulder Seasons: Implement dynamic pricing that balances peak and low rates. Target weekend travelers or specific events. Offer slightly more flexible terms than peak season.
- Regularly analyze your own performance against these Mhiri seasonality benchmarks and adjust your pricing and availability strategy accordingly.
Best Areas for Airbnb Investment in Mhiri (2026)
Exploring the top neighborhoods for short-term rentals in Mhiri? This section highlights key areas, outlining why they are attractive for hosts and guests, along with notable local attractions. Consider these locations based on your target guest profile and investment strategy.
| Neighborhood / Area | Why Host Here? (Target Guests & Appeal) | Key Attractions & Landmarks |
|---|---|---|
| Djerba | Popular island known for its beautiful beaches, rich history, and unique culture. Ideal for tourists seeking a relaxing getaway with plenty of local attractions and activities. | Moulay Youssef Mosque, Djerba Explore Park, Houmt Souk, Plage de Sidi Mahrez, El Ghriba Synagogue |
| Medenine | The capital of the Medenine Governorate, offering cultural experiences and historical sites. A great base for exploring the surrounding desert and Berber villages. | Ksar Ouled Soltane, Medina of Medenine, Las Salinas, Chott el Jerid, Ribat of Medenine |
| Matmata | Famous for its unique troglodyte dwellings and connections to Star Wars filming. Attracts tourists interested in history and culture. | Matmata Troglodyte Hotel, Museum of Matmata, Ksar Ouled Bourram, Local Berber culture |
| Zarzis | Lively coastal town with beautiful beaches and a mix of Tunisian and Berber culture. Suitable for travelers who love sun and sea. | Zarzis Beach, El Mouradi Beach, Zarzis Museum, Tunisian cuisine |
| Ajim | Charming town on the island of Djerba, known for its beautiful coast and seafood. Great for those looking for a quieter beach experience. | Ajim Beach, Fishing Port, Local markets, Tunisia's coastline |
| Ksar Ouled Soltane | A historical site known for its well-preserved granaries and traditional architecture. Attracts visitors interested in history and local culture. | Ksar Ouled Soltane, Traditional Berber culture, Local museums |
| Sidi Mahrez | Famous for its stunning beach and vibrant nightlife, making it a hotspot for tourists. Ideal for younger travelers looking for entertainment. | Sidi Mahrez Beach, Nightclubs, Water sports, Local restaurants |
| Tataouine | Known for its unique landscapes and as a gateway to the desert. Great for adventurous travelers looking to explore nature and history. | Ksar Ouled Soltane, Berber villages, Chams El Fawq |
Understanding Airbnb License Requirements & STR Laws in Mhiri (2026)
While Mhiri, Médenine, Tunisia currently shows low STR regulations, specific Airbnb license requirements might still exist or change. Always verify the latest short term rental regulations and Airbnb license requirements directly with local government authorities for Mhiri to ensure full compliance before hosting.
(Source: AirROI data, 2026, finding no licensed listings among those analyzed)
Top Performing Airbnb Properties in Mhiri (2026)
Benchmark your potential! Explore examples of top-performing Airbnb properties in Mhiribased on Trailing Twelve Month (TTM) revenue. Analyze their characteristics, revenue, occupancy rate, and ADR to understand what drives success in this market.

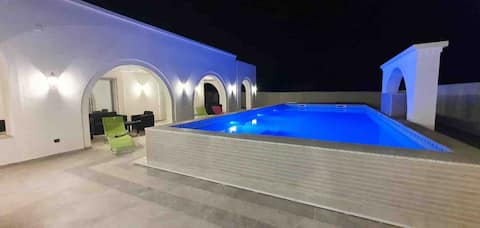
A villa surrounded by palm trees
Entire Place • 5 bedrooms

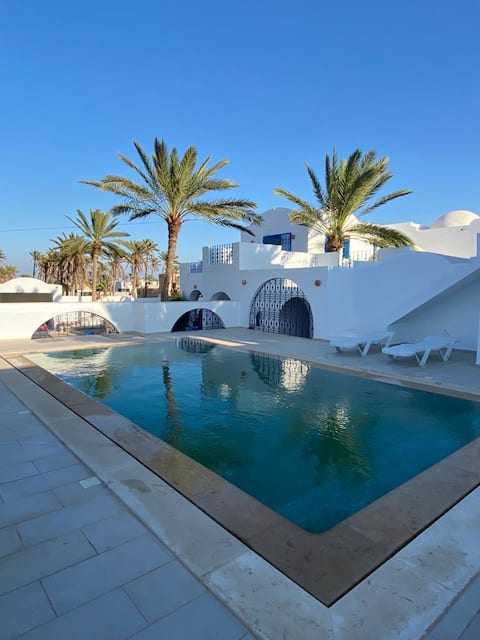
Villa Galant by night
Entire Place • 6 bedrooms
Villa Jenna & Villa Zakia - Luxury, Pool and Quiet
Entire Place • 5 bedrooms

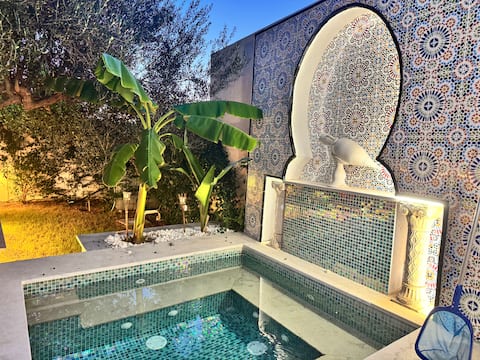
Luxury villa with pool
Entire Place • 3 bedrooms
Traditional-style villa with a private pool
Entire Place • 3 bedrooms
Villa Farah. A true haven of peace. Not overlooked.
Entire Place • 3 bedrooms
Note: Performance varies based on location, size, amenities, seasonality, and management quality. Data reflects the past 12 months.
Top Performing Airbnb Hosts in Mhiri (2026)
Learn from the best! This table showcases top-performing Airbnb hosts in Mhiri based on the number of properties managed and estimated total revenue over the past year. Analyze their scale and performance metrics.
| Host Name | Properties | Grossing Revenue | Stay Reviews | Avg Rating |
|---|---|---|---|---|
| Nabila | 2 | $46,369 | 24 | 4.89/5.0 |
| Mouez | 1 | $27,033 | 3 | 5.00/5.0 |
| Sophia | 1 | $22,811 | 12 | 5.00/5.0 |
| Kardi | 1 | $21,242 | 15 | 5.00/5.0 |
| Aziz | 1 | $20,687 | 11 | 5.00/5.0 |
| Sonia | 1 | $19,049 | 40 | 4.85/5.0 |
| Mina | 1 | $15,828 | 24 | 4.83/5.0 |
| Hela | 1 | $15,791 | 13 | 4.85/5.0 |
| Koutini | 1 | $13,112 | 9 | 4.56/5.0 |
| Younes | 1 | $13,059 | 42 | 4.76/5.0 |
Analyzing the strategies of top hosts, such as their property selection, pricing, and guest communication, can offer valuable lessons for optimizing your own Airbnb operations in Mhiri.
Dive Deeper: Advanced Mhiri STR Market Data (2026)
Ready to unlock more insights? AirROI provides access to advanced metrics and comprehensive Airbnb data for Mhiri. Explore detailed analytics beyond this report to refine your investment strategy, optimize pricing, and maximize your vacation rental profits.
Explore Advanced MetricsMhiri Short-Term Rental Market Composition (2026): Property & Room Types
Room Type Distribution
Property Type Distribution
Market Composition Insights for Mhiri
- The Mhiri Airbnb market composition is heavily skewed towards Entire Home/Apt listings, which make up 96.8% of the 31 active rentals. This indicates strong guest preference for privacy and space.
- Looking at the property type distribution in Mhiri, House properties are the most common (90.3%), reflecting the local real estate landscape.
- Houses represent a significant 90.3% portion, catering likely to families or larger groups.
- Smaller segments like hotel/boutique (combined 3.2%) offer potential for unique stay experiences.
Mhiri Airbnb Room Capacity Analysis (2026): Bedroom Distribution
Distribution of Listings by Number of Bedrooms
Room Capacity Insights for Mhiri
- The dominant room capacity in Mhiri is 3 bedrooms listings, making up 51.6% of the market. This suggests a strong demand for properties suitable for families or small groups.
- Together, 3 bedrooms and 2 bedrooms properties represent 74.2% of the active Airbnb listings in Mhiri, indicating a high concentration in these sizes.
- A significant 67.8% of listings offer 3+ bedrooms, catering to larger groups and families seeking more space in Mhiri.
Mhiri Vacation Rental Guest Capacity Trends (2026)
Distribution of Listings by Guest Capacity
Guest Capacity Insights for Mhiri
- The most common guest capacity trend in Mhiri vacation rentals is listings accommodating 6 guests (45.2%). This suggests the primary traveler segment is likely larger groups.
- Properties designed for 6 guests and 8+ guests dominate the Mhiri STR market, accounting for 67.8% of listings.
- 74.3% of properties accommodate 6+ guests, serving the market segment for larger families or group travel in Mhiri.
- On average, properties in Mhiri are equipped to host 5.9 guests.
Mhiri Airbnb Booking Patterns (2026): Available vs. Booked Days
Available Days Distribution
Booked Days Distribution
Booking Pattern Insights for Mhiri
- The most common availability pattern in Mhiri falls within the 271-366 days range, representing 64.5% of listings. This suggests many properties have significant open periods on their calendars.
- Approximately 93.5% of listings show high availability (181+ days open annually), indicating potential for increased bookings or specific owner usage patterns.
- For booked days, the 1-30 days range is most frequent in Mhiri (32.3%), reflecting common guest stay durations or potential owner blocking patterns.
- A notable 6.5% of properties secure long booking periods (181+ days booked per year), highlighting successful long-term rental strategies or significant owner usage.
Mhiri Airbnb Minimum Stay Requirements Analysis
Distribution of Listings by Minimum Night Requirement
1 Night
10 listings
32.3% of total
2 Nights
2 listings
6.5% of total
3 Nights
4 listings
12.9% of total
4-6 Nights
5 listings
16.1% of total
30+ Nights
10 listings
32.3% of total
Key Insights
- The most prevalent minimum stay requirement in Mhiri is 1 Night, adopted by 32.3% of listings. This highlights the market's preference for shorter, flexible bookings.
- A significant segment (32.3%) caters to monthly stays (30+ nights) in Mhiri, pointing to opportunities in the extended-stay market.
Recommendations
- Align with the market by considering a 1 Night minimum stay, as 32.3% of Mhiri hosts use this setting.
- Explore offering discounts for stays of 30+ nights to attract the 32.3% of the market seeking extended stays.
- Adjust minimum nights based on seasonality – potentially shorter during low season and longer during peak demand periods in Mhiri.
Mhiri Airbnb Cancellation Policy Trends Analysis (2026)
Flexible
12 listings
38.7% of total
Moderate
2 listings
6.5% of total
Firm
12 listings
38.7% of total
Strict
5 listings
16.1% of total
Cancellation Policy Insights for Mhiri
- The prevailing Airbnb cancellation policy trend in Mhiri is Flexible, used by 38.7% of listings.
- A majority (54.8%) of hosts in Mhiri utilize Firm or Strict policies, indicating a market where hosts prioritize booking security.
Recommendations for Hosts
- Consider adopting a Flexible policy to align with the 38.7% market standard in Mhiri.
- Regularly review your cancellation policy against competitors and market demand shifts in Mhiri.
Mhiri STR Booking Lead Time Analysis (2026)
Average Booking Lead Time by Month
Booking Lead Time Insights for Mhiri
- The overall average booking lead time for vacation rentals in Mhiri is 48 days.
- Guests book furthest in advance for stays during July (average 90 days), likely coinciding with peak travel demand or local events.
- The shortest booking windows occur for stays in November (average 15 days), indicating more last-minute travel plans during this time.
- Seasonally, Summer (70 days avg.) sees the longest lead times, while Winter (20 days avg.) has the shortest, reflecting typical travel planning cycles.
Recommendations for Hosts
- Use the overall average lead time (48 days) as a baseline for your pricing and availability strategy in Mhiri.
- For July stays, consider implementing length-of-stay discounts or slightly higher rates for bookings made less than 90 days out to capitalize on advance planning.
- Target marketing efforts for the Summer season well in advance (at least 70 days) to capture early planners.
- Monitor your own booking lead times against these Mhiri averages to identify opportunities for dynamic pricing adjustments.
Popular & Essential Airbnb Amenities in Mhiri (2026)
Amenity Prevalence
Amenity Insights for Mhiri
- Essential amenities in Mhiri that guests expect include: Air conditioning, TV, Washer, Kitchen. Lacking these (any) could significantly impact bookings.
- Popular amenities like Pool, Outdoor dining area, Free parking on premises are common but not universal. Offering these can provide a competitive edge.
- A pool is a highly desired but not standard amenity, making it a key feature for attracting guests seeking leisure in Mhiri.
- Warning: Wifi is not universally provided but is considered essential globally. Ensure reliable Wifi is offered.
Recommendations for Hosts
- Ensure your listing includes all essential amenities for Mhiri: Air conditioning, TV, Washer, Kitchen.
- Prioritize adding missing essentials: Washer, Kitchen.
- Consider adding popular differentiators like Pool or Outdoor dining area to increase appeal.
- Highlight unique or less common amenities you offer (e.g., hot tub, dedicated workspace, EV charger) in your listing description and photos.
- Regularly check competitor amenities in Mhiri to stay competitive.
Mhiri Airbnb Guest Demographics & Profile Analysis (2026)
Guest Profile Summary for Mhiri
- The typical guest profile for Airbnb in Mhiri consists of predominantly international visitors (100%), with top international origins including Germany, typically belonging to the Post-2000s (Gen Z/Alpha) group (50%), primarily speaking French or English.
- Domestic travelers account for 0.0% of guests.
- Key international markets include France (78.9%) and Germany (5.3%).
- Top languages spoken are French (37%) followed by English (28.8%).
- A significant demographic segment is the Post-2000s (Gen Z/Alpha) group, representing 50% of guests.
Recommendations for Hosts
- Focus marketing internationally, particularly towards travelers from Germany.
- Offer listing details and communication support in French.
- Tailor amenities and listing descriptions to appeal to the dominant Post-2000s (Gen Z/Alpha) demographic (e.g., highlight fast WiFi, smart home features, local guides).
- Highlight unique local experiences or amenities relevant to the primary guest profile.
- Consider seasonal promotions aligned with peak travel times for key origin markets.
Nearby Short-Term Rental Market Comparison
How does the Mhiri Airbnb market stack up against its neighbors? Compare key performance metrics like average monthly revenue, ADR, and occupancy rates in surrounding areas to understand the broader regional STR landscape.
| Market | Active Properties | Monthly Revenue | Daily Rate | Avg. Occupancy |
|---|---|---|---|---|
| El Haddada | 37 | $1,071 | $138.05 | 39% |
| Aghir | 50 | $983 | $136.17 | 38% |
| Midoun | 68 | $877 | $152.00 | 38% |
| Mouammar | 10 | $839 | $76.75 | 35% |
| Plage de Sidi Mahrez | 14 | $814 | $94.52 | 36% |
| Tezdaine | 86 | $773 | $138.34 | 37% |
| Arkou | 15 | $727 | $141.80 | 34% |
| Djerba Midun | 45 | $712 | $110.92 | 43% |
| Khazroun | 17 | $695 | $113.34 | 36% |
| Ouled Amor | 19 | $683 | $86.69 | 40% |