Frederiksted Airbnb Market Analysis 2026: Short Term Rental Data & Vacation Rental Statistics in St. Croix, U.S. Virgin Islands
Is Airbnb profitable in Frederiksted in 2026? Explore comprehensive Airbnb analytics for Frederiksted, St. Croix, U.S. Virgin Islands to uncover income potential. This 2026 STR market report for Frederiksted, based on AirROI data from February 2025 to January 2026, reveals key trends in the niche market of 85 active listings.
Whether you're considering an Airbnb investment in Frederiksted, optimizing your existing vacation rental, or exploring rental arbitrage opportunities, understanding the Frederiksted Airbnb data is crucial. Leveraging the low regulation environment is key to maximizing your short term rental income potential. Let's dive into the specifics.
Key Frederiksted Airbnb Performance Metrics Overview
Monthly Airbnb Revenue Variations & Income Potential in Frederiksted (2026)
Understanding the monthly revenue variations for Airbnb listings in Frederiksted is key to maximizing your short term rental income potential. Seasonality significantly impacts earnings. Our analysis, based on data from the past 12 months, shows that the peak revenue month for STRs in Frederiksted is typically March, while September often presents the lowest earnings, highlighting opportunities for strategic pricing adjustments during shoulder and low seasons. Explore the typical Airbnb income in Frederiksted across different performance tiers:
- Best-in-class properties (Top 10%) achieve $7,843+ monthly, often utilizing dynamic pricing and superior guest experiences.
- Strong performing properties (Top 25%) earn $4,173 or more, indicating effective management and desirable locations/amenities.
- Typical properties (Median) generate around $1,843 per month, representing the average market performance.
- Entry-level properties (Bottom 25%) see earnings around $1,012, often with potential for optimization.
Average Monthly Airbnb Earnings Trend in Frederiksted
Frederiksted Airbnb Occupancy Rate Trends (2026)
Maximize your bookings by understanding the Frederiksted STR occupancy trends. Seasonal demand shifts significantly influence how often properties are booked. Typically, Marchsees the highest demand (peak season occupancy), while September experiences the lowest (low season). Effective strategies, like adjusting minimum stays or offering promotions, can boost occupancy during slower periods. Here's how different property tiers perform in Frederiksted:
- Best-in-class properties (Top 10%) achieve 80%+ occupancy, indicating high desirability and potentially optimized availability.
- Strong performing properties (Top 25%) maintain 55% or higher occupancy, suggesting good market fit and guest satisfaction.
- Typical properties (Median) have an occupancy rate around 34%.
- Entry-level properties (Bottom 25%) average 19% occupancy, potentially facing higher vacancy.
Average Monthly Occupancy Rate Trend in Frederiksted
Average Daily Rate (ADR) Airbnb Trends in Frederiksted (2026)
Effective short term rental pricing strategy in Frederiksted involves understanding monthly ADR fluctuations. The Average Daily Rate (ADR) for Airbnb in Frederiksted typically peaks in December and dips lowest during April. Leveraging Airbnb dynamic pricing tools or strategies based on this seasonality can significantly boost revenue. Here's a look at the typical nightly rates achieved:
- Best-in-class properties (Top 10%) command rates of $391+ per night, often due to premium features or locations.
- Strong performing properties (Top 25%) achieve nightly rates of $264 or more.
- Typical properties (Median) charge around $183 per night.
- Entry-level properties (Bottom 25%) earn around $125 per night.
Average Daily Rate (ADR) Trend by Month in Frederiksted
Get Live Frederiksted Market Intelligence 👇

Explore Real-time Analytics
Airbnb Seasonality Analysis & Trends in Frederiksted (2026)
Peak Season (March, February, July)
- Revenue averages $4,200 per month
- Occupancy rates average 48.3%
- Daily rates average $218
Shoulder Season
- Revenue averages $3,341 per month
- Occupancy maintains around 38.7%
- Daily rates hold near $224
Low Season (January, September, October)
- Revenue drops to average $2,670 per month
- Occupancy decreases to average 30.9%
- Daily rates adjust to average $231
Seasonality Insights for Frederiksted
- The Airbnb seasonality in Frederiksted shows moderate seasonality with distinct peak and low periods. While the sections above show seasonal averages, it's also insightful to look at the extremes:
- During the high season, the absolute peak month showcases Frederiksted's highest earning potential, with monthly revenues capable of climbing to $4,523, occupancy reaching a high of 55.7%, and ADRs peaking at $239.
- Conversely, the slowest single month of the year, typically falling within the low season, marks the market's lowest point. In this month, revenue might dip to $2,507, occupancy could drop to 23.6%, and ADRs may adjust down to $214.
- Understanding both the seasonal averages and these monthly peaks and troughs in revenue, occupancy, and ADR is crucial for maximizing your Airbnb profit potential in Frederiksted.
Seasonal Strategies for Maximizing Profit
- Peak Season: Maximize revenue through premium pricing and potentially longer minimum stays. Ensure high availability.
- Low Season: Offer competitive pricing, special promotions (e.g., extended stay discounts), and flexible cancellation policies. Target off-season travelers like remote workers or budget-conscious guests.
- Shoulder Seasons: Implement dynamic pricing that balances peak and low rates. Target weekend travelers or specific events. Offer slightly more flexible terms than peak season.
- Regularly analyze your own performance against these Frederiksted seasonality benchmarks and adjust your pricing and availability strategy accordingly.
Best Areas for Airbnb Investment in Frederiksted (2026)
Exploring the top neighborhoods for short-term rentals in Frederiksted? This section highlights key areas, outlining why they are attractive for hosts and guests, along with notable local attractions. Consider these locations based on your target guest profile and investment strategy.
| Neighborhood / Area | Why Host Here? (Target Guests & Appeal) | Key Attractions & Landmarks |
|---|---|---|
| Christiansted | Nearby historical town known for its colonial architecture and vibrant waterfront. It's a favorite among tourists wanting to explore St. Croix's history while enjoying quaint shops and restaurants. | Fort Christianvaern, Christiansted National Historic Site, Gallows Bay, The Estate Whim Plantation Museum, Sandy Point National Wildlife Refuge |
| Cramer Park | This beach park offers tropical scenery and a less crowded beach experience. It's ideal for families and groups looking for a relaxing day in the sun. | Cramer Park Beach, Rum Runner's Restaurant, Hiking trails, Beach volleyball courts |
| Cane Bay | Famous for its stunning beach and excellent diving and snorkeling opportunities. It's a prime spot for water activities and attracts a lot of adventurous tourists. | Cane Bay Beach, Wall of Dungeons diving site, Cane Bay Rum Distillery, The Reef, Kayaking |
| Frederiksted Pier | The historic pier and surrounding area provide beautiful views and easy access to beachfront activities. It’s a great spot for those looking to mix relaxation with local culture. | Frederiksted Pier, Fort Frederik, Rachel and A.C. Doran Beach, Nearby cafes and shops, Cultural events like Carnival |
| Salt River Bay | Rich in history and natural beauty, this area is a great destination for eco-tourism. It offers kayaking, historical sites, and bird watching. | Salt River Bay National Historical Park, Kayaking tours, Scenic hiking trails, Cultural heritage sites |
| Rainmaker's Lodge | A unique rainforest experience on the island offers a mystical escape for nature lovers. Popular with tourists looking for tranquility away from the beach. | Rainmaker's Lodge tours, Hiking, Nature trails, Eco-friendly activities, Waterfalls |
| V.I. Eco Tours | An exciting eco-tourism experience that combines adventure with education, appealing to families looking to explore nature together. | Kayaking, Snorkeling, Guided tours through mangroves, Wildlife sightings |
| The Old Danish West India Company Warehouse | Rich in history, this site attracts guests interested in the heritage of St. Croix while providing a unique atmosphere with nearby dining options. | Cultural icons and artifacts, Nearby shopping and cafes, Historical tours |
Understanding Airbnb License Requirements & STR Laws in Frederiksted (2026)
While Frederiksted, St. Croix, U.S. Virgin Islands currently shows low STR regulations, specific Airbnb license requirements might still exist or change. Always verify the latest short term rental regulations and Airbnb license requirements directly with local government authorities for Frederiksted to ensure full compliance before hosting.
(Source: AirROI data, 2026, based on 1% licensed listings)
Top Performing Airbnb Properties in Frederiksted (2026)
Benchmark your potential! Explore examples of top-performing Airbnb properties in Frederikstedbased on Trailing Twelve Month (TTM) revenue. Analyze their characteristics, revenue, occupancy rate, and ADR to understand what drives success in this market.
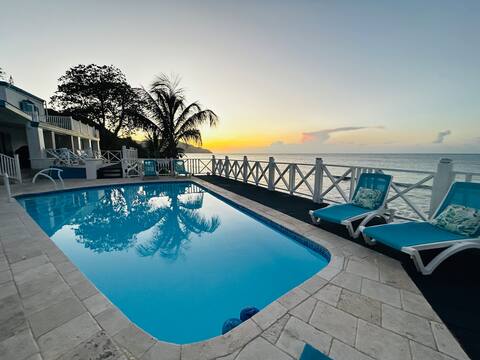
St. Croix Beachfront Villa | Pool | Panoramic View
Entire Place • 4 bedrooms
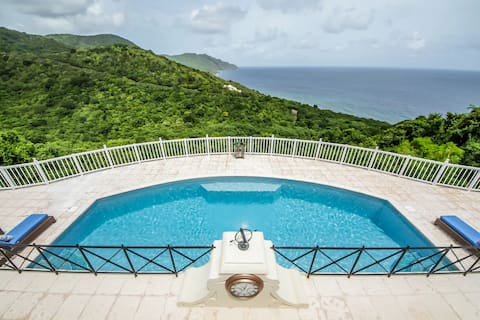
Gorgeous view of the Caribbean Sea to Rain Forest!
Entire Place • 6 bedrooms
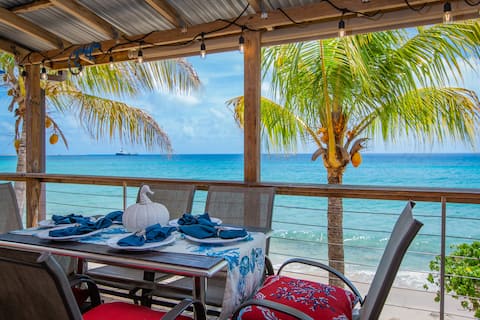
Beachfront | Walk to Restaurants & Historic Sites
Entire Place • 3 bedrooms
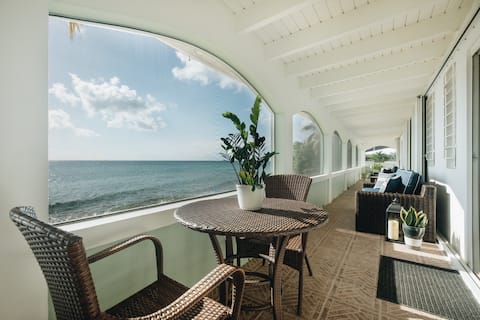
Beachfront | Near Downtown | Auto-On Generator
Entire Place • 2 bedrooms

Sunset Beach Dreams
Entire Place • 2 bedrooms
Sunset Beach Cottage
Entire Place • 3 bedrooms
Note: Performance varies based on location, size, amenities, seasonality, and management quality. Data reflects the past 12 months.
Top Performing Airbnb Hosts in Frederiksted (2026)
Learn from the best! This table showcases top-performing Airbnb hosts in Frederiksted based on the number of properties managed and estimated total revenue over the past year. Analyze their scale and performance metrics.
| Host Name | Properties | Grossing Revenue | Stay Reviews | Avg Rating |
|---|---|---|---|---|
| Barbara | 1 | $247,048 | 41 | 5.00/5.0 |
| Our Home Rentals | 2 | $245,613 | 86 | 5.00/5.0 |
| Sarah | 4 | $162,125 | 96 | 4.89/5.0 |
| Nancy | 1 | $150,447 | 22 | 4.82/5.0 |
| Morisa | 8 | $139,176 | 573 | 4.82/5.0 |
| Stuart | 2 | $119,810 | 106 | 4.94/5.0 |
| Feather Leaf Inn | 2 | $74,669 | 83 | 4.88/5.0 |
| Joy | 1 | $64,662 | 88 | 4.95/5.0 |
| Mindy | 1 | $62,951 | 27 | 4.89/5.0 |
| Robert | 1 | $56,631 | 32 | 4.88/5.0 |
Analyzing the strategies of top hosts, such as their property selection, pricing, and guest communication, can offer valuable lessons for optimizing your own Airbnb operations in Frederiksted.
Dive Deeper: Advanced Frederiksted STR Market Data (2026)
Ready to unlock more insights? AirROI provides access to advanced metrics and comprehensive Airbnb data for Frederiksted. Explore detailed analytics beyond this report to refine your investment strategy, optimize pricing, and maximize your vacation rental profits.
Explore Advanced MetricsFrederiksted Short-Term Rental Market Composition (2026): Property & Room Types
Room Type Distribution
Property Type Distribution
Market Composition Insights for Frederiksted
- The Frederiksted Airbnb market composition is heavily skewed towards Entire Home/Apt listings, which make up 90.6% of the 85 active rentals. This indicates strong guest preference for privacy and space.
- Looking at the property type distribution in Frederiksted, Apartment/Condo properties are the most common (44.7%), reflecting the local real estate landscape.
- Houses represent a significant 42.4% portion, catering likely to families or larger groups.
- Smaller segments like hotel/boutique, others (combined 3.6%) offer potential for unique stay experiences.
Frederiksted Airbnb Room Capacity Analysis (2026): Bedroom Distribution
Distribution of Listings by Number of Bedrooms
Room Capacity Insights for Frederiksted
- The dominant room capacity in Frederiksted is 1 bedroom listings, making up 42.4% of the market. This suggests a strong demand for properties suitable for couples or solo travelers.
- Together, 1 bedroom and 2 bedrooms properties represent 69.5% of the active Airbnb listings in Frederiksted, indicating a high concentration in these sizes.
- A significant 23.6% of listings offer 3+ bedrooms, catering to larger groups and families seeking more space in Frederiksted.
Frederiksted Vacation Rental Guest Capacity Trends (2026)
Distribution of Listings by Guest Capacity
Guest Capacity Insights for Frederiksted
- The most common guest capacity trend in Frederiksted vacation rentals is listings accommodating 4 guests (29.4%). This suggests the primary traveler segment is likely small families or groups.
- Properties designed for 4 guests and 6 guests dominate the Frederiksted STR market, accounting for 51.8% of listings.
- 33.0% of properties accommodate 6+ guests, serving the market segment for larger families or group travel in Frederiksted.
- On average, properties in Frederiksted are equipped to host 4.2 guests.
Frederiksted Airbnb Booking Patterns (2026): Available vs. Booked Days
Available Days Distribution
Booked Days Distribution
Booking Pattern Insights for Frederiksted
- The most common availability pattern in Frederiksted falls within the 271-366 days range, representing 61.2% of listings. This suggests many properties have significant open periods on their calendars.
- Approximately 88.3% of listings show high availability (181+ days open annually), indicating potential for increased bookings or specific owner usage patterns.
- For booked days, the 31-90 days range is most frequent in Frederiksted (36.5%), reflecting common guest stay durations or potential owner blocking patterns.
- A notable 11.7% of properties secure long booking periods (181+ days booked per year), highlighting successful long-term rental strategies or significant owner usage.
Frederiksted Airbnb Minimum Stay Requirements Analysis
Distribution of Listings by Minimum Night Requirement
1 Night
18 listings
21.2% of total
2 Nights
15 listings
17.6% of total
3 Nights
13 listings
15.3% of total
4-6 Nights
15 listings
17.6% of total
7-29 Nights
1 listings
1.2% of total
30+ Nights
23 listings
27.1% of total
Key Insights
- The most prevalent minimum stay requirement in Frederiksted is 30+ Nights, adopted by 27.1% of listings. This highlights the market's preference for longer commitments.
- A significant segment (27.1%) caters to monthly stays (30+ nights) in Frederiksted, pointing to opportunities in the extended-stay market.
Recommendations
- Align with the market by considering a 30+ Nights minimum stay, as 27.1% of Frederiksted hosts use this setting.
- If feasible, allowing 1-night stays, especially midweek or during low season, could capture last-minute bookings, as only 21.2% currently do.
- Explore offering discounts for stays of 30+ nights to attract the 27.1% of the market seeking extended stays.
- Adjust minimum nights based on seasonality – potentially shorter during low season and longer during peak demand periods in Frederiksted.
Frederiksted Airbnb Cancellation Policy Trends Analysis (2026)
Flexible
29 listings
34.1% of total
Moderate
18 listings
21.2% of total
Firm
31 listings
36.5% of total
Strict
7 listings
8.2% of total
Cancellation Policy Insights for Frederiksted
- The prevailing Airbnb cancellation policy trend in Frederiksted is Firm, used by 36.5% of listings.
- There's a relatively balanced mix between guest-friendly (55.3%) and stricter (44.7%) policies, offering choices for different guest needs.
- Strict cancellation policies are quite rare (8.2%), potentially making listings with this policy less competitive unless justified by high demand or property type.
Recommendations for Hosts
- Consider adopting a Firm policy to align with the 36.5% market standard in Frederiksted.
- Using a Strict policy might deter some guests, as only 8.2% of listings use it. Evaluate if potential revenue protection outweighs possible lower booking rates.
- Regularly review your cancellation policy against competitors and market demand shifts in Frederiksted.
Frederiksted STR Booking Lead Time Analysis (2026)
Average Booking Lead Time by Month
Booking Lead Time Insights for Frederiksted
- The overall average booking lead time for vacation rentals in Frederiksted is 63 days.
- Guests book furthest in advance for stays during January (average 113 days), likely coinciding with peak travel demand or local events.
- The shortest booking windows occur for stays in October (average 39 days), indicating more last-minute travel plans during this time.
- Seasonally, Winter (98 days avg.) sees the longest lead times, while Summer (46 days avg.) has the shortest, reflecting typical travel planning cycles.
Recommendations for Hosts
- Use the overall average lead time (63 days) as a baseline for your pricing and availability strategy in Frederiksted.
- For January stays, consider implementing length-of-stay discounts or slightly higher rates for bookings made less than 113 days out to capitalize on advance planning.
- Target marketing efforts for the Winter season well in advance (at least 98 days) to capture early planners.
- Monitor your own booking lead times against these Frederiksted averages to identify opportunities for dynamic pricing adjustments.
Popular & Essential Airbnb Amenities in Frederiksted (2026)
Amenity Prevalence
Amenity Insights for Frederiksted
- Essential amenities in Frederiksted that guests expect include: Free parking on premises, Wifi, Kitchen. Lacking these (any) could significantly impact bookings.
- Popular amenities like Refrigerator, Dishes and silverware, Hot water are common but not universal. Offering these can provide a competitive edge.
Recommendations for Hosts
- Ensure your listing includes all essential amenities for Frederiksted: Free parking on premises, Wifi, Kitchen.
- Prioritize adding missing essentials: Kitchen.
- Consider adding popular differentiators like Refrigerator or Dishes and silverware to increase appeal.
- Highlight unique or less common amenities you offer (e.g., hot tub, dedicated workspace, EV charger) in your listing description and photos.
- Regularly check competitor amenities in Frederiksted to stay competitive.
Frederiksted Airbnb Guest Demographics & Profile Analysis (2026)
Guest Profile Summary for Frederiksted
- The typical guest profile for Airbnb in Frederiksted consists of predominantly international visitors (95%), with top international origins including U.S. Virgin Islands, typically belonging to the Post-2000s (Gen Z/Alpha) group (50%), primarily speaking English or Spanish.
- Domestic travelers account for 5.5% of guests.
- Key international markets include United States (88%) and U.S. Virgin Islands (5.5%).
- Top languages spoken are English (73.8%) followed by Spanish (19.3%).
- A significant demographic segment is the Post-2000s (Gen Z/Alpha) group, representing 50% of guests.
Recommendations for Hosts
- Focus marketing internationally, particularly towards travelers from U.S. Virgin Islands.
- Tailor amenities and listing descriptions to appeal to the dominant Post-2000s (Gen Z/Alpha) demographic (e.g., highlight fast WiFi, smart home features, local guides).
- Highlight unique local experiences or amenities relevant to the primary guest profile.
- Consider seasonal promotions aligned with peak travel times for key origin markets.
Nearby Short-Term Rental Market Comparison
How does the Frederiksted Airbnb market stack up against its neighbors? Compare key performance metrics like average monthly revenue, ADR, and occupancy rates in surrounding areas to understand the broader regional STR landscape.
| Market | Active Properties | Monthly Revenue | Daily Rate | Avg. Occupancy |
|---|---|---|---|---|
| Central | 15 | $7,894 | $1132.95 | 46% |
| Cruz Bay | 399 | $6,017 | $618.02 | 46% |
| Long Bay Village | 26 | $5,969 | $1098.49 | 32% |
| Northside | 62 | $5,784 | $544.57 | 42% |
| Fortuna | 14 | $5,521 | $311.09 | 50% |
| Coral Harbour | 162 | $5,478 | $461.88 | 51% |
| Charlotte Amalie | 12 | $4,939 | $453.47 | 42% |
| West End Village | 21 | $4,844 | $1011.24 | 33% |
| Cruz Bay | 26 | $4,683 | $550.44 | 41% |
| Simpson Bay | 71 | $4,362 | $469.96 | 41% |