St. Croix Airbnb Market Analysis 2025: Short Term Rental Data & Vacation Rental Statistics in United States Virgin Islands, U.S. Virgin Islands
Is Airbnb profitable in St. Croix in 2025? Explore comprehensive Airbnb analytics for St. Croix, United States Virgin Islands, U.S. Virgin Islands to uncover income potential. This 2025 STR market report for St. Croix, based on AirROI data from April 2024 to March 2025, reveals key trends in the niche market of 28 active listings.
Whether you're considering an Airbnb investment in St. Croix, optimizing your existing vacation rental, or exploring rental arbitrage opportunities, understanding the St. Croix Airbnb data is crucial. Leveraging the low regulation environment is key to maximizing your short term rental income potential. Let's dive into the specifics.
Key St. Croix Airbnb Performance Metrics Overview
Monthly Airbnb Revenue Variations & Income Potential in St. Croix (2025)
Understanding the monthly revenue variations for Airbnb listings in St. Croix is key to maximizing your short term rental income potential. Seasonality significantly impacts earnings. Our analysis, based on data from the past 12 months, shows that the peak revenue month for STRs in St. Croix is typically February, while October often presents the lowest earnings, highlighting opportunities for strategic pricing adjustments during shoulder and low seasons. Explore the typical Airbnb income in St. Croix across different performance tiers:
- Best-in-class properties (Top 10%) achieve $13,719+ monthly, often utilizing dynamic pricing and superior guest experiences.
- Strong performing properties (Top 25%) earn $6,109 or more, indicating effective management and desirable locations/amenities.
- Typical properties (Median) generate around $2,556 per month, representing the average market performance.
- Entry-level properties (Bottom 25%) see earnings around $1,101, often with potential for optimization.
Average Monthly Airbnb Earnings Trend in St. Croix
St. Croix Airbnb Occupancy Rate Trends (2025)
Maximize your bookings by understanding the St. Croix STR occupancy trends. Seasonal demand shifts significantly influence how often properties are booked. Typically, Februarysees the highest demand (peak season occupancy), while September experiences the lowest (low season). Effective strategies, like adjusting minimum stays or offering promotions, can boost occupancy during slower periods. Here's how different property tiers perform in St. Croix:
- Best-in-class properties (Top 10%) achieve 72%+ occupancy, indicating high desirability and potentially optimized availability.
- Strong performing properties (Top 25%) maintain 55% or higher occupancy, suggesting good market fit and guest satisfaction.
- Typical properties (Median) have an occupancy rate around 37%.
- Entry-level properties (Bottom 25%) average 15% occupancy, potentially facing higher vacancy.
Average Monthly Occupancy Rate Trend in St. Croix
Average Daily Rate (ADR) Airbnb Trends in St. Croix (2025)
Effective short term rental pricing strategy in St. Croix involves understanding monthly ADR fluctuations. The Average Daily Rate (ADR) for Airbnb in St. Croix typically peaks in December and dips lowest during September. Leveraging Airbnb dynamic pricing tools or strategies based on this seasonality can significantly boost revenue. Here's a look at the typical nightly rates achieved:
- Best-in-class properties (Top 10%) command rates of $1,020+ per night, often due to premium features or locations.
- Strong performing properties (Top 25%) achieve nightly rates of $384 or more.
- Typical properties (Median) charge around $192 per night.
- Entry-level properties (Bottom 25%) earn around $136 per night.
Average Daily Rate (ADR) Trend by Month in St. Croix
Get Live St. Croix Market Intelligence 👇

Explore Real-time Analytics
Airbnb Seasonality Analysis & Trends in St. Croix (2025)
Peak Season (February, January, June)
- Revenue averages $6,525 per month
- Occupancy rates average 47.4%
- Daily rates average $374
Shoulder Season
- Revenue averages $5,134 per month
- Occupancy maintains around 37.6%
- Daily rates hold near $348
Low Season (March, September, October)
- Revenue drops to average $3,135 per month
- Occupancy decreases to average 30.9%
- Daily rates adjust to average $343
Seasonality Insights for St. Croix
- The Airbnb seasonality in St. Croix shows highly seasonal trends requiring careful strategy. While the sections above show seasonal averages, it's also insightful to look at the extremes:
- During the high season, the absolute peak month showcases St. Croix's highest earning potential, with monthly revenues capable of climbing to $7,189, occupancy reaching a high of 56.7%, and ADRs peaking at $408.
- Conversely, the slowest single month of the year, typically falling within the low season, marks the market's lowest point. In this month, revenue might dip to $2,405, occupancy could drop to 23.6%, and ADRs may adjust down to $318.
- Understanding both the seasonal averages and these monthly peaks and troughs in revenue, occupancy, and ADR is crucial for maximizing your Airbnb profit potential in St. Croix.
Seasonal Strategies for Maximizing Profit
- Peak Season: Maximize revenue through premium pricing and potentially longer minimum stays. Ensure high availability.
- Low Season: Offer competitive pricing, special promotions (e.g., extended stay discounts), and flexible cancellation policies. Target off-season travelers like remote workers or budget-conscious guests.
- Shoulder Seasons: Implement dynamic pricing that balances peak and low rates. Target weekend travelers or specific events. Offer slightly more flexible terms than peak season.
- Regularly analyze your own performance against these St. Croix seasonality benchmarks and adjust your pricing and availability strategy accordingly.
Best Areas for Airbnb Investment in St. Croix (2025)
Exploring the top neighborhoods for short-term rentals in St. Croix? This section highlights key areas, outlining why they are attractive for hosts and guests, along with notable local attractions. Consider these locations based on your target guest profile and investment strategy.
| Neighborhood / Area | Why Host Here? (Target Guests & Appeal) | Key Attractions & Landmarks |
|---|---|---|
| Christiansted | Historic town with charming colonial architecture, beautiful waterfront, and vibrant nightlife. A favorite for tourists exploring the island's culture and history. | Christiansted National Historic Site, Fort Christiansvaern, S_TEXT B_16 Shopping, Cruzan Rum Distillery, Danish West India Company Warehouse |
| Frederiksted | A rustic town known for its picturesque beaches and laid-back atmosphere. Offers stunning sunset views and access to various water sports. | Frederiksted Beach, Fort Frederik, Rainbow Beach, The Pier, Sandy Point National Wildlife Refuge |
| East End | Home to stunning beaches and luxury resorts, this area attracts visitors looking for relaxation and adventure with access to snorkeling and diving spots. | Higgins Beach, Cane Bay Beach, The Reef, Vitamin Sea |
| Coral Bay | Secluded and tranquil, Coral Bay is perfect for those wanting to escape the crowds and enjoy nature, popular for its local vibe and outdoor activities. | Salt Pond Bay, Drunk Bay, Coral Bay Marina, Kayak St. John |
| West End | Offers a more quiet experience with stunning natural beauty, great for those looking to enjoy the island's beaches away from the busier tourist spots. | The Baths, Devil's Bay, Chocolate Hole, Long Bay Beach |
| Salt River | Known for its natural beauty and history, Salt River offers opportunities for eco-tourism and adventure activities in a less commercialized setting. | Salt River Bay National Historical Park, Scuba diving, Wildlife watching, Snorkeling spots |
| North Shore | Famous for spectacular views and hiking trails, North Shore is perfect for outdoor enthusiasts wanting to explore the island's lush landscapes. | Catherineberg Ruins, Annaly Bay Tide Pools, Hiking trails, Cinnamon Bay |
| Buck Island | A must-visit destination for snorkeling and diving enthusiasts. The surrounding waters are protected and host a vibrant marine ecosystem. | Buck Island Reef National Monument, Snorkeling, Diving opportunities |
Understanding Airbnb License Requirements & STR Laws in St. Croix (2025)
While St. Croix, United States Virgin Islands, U.S. Virgin Islands currently shows low STR regulations, specific Airbnb license requirements might still exist or change. Always verify the latest short term rental regulations and Airbnb license requirements directly with local government authorities for St. Croix to ensure full compliance before hosting.
(Source: AirROI data, 2025, finding no licensed listings among those analyzed)
Top Performing Airbnb Properties in St. Croix (2025)
Benchmark your potential! Explore examples of top-performing Airbnb properties in St. Croixbased on Trailing Twelve Month (TTM) revenue. Analyze their characteristics, revenue, occupancy rate, and ADR to understand what drives success in this market.
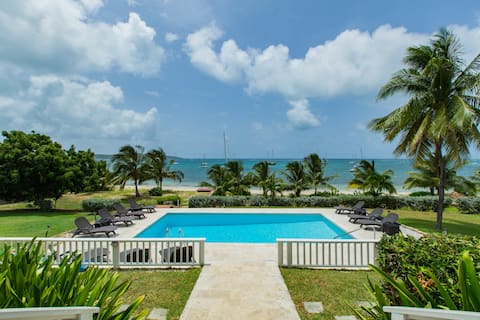
Beach House with Pool
Entire Place • 7 bedrooms
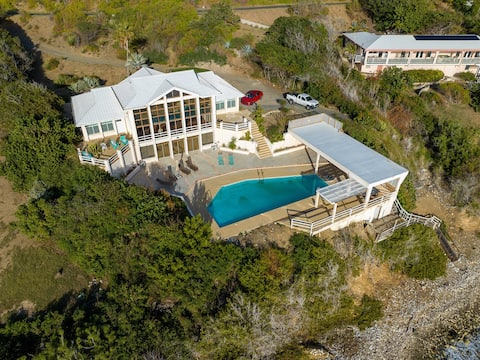
Sapala All - Oceanfront Villa with Private Pool
Entire Place • 5 bedrooms

Sugar Bay
Entire Place • 6 bedrooms
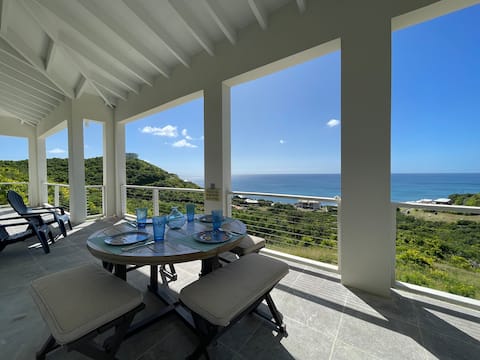
New 3br Home with Amazing View - East End
Entire Place • 3 bedrooms

Estate Lucky Bottom Cane Bay St Croix, USVI
Entire Place • 4 bedrooms

NEW Fully Renovated - Close to Beaches & Shopping!
Entire Place • 1 bedroom
Note: Performance varies based on location, size, amenities, seasonality, and management quality. Data reflects the past 12 months.
Top Performing Airbnb Hosts in St. Croix (2025)
Learn from the best! This table showcases top-performing Airbnb hosts in St. Croix based on the number of properties managed and estimated total revenue over the past year. Analyze their scale and performance metrics.
| Host Name | Properties | Grossing Revenue | Stay Reviews | Avg Rating |
|---|---|---|---|---|
| Robin | 2 | $338,483 | 47 | 4.59/5.0 |
| Karen | 3 | $210,282 | 28 | 2.88/5.0 |
| Justin | 1 | $94,401 | 18 | 5.00/5.0 |
| Donna | 1 | $91,943 | 7 | 4.86/5.0 |
| Kent | 6 | $62,811 | 42 | 4.98/5.0 |
| LEX Vacation Properties | 1 | $36,305 | 15 | 5.00/5.0 |
| Debbie | 1 | $34,435 | 17 | 5.00/5.0 |
| Melanie | 1 | $27,154 | 92 | 4.64/5.0 |
| Ginger | 2 | $24,556 | 57 | 4.82/5.0 |
| La-Toya And Jayanne | 1 | $19,320 | 32 | 4.75/5.0 |
Analyzing the strategies of top hosts, such as their property selection, pricing, and guest communication, can offer valuable lessons for optimizing your own Airbnb operations in St. Croix.
Dive Deeper: Advanced St. Croix STR Market Data (2025)
Ready to unlock more insights? AirROI provides access to advanced metrics and comprehensive Airbnb data for St. Croix. Explore detailed analytics beyond this report to refine your investment strategy, optimize pricing, and maximize your vacation rental profits.
Explore Advanced MetricsSt. Croix Short-Term Rental Market Composition (2025): Property & Room Types
Room Type Distribution
Property Type Distribution
Market Composition Insights for St. Croix
- The St. Croix Airbnb market composition is heavily skewed towards Entire Home/Apt listings, which make up 89.3% of the 28 active rentals. This indicates strong guest preference for privacy and space.
- Looking at the property type distribution in St. Croix, House properties are the most common (57.1%), reflecting the local real estate landscape.
- Houses represent a significant 57.1% portion, catering likely to families or larger groups.
- Smaller segments like hotel/boutique (combined 3.6%) offer potential for unique stay experiences.
St. Croix Airbnb Room Capacity Analysis (2025): Bedroom Distribution
Distribution of Listings by Number of Bedrooms
Room Capacity Insights for St. Croix
- The dominant room capacity in St. Croix is 1 bedroom listings, making up 42.9% of the market. This suggests a strong demand for properties suitable for couples or solo travelers.
- Together, 1 bedroom and 3 bedrooms properties represent 60.8% of the active Airbnb listings in St. Croix, indicating a high concentration in these sizes.
- A significant 39.3% of listings offer 3+ bedrooms, catering to larger groups and families seeking more space in St. Croix.
St. Croix Vacation Rental Guest Capacity Trends (2025)
Distribution of Listings by Guest Capacity
Guest Capacity Insights for St. Croix
- The most common guest capacity trend in St. Croix vacation rentals is listings accommodating 4 guests (42.9%). This suggests the primary traveler segment is likely small families or groups.
- Properties designed for 4 guests and 8+ guests dominate the St. Croix STR market, accounting for 67.9% of listings.
- 39.3% of properties accommodate 6+ guests, serving the market segment for larger families or group travel in St. Croix.
- On average, properties in St. Croix are equipped to host 5.2 guests.
St. Croix Airbnb Booking Patterns (2025): Available vs. Booked Days
Available Days Distribution
Booked Days Distribution
Booking Pattern Insights for St. Croix
- The most common availability pattern in St. Croix falls within the 271-366 days range, representing 50% of listings. This suggests many properties have significant open periods on their calendars.
- Approximately 82.1% of listings show high availability (181+ days open annually), indicating potential for increased bookings or specific owner usage patterns.
- For booked days, the 1-30 days range is most frequent in St. Croix (35.7%), reflecting common guest stay durations or potential owner blocking patterns.
- A notable 17.9% of properties secure long booking periods (181+ days booked per year), highlighting successful long-term rental strategies or significant owner usage.
St. Croix Airbnb Minimum Stay Requirements Analysis
Distribution of Listings by Minimum Night Requirement
1 Night
4 listings
14.3% of total
2 Nights
1 listings
3.6% of total
3 Nights
6 listings
21.4% of total
4-6 Nights
9 listings
32.1% of total
30+ Nights
8 listings
28.6% of total
Key Insights
- The most prevalent minimum stay requirement in St. Croix is 4-6 Nights, adopted by 32.1% of listings. This highlights the market's preference for longer commitments.
- Very short stays (1-2 nights) are less common (17.9%), suggesting hosts prefer slightly longer bookings to optimize turnover.
- A significant segment (28.6%) caters to monthly stays (30+ nights) in St. Croix, pointing to opportunities in the extended-stay market.
Recommendations
- Align with the market by considering a 4-6 Nights minimum stay, as 32.1% of St. Croix hosts use this setting.
- If feasible, allowing 1-night stays, especially midweek or during low season, could capture last-minute bookings, as only 14.3% currently do.
- Explore offering discounts for stays of 30+ nights to attract the 28.6% of the market seeking extended stays.
- Adjust minimum nights based on seasonality – potentially shorter during low season and longer during peak demand periods in St. Croix.
St. Croix Airbnb Cancellation Policy Trends Analysis (2025)
Flexible
6 listings
23.1% of total
Moderate
5 listings
19.2% of total
Firm
1 listings
3.8% of total
Strict
14 listings
53.8% of total
Cancellation Policy Insights for St. Croix
- The prevailing Airbnb cancellation policy trend in St. Croix is Strict, used by 53.8% of listings.
- A majority (57.6%) of hosts in St. Croix utilize Firm or Strict policies, indicating a market where hosts prioritize booking security.
Recommendations for Hosts
- Consider adopting a Strict policy to align with the 53.8% market standard in St. Croix.
- With 53.8% using Strict terms, this is a viable option in St. Croix, particularly for high-value properties or during peak demand periods.
- Regularly review your cancellation policy against competitors and market demand shifts in St. Croix.
St. Croix STR Booking Lead Time Analysis (2025)
Average Booking Lead Time by Month
Booking Lead Time Insights for St. Croix
- The overall average booking lead time for vacation rentals in St. Croix is 56 days.
- Guests book furthest in advance for stays during November (average 92 days), likely coinciding with peak travel demand or local events.
- The shortest booking windows occur for stays in August (average 37 days), indicating more last-minute travel plans during this time.
- Seasonally, Winter (73 days avg.) sees the longest lead times, while Summer (44 days avg.) has the shortest, reflecting typical travel planning cycles.
Recommendations for Hosts
- Use the overall average lead time (56 days) as a baseline for your pricing and availability strategy in St. Croix.
- For November stays, consider implementing length-of-stay discounts or slightly higher rates for bookings made less than 92 days out to capitalize on advance planning.
- Target marketing efforts for the Winter season well in advance (at least 73 days) to capture early planners.
- Monitor your own booking lead times against these St. Croix averages to identify opportunities for dynamic pricing adjustments.
Popular & Essential Airbnb Amenities in St. Croix (2025)
Amenity Prevalence
Amenity Insights for St. Croix
- Essential amenities in St. Croix that guests expect include: Wifi. Lacking these (this) could significantly impact bookings.
- Popular amenities like Kitchen, TV, Hangers are common but not universal. Offering these can provide a competitive edge.
Recommendations for Hosts
- Ensure your listing includes all essential amenities for St. Croix: Wifi.
- Consider adding popular differentiators like Kitchen or TV to increase appeal.
- Highlight unique or less common amenities you offer (e.g., hot tub, dedicated workspace, EV charger) in your listing description and photos.
- Regularly check competitor amenities in St. Croix to stay competitive.
St. Croix Airbnb Guest Demographics & Profile Analysis (2025)
Guest Profile Summary for St. Croix
- The typical guest profile for Airbnb in St. Croix consists of predominantly international visitors (97%), with top international origins including U.S. Virgin Islands, typically belonging to the Post-2000s (Gen Z/Alpha) group (50%), primarily speaking English or Spanish.
- Domestic travelers account for 3.3% of guests.
- Key international markets include United States (90.2%) and U.S. Virgin Islands (3.3%).
- Top languages spoken are English (65.9%) followed by Spanish (24.4%).
- A significant demographic segment is the Post-2000s (Gen Z/Alpha) group, representing 50% of guests.
Recommendations for Hosts
- Focus marketing internationally, particularly towards travelers from U.S. Virgin Islands.
- Tailor amenities and listing descriptions to appeal to the dominant Post-2000s (Gen Z/Alpha) demographic (e.g., highlight fast WiFi, smart home features, local guides).
- Highlight unique local experiences or amenities relevant to the primary guest profile.
- Consider seasonal promotions aligned with peak travel times for key origin markets.
Nearby Short-Term Rental Market Comparison
How does the St. Croix Airbnb market stack up against its neighbors? Compare key performance metrics like average monthly revenue, ADR, and occupancy rates in surrounding areas to understand the broader regional STR landscape.
| Market | Active Properties | Monthly Revenue | Daily Rate | Avg. Occupancy |
|---|---|---|---|---|
| Buck Island | 14 | $9,544 | $2582.84 | 22% |
| Cruz Bay | 14 | $7,013 | $619.90 | 52% |
| Central | 17 | $6,787 | $1102.16 | 46% |
| Fortuna | 12 | $5,931 | $291.01 | 54% |
| Simpson Bay | 48 | $5,549 | $506.49 | 43% |
| Coral Harbour | 162 | $5,244 | $446.89 | 51% |
| Cruz Bay | 404 | $4,994 | $561.57 | 43% |
| Long Bay Village | 25 | $4,235 | $666.52 | 33% |
| Road Town | 212 | $4,219 | $476.08 | 40% |
| West End Village | 18 | $4,213 | $584.42 | 41% |