Entebbe City Airbnb Market Analysis 2026: Short Term Rental Data & Vacation Rental Statistics in Central Region, Uganda
Is Airbnb profitable in Entebbe City in 2026? Explore comprehensive Airbnb analytics for Entebbe City, Central Region, Uganda to uncover income potential. This 2026 STR market report for Entebbe City, based on AirROI data from February 2025 to January 2026, reveals key trends in the niche market of 148 active listings.
Whether you're considering an Airbnb investment in Entebbe City, optimizing your existing vacation rental, or exploring rental arbitrage opportunities, understanding the Entebbe City Airbnb data is crucial. Leveraging the low regulation environment is key to maximizing your short term rental income potential. Let's dive into the specifics.
Key Entebbe City Airbnb Performance Metrics Overview
Monthly Airbnb Revenue Variations & Income Potential in Entebbe City (2026)
Understanding the monthly revenue variations for Airbnb listings in Entebbe City is key to maximizing your short term rental income potential. Seasonality significantly impacts earnings. Our analysis, based on data from the past 12 months, shows that the peak revenue month for STRs in Entebbe City is typically August, while June often presents the lowest earnings, highlighting opportunities for strategic pricing adjustments during shoulder and low seasons. Explore the typical Airbnb income in Entebbe City across different performance tiers:
- Best-in-class properties (Top 10%) achieve $1,026+ monthly, often utilizing dynamic pricing and superior guest experiences.
- Strong performing properties (Top 25%) earn $669 or more, indicating effective management and desirable locations/amenities.
- Typical properties (Median) generate around $340 per month, representing the average market performance.
- Entry-level properties (Bottom 25%) see earnings around $151, often with potential for optimization.
Average Monthly Airbnb Earnings Trend in Entebbe City
Entebbe City Airbnb Occupancy Rate Trends (2026)
Maximize your bookings by understanding the Entebbe City STR occupancy trends. Seasonal demand shifts significantly influence how often properties are booked. Typically, Augustsees the highest demand (peak season occupancy), while June experiences the lowest (low season). Effective strategies, like adjusting minimum stays or offering promotions, can boost occupancy during slower periods. Here's how different property tiers perform in Entebbe City:
- Best-in-class properties (Top 10%) achieve 67%+ occupancy, indicating high desirability and potentially optimized availability.
- Strong performing properties (Top 25%) maintain 44% or higher occupancy, suggesting good market fit and guest satisfaction.
- Typical properties (Median) have an occupancy rate around 24%.
- Entry-level properties (Bottom 25%) average 11% occupancy, potentially facing higher vacancy.
Average Monthly Occupancy Rate Trend in Entebbe City
Average Daily Rate (ADR) Airbnb Trends in Entebbe City (2026)
Effective short term rental pricing strategy in Entebbe City involves understanding monthly ADR fluctuations. The Average Daily Rate (ADR) for Airbnb in Entebbe City typically peaks in December and dips lowest during March. Leveraging Airbnb dynamic pricing tools or strategies based on this seasonality can significantly boost revenue. Here's a look at the typical nightly rates achieved:
- Best-in-class properties (Top 10%) command rates of $86+ per night, often due to premium features or locations.
- Strong performing properties (Top 25%) achieve nightly rates of $60 or more.
- Typical properties (Median) charge around $44 per night.
- Entry-level properties (Bottom 25%) earn around $31 per night.
Average Daily Rate (ADR) Trend by Month in Entebbe City
Get Live Entebbe City Market Intelligence 👇

Explore Real-time Analytics
Airbnb Seasonality Analysis & Trends in Entebbe City (2026)
Peak Season (August, July, October)
- Revenue averages $560 per month
- Occupancy rates average 34.1%
- Daily rates average $51
Shoulder Season
- Revenue averages $467 per month
- Occupancy maintains around 31.0%
- Daily rates hold near $51
Low Season (January, May, June)
- Revenue drops to average $384 per month
- Occupancy decreases to average 25.4%
- Daily rates adjust to average $51
Seasonality Insights for Entebbe City
- The Airbnb seasonality in Entebbe City shows moderate seasonality with distinct peak and low periods. While the sections above show seasonal averages, it's also insightful to look at the extremes:
- During the high season, the absolute peak month showcases Entebbe City's highest earning potential, with monthly revenues capable of climbing to $570, occupancy reaching a high of 37.1%, and ADRs peaking at $52.
- Conversely, the slowest single month of the year, typically falling within the low season, marks the market's lowest point. In this month, revenue might dip to $372, occupancy could drop to 24.0%, and ADRs may adjust down to $50.
- Understanding both the seasonal averages and these monthly peaks and troughs in revenue, occupancy, and ADR is crucial for maximizing your Airbnb profit potential in Entebbe City.
Seasonal Strategies for Maximizing Profit
- Peak Season: Maximize revenue through premium pricing and potentially longer minimum stays. Ensure high availability.
- Low Season: Offer competitive pricing, special promotions (e.g., extended stay discounts), and flexible cancellation policies. Target off-season travelers like remote workers or budget-conscious guests.
- Shoulder Seasons: Implement dynamic pricing that balances peak and low rates. Target weekend travelers or specific events. Offer slightly more flexible terms than peak season.
- Regularly analyze your own performance against these Entebbe City seasonality benchmarks and adjust your pricing and availability strategy accordingly.
Best Areas for Airbnb Investment in Entebbe City (2026)
Exploring the top neighborhoods for short-term rentals in Entebbe City? This section highlights key areas, outlining why they are attractive for hosts and guests, along with notable local attractions. Consider these locations based on your target guest profile and investment strategy.
| Neighborhood / Area | Why Host Here? (Target Guests & Appeal) | Key Attractions & Landmarks |
|---|---|---|
| Lido Beach | A popular seaside area known for its beautiful sandy beaches and proximity to local attractions. Ideal for tourists looking to relax by the water and enjoy water sports. | Lido Beach, Entebbe Botanical Gardens, Lake Victoria, Amani Beach |
| Entebbe Town Center | The bustling heart of Entebbe, filled with shops, restaurants, and local markets. Great for travelers wanting to experience local culture and convenience. | Entebbe Central Market, Craft Village, Uganda Wildlife Education Center, Imperial Resort Beach |
| Nambi Road | A family-friendly neighborhood with a mix of residential and tourist accommodations. Close to several local amenities and parks, making it appealing for families. | Entebbe Zoo, Ngamba Island Chimpanzee Sanctuary, Waterfront Beach |
| Kasenyi | A quieter area near the shore of Lake Victoria, with beautiful views and a relaxing atmosphere. Perfect for those seeking a peaceful getaway. | Kasenyi Beach, Fishing on Lake Victoria, Bird Watching |
| Sojet | An upcoming neighborhood with growing infrastructure and potential for investment. Attractive for those looking for more affordable options without sacrificing accessibility. | Local eateries, Entebbe Wildlife Reserve |
| Ugfarm City | A developing urban area with various new investments and community engagements. It is poised to become a key location for business and tourism. | Local cultural events, Community markets |
| Banga | A scenic suburb known for its tranquility and natural surroundings. Ideal for eco-friendly stays and retreats away from the city hustle. | Nature walks, Bird watching, Lake views |
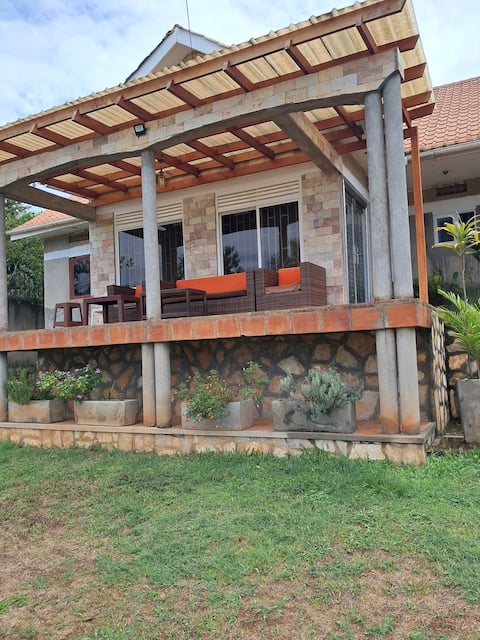
| Bugonga | Proximity to Entebbe International Airport makes this an ideal location for short-term rentals catering to business travelers and those in transit. | Entebbe International Airport, Airport Shopping Center, Local dining options |
Understanding Airbnb License Requirements & STR Laws in Entebbe City (2026)
While Entebbe City, Central Region, Uganda currently shows low STR regulations, specific Airbnb license requirements might still exist or change. Always verify the latest short term rental regulations and Airbnb license requirements directly with local government authorities for Entebbe City to ensure full compliance before hosting.
(Source: AirROI data, 2026, finding no licensed listings among those analyzed)
Top Performing Airbnb Properties in Entebbe City (2026)
Benchmark your potential! Explore examples of top-performing Airbnb properties in Entebbe Citybased on Trailing Twelve Month (TTM) revenue. Analyze their characteristics, revenue, occupancy rate, and ADR to understand what drives success in this market.

3 Bedroom Penthouse Near Airport
Entire Place • 3 bedrooms

Your own House at amazing Villa Bugonga, Entebbe
Entire Place • 2 bedrooms
Serene Home
Entire Place • 3 bedrooms
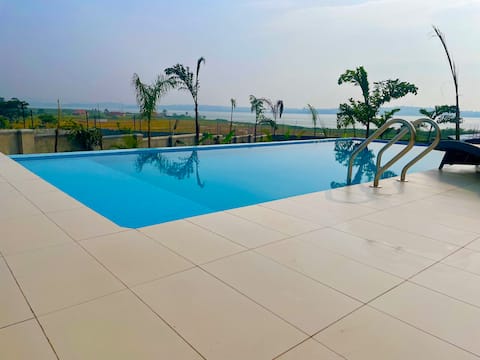
Infinity Pool Villas airport pick up private pool
Entire Place • 4 bedrooms
Exquisite 4Bed 4.5Bath Lake View Home!
Entire Place • 4 bedrooms

Spacious greenery hideout with botanical view
Entire Place • 2 bedrooms
Note: Performance varies based on location, size, amenities, seasonality, and management quality. Data reflects the past 12 months.
Top Performing Airbnb Hosts in Entebbe City (2026)
Learn from the best! This table showcases top-performing Airbnb hosts in Entebbe City based on the number of properties managed and estimated total revenue over the past year. Analyze their scale and performance metrics.
| Host Name | Properties | Grossing Revenue | Stay Reviews | Avg Rating |
|---|---|---|---|---|
| Dan | 3 | $26,263 | 74 | 4.89/5.0 |
| Ruth Pamella | 4 | $24,669 | 149 | 4.59/5.0 |
| Sharon | 2 | $23,231 | 215 | 4.87/5.0 |
| Madrine | 3 | $22,935 | 33 | 4.80/5.0 |
| Paul | 4 | $18,219 | 32 | 4.67/5.0 |
| Mbabazi | 3 | $14,624 | 56 | 4.81/5.0 |
| Hellen | 1 | $13,667 | 66 | 4.92/5.0 |
| David | 1 | $13,412 | 19 | 4.74/5.0 |
| Rebecca | 2 | $12,937 | 85 | 4.78/5.0 |
| Dutus | 4 | $12,847 | 85 | 4.66/5.0 |
Analyzing the strategies of top hosts, such as their property selection, pricing, and guest communication, can offer valuable lessons for optimizing your own Airbnb operations in Entebbe City.
Dive Deeper: Advanced Entebbe City STR Market Data (2026)
Ready to unlock more insights? AirROI provides access to advanced metrics and comprehensive Airbnb data for Entebbe City. Explore detailed analytics beyond this report to refine your investment strategy, optimize pricing, and maximize your vacation rental profits.
Explore Advanced MetricsEntebbe City Short-Term Rental Market Composition (2026): Property & Room Types
Room Type Distribution
Property Type Distribution
Market Composition Insights for Entebbe City
- The Entebbe City Airbnb market composition is heavily skewed towards Entire Home/Apt listings, which make up 81.8% of the 148 active rentals. This indicates strong guest preference for privacy and space.
- Looking at the property type distribution in Entebbe City, Apartment/Condo properties are the most common (47.3%), reflecting the local real estate landscape.
- Houses represent a significant 42.6% portion, catering likely to families or larger groups.
- The presence of 8.8% Hotel/Boutique listings indicates integration with traditional hospitality.
- Smaller segments like others (combined 1.4%) offer potential for unique stay experiences.
Entebbe City Airbnb Room Capacity Analysis (2026): Bedroom Distribution
Distribution of Listings by Number of Bedrooms
Room Capacity Insights for Entebbe City
- The dominant room capacity in Entebbe City is 2 bedrooms listings, making up 39.2% of the market. This suggests a strong demand for properties suitable for couples or solo travelers.
- Together, 2 bedrooms and 1 bedroom properties represent 68.3% of the active Airbnb listings in Entebbe City, indicating a high concentration in these sizes.
- A significant 27.0% of listings offer 3+ bedrooms, catering to larger groups and families seeking more space in Entebbe City.
Entebbe City Vacation Rental Guest Capacity Trends (2026)
Distribution of Listings by Guest Capacity
Guest Capacity Insights for Entebbe City
- The most common guest capacity trend in Entebbe City vacation rentals is listings accommodating 4 guests (30.4%). This suggests the primary traveler segment is likely small families or groups.
- Properties designed for 4 guests and 2 guests dominate the Entebbe City STR market, accounting for 59.5% of listings.
- 19.6% of properties accommodate 6+ guests, serving the market segment for larger families or group travel in Entebbe City.
- On average, properties in Entebbe City are equipped to host 3.5 guests.
Entebbe City Airbnb Booking Patterns (2026): Available vs. Booked Days
Available Days Distribution
Booked Days Distribution
Booking Pattern Insights for Entebbe City
- The most common availability pattern in Entebbe City falls within the 271-366 days range, representing 73.6% of listings. This suggests many properties have significant open periods on their calendars.
- Approximately 95.2% of listings show high availability (181+ days open annually), indicating potential for increased bookings or specific owner usage patterns.
- For booked days, the 1-30 days range is most frequent in Entebbe City (42.6%), reflecting common guest stay durations or potential owner blocking patterns.
- A notable 5.4% of properties secure long booking periods (181+ days booked per year), highlighting successful long-term rental strategies or significant owner usage.
Entebbe City Airbnb Minimum Stay Requirements Analysis
Distribution of Listings by Minimum Night Requirement
1 Night
97 listings
65.5% of total
2 Nights
19 listings
12.8% of total
3 Nights
5 listings
3.4% of total
4-6 Nights
4 listings
2.7% of total
7-29 Nights
4 listings
2.7% of total
30+ Nights
19 listings
12.8% of total
Key Insights
- The most prevalent minimum stay requirement in Entebbe City is 1 Night, adopted by 65.5% of listings. This highlights the market's preference for shorter, flexible bookings.
- A strong majority (78.3%) of the Entebbe City Airbnb data shows acceptance of very short stays (1-2 nights), indicating a dynamic, high-turnover market.
- A significant segment (12.8%) caters to monthly stays (30+ nights) in Entebbe City, pointing to opportunities in the extended-stay market.
Recommendations
- Align with the market by considering a 1 Night minimum stay, as 65.5% of Entebbe City hosts use this setting.
- Explore offering discounts for stays of 30+ nights to attract the 12.8% of the market seeking extended stays.
- Adjust minimum nights based on seasonality – potentially shorter during low season and longer during peak demand periods in Entebbe City.
Entebbe City Airbnb Cancellation Policy Trends Analysis (2026)
Limited
2 listings
1.4% of total
Flexible
100 listings
67.6% of total
Moderate
32 listings
21.6% of total
Firm
14 listings
9.5% of total
Cancellation Policy Insights for Entebbe City
- The prevailing Airbnb cancellation policy trend in Entebbe City is Flexible, used by 67.6% of listings.
- The market strongly favors guest-friendly terms, with 89.2% of listings offering Flexible or Moderate policies. This suggests guests in Entebbe City may expect booking flexibility.
Recommendations for Hosts
- Consider adopting a Flexible policy to align with the 67.6% market standard in Entebbe City.
- Given the high prevalence of Flexible policies (67.6%), offering this can enhance booking appeal, especially during shoulder seasons.
- Regularly review your cancellation policy against competitors and market demand shifts in Entebbe City.
Entebbe City STR Booking Lead Time Analysis (2026)
Average Booking Lead Time by Month
Booking Lead Time Insights for Entebbe City
- The overall average booking lead time for vacation rentals in Entebbe City is 20 days.
- Guests book furthest in advance for stays during January (average 27 days), likely coinciding with peak travel demand or local events.
- The shortest booking windows occur for stays in March (average 13 days), indicating more last-minute travel plans during this time.
- Seasonally, Summer (23 days avg.) sees the longest lead times, while Spring (19 days avg.) has the shortest, reflecting typical travel planning cycles.
Recommendations for Hosts
- Use the overall average lead time (20 days) as a baseline for your pricing and availability strategy in Entebbe City.
- Target marketing efforts for the Summer season well in advance (at least 23 days) to capture early planners.
- Monitor your own booking lead times against these Entebbe City averages to identify opportunities for dynamic pricing adjustments.
Popular & Essential Airbnb Amenities in Entebbe City (2026)
Amenity Prevalence
Amenity Insights for Entebbe City
- Essential amenities in Entebbe City that guests expect include: Free parking on premises, Wifi. Lacking these (any) could significantly impact bookings.
- Popular amenities like Kitchen, TV, Iron are common but not universal. Offering these can provide a competitive edge.
Recommendations for Hosts
- Ensure your listing includes all essential amenities for Entebbe City: Free parking on premises, Wifi.
- Prioritize adding missing essentials: Free parking on premises, Wifi.
- Consider adding popular differentiators like Kitchen or TV to increase appeal.
- Highlight unique or less common amenities you offer (e.g., hot tub, dedicated workspace, EV charger) in your listing description and photos.
- Regularly check competitor amenities in Entebbe City to stay competitive.
Entebbe City Airbnb Guest Demographics & Profile Analysis (2026)
Guest Profile Summary for Entebbe City
- The typical guest profile for Airbnb in Entebbe City consists of predominantly international visitors (82%), with top international origins including Uganda, typically belonging to the Post-2000s (Gen Z/Alpha) group (50%), primarily speaking English or French.
- Domestic travelers account for 18.0% of guests.
- Key international markets include United States (28.7%) and Uganda (18%).
- Top languages spoken are English (53.2%) followed by French (11.3%).
- A significant demographic segment is the Post-2000s (Gen Z/Alpha) group, representing 50% of guests.
Recommendations for Hosts
- Focus marketing internationally, particularly towards travelers from Uganda.
- Tailor amenities and listing descriptions to appeal to the dominant Post-2000s (Gen Z/Alpha) demographic (e.g., highlight fast WiFi, smart home features, local guides).
- Highlight unique local experiences or amenities relevant to the primary guest profile.
- Consider seasonal promotions aligned with peak travel times for key origin markets.
Nearby Short-Term Rental Market Comparison
How does the Entebbe City Airbnb market stack up against its neighbors? Compare key performance metrics like average monthly revenue, ADR, and occupancy rates in surrounding areas to understand the broader regional STR landscape.
| Market | Active Properties | Monthly Revenue | Daily Rate | Avg. Occupancy |
|---|---|---|---|---|
| Jinja | 51 | $400 | $73.14 | 25% |
| Jinja City | 17 | $340 | $65.84 | 26% |
| Naalya Estate Village | 18 | $246 | $51.82 | 37% |
| Kampala | 792 | $244 | $49.50 | 31% |
| Kira | 46 | $195 | $37.08 | 29% |
| Naalya Estate | 15 | $184 | $38.67 | 29% |
| Entebbe | 22 | $124 | $45.45 | 24% |
| Najeera Bulabira | 11 | $121 | $31.12 | 24% |