Dubai Airbnb Market Analysis 2026: Short Term Rental Data & Vacation Rental Statistics in Dubai, United Arab Emirates
Is Airbnb profitable in Dubai in 2026? Explore comprehensive Airbnb analytics for Dubai, Dubai, United Arab Emirates to uncover income potential. This 2026 STR market report for Dubai, based on AirROI data from February 2025 to January 2026, reveals key trends in the bustling market of 15,275 active listings.
Whether you're considering an Airbnb investment in Dubai, optimizing your existing vacation rental, or exploring rental arbitrage opportunities, understanding the Dubai Airbnb data is crucial. Navigating the high regulation landscape is key to maximizing your short term rental income potential. Let's dive into the specifics.
Key Dubai Airbnb Performance Metrics Overview
Monthly Airbnb Revenue Variations & Income Potential in Dubai (2026)
Understanding the monthly revenue variations for Airbnb listings in Dubai is key to maximizing your short term rental income potential. Seasonality significantly impacts earnings. Our analysis, based on data from the past 12 months, shows that the peak revenue month for STRs in Dubai is typically December, while August often presents the lowest earnings, highlighting opportunities for strategic pricing adjustments during shoulder and low seasons. Explore the typical Airbnb income in Dubai across different performance tiers:
- Best-in-class properties (Top 10%) achieve $7,879+ monthly, often utilizing dynamic pricing and superior guest experiences.
- Strong performing properties (Top 25%) earn $4,938 or more, indicating effective management and desirable locations/amenities.
- Typical properties (Median) generate around $2,771 per month, representing the average market performance.
- Entry-level properties (Bottom 25%) see earnings around $1,301, often with potential for optimization.
Average Monthly Airbnb Earnings Trend in Dubai
Dubai Airbnb Occupancy Rate Trends (2026)
Maximize your bookings by understanding the Dubai STR occupancy trends. Seasonal demand shifts significantly influence how often properties are booked. Typically, Februarysees the highest demand (peak season occupancy), while May experiences the lowest (low season). Effective strategies, like adjusting minimum stays or offering promotions, can boost occupancy during slower periods. Here's how different property tiers perform in Dubai:
- Best-in-class properties (Top 10%) achieve 87%+ occupancy, indicating high desirability and potentially optimized availability.
- Strong performing properties (Top 25%) maintain 73% or higher occupancy, suggesting good market fit and guest satisfaction.
- Typical properties (Median) have an occupancy rate around 46%.
- Entry-level properties (Bottom 25%) average 21% occupancy, potentially facing higher vacancy.
Average Monthly Occupancy Rate Trend in Dubai
Average Daily Rate (ADR) Airbnb Trends in Dubai (2026)
Effective short term rental pricing strategy in Dubai involves understanding monthly ADR fluctuations. The Average Daily Rate (ADR) for Airbnb in Dubai typically peaks in December and dips lowest during August. Leveraging Airbnb dynamic pricing tools or strategies based on this seasonality can significantly boost revenue. Here's a look at the typical nightly rates achieved:
- Best-in-class properties (Top 10%) command rates of $486+ per night, often due to premium features or locations.
- Strong performing properties (Top 25%) achieve nightly rates of $304 or more.
- Typical properties (Median) charge around $192 per night.
- Entry-level properties (Bottom 25%) earn around $125 per night.
Average Daily Rate (ADR) Trend by Month in Dubai
Get Live Dubai Market Intelligence 👇

Explore Real-time Analytics
Airbnb Seasonality Analysis & Trends in Dubai (2026)
Peak Season (December, February, April)
- Revenue averages $5,151 per month
- Occupancy rates average 54.9%
- Daily rates average $298
Shoulder Season
- Revenue averages $3,803 per month
- Occupancy maintains around 45.9%
- Daily rates hold near $279
Low Season (June, July, August)
- Revenue drops to average $2,390 per month
- Occupancy decreases to average 43.3%
- Daily rates adjust to average $218
Seasonality Insights for Dubai
- The Airbnb seasonality in Dubai shows highly seasonal trends requiring careful strategy. While the sections above show seasonal averages, it's also insightful to look at the extremes:
- During the high season, the absolute peak month showcases Dubai's highest earning potential, with monthly revenues capable of climbing to $5,468, occupancy reaching a high of 60.0%, and ADRs peaking at $378.
- Conversely, the slowest single month of the year, typically falling within the low season, marks the market's lowest point. In this month, revenue might dip to $2,301, occupancy could drop to 38.9%, and ADRs may adjust down to $212.
- Understanding both the seasonal averages and these monthly peaks and troughs in revenue, occupancy, and ADR is crucial for maximizing your Airbnb profit potential in Dubai.
Seasonal Strategies for Maximizing Profit
- Peak Season: Maximize revenue through premium pricing and potentially longer minimum stays. Ensure high availability.
- Low Season: Offer competitive pricing, special promotions (e.g., extended stay discounts), and flexible cancellation policies. Target off-season travelers like remote workers or budget-conscious guests.
- Shoulder Seasons: Implement dynamic pricing that balances peak and low rates. Target weekend travelers or specific events. Offer slightly more flexible terms than peak season.
- Regularly analyze your own performance against these Dubai seasonality benchmarks and adjust your pricing and availability strategy accordingly.
Best Areas for Airbnb Investment in Dubai (2026)
Exploring the top neighborhoods for short-term rentals in Dubai? This section highlights key areas, outlining why they are attractive for hosts and guests, along with notable local attractions. Consider these locations based on your target guest profile and investment strategy.
| Neighborhood / Area | Why Host Here? (Target Guests & Appeal) | Key Attractions & Landmarks |
|---|---|---|
| Downtown Dubai | Home to iconic landmarks like the Burj Khalifa and the Dubai Mall. It offers a luxurious urban experience with easy access to dining, shopping, and entertainment. | Burj Khalifa, Dubai Mall, Dubai Fountain, Dubai Opera, Souk Al Bahar |
| Dubai Marina | A vibrant waterfront community with stunning views, luxury apartments, and a lively nightlife. Popular among tourists and expats. | Dubai Marina Walk, JBR Beach, The Walk at JBR, Skydive Dubai, Ain Dubai |
| Jumeirah Beach Residence (JBR) | A bustling beachside district with luxury hotels and resort-style amenities. Ideal for beach lovers and families looking for fun by the sea. | JBR Beach, The Beach Mall, Ain Dubai, Dubai Water Adventure Park, JBR Walk |
| Palm Jumeirah | An iconic man-made island known for luxurious villas and beach resorts. Attracts tourists looking for an upscale getaway with stunning sea views. | Atlantis The Palm, The Pointe, Lost Chambers Aquarium, Aquaventure Waterpark, Palm Monorail |
| Al Fahidi Historical Neighborhood | A glimpse into Dubai's history and culture with well-preserved traditional buildings. Attracts tourists interested in heritage and art. | Dubai Museum, Al Fahidi Fort, Sheikh Mohammed Centre for Cultural Understanding, Art galleries, The Coffee Museum |
| Dubai Healthcare City | A hub for medical tourists and healthcare professionals. Attractive to visitors seeking healthcare and wellness services. | Dubai Health Authority, Medcare Hospital, Bangladesh Medical College, Health clinics, Wellness centers |
| Bur Dubai | Rich in culture and history, with a mix of modern and traditional experiences. Great for tourists looking for an authentic Dubai experience. | Dubai Creek, Dubai Gold Souk, Textile Souk, Al Seef, Museum of Illusions |
| City Walk | An upscale urban area that combines shopping, dining, and entertainment. Popular for its chic atmosphere and family-friendly options. | CityWalk Mall, Hub Zero, Roxy Cinemas, The Green Planet, Kidzania |
Understanding Airbnb License Requirements & STR Laws in Dubai (2026)
Yes, Dubai, Dubai, United Arab Emirates enforces high STR regulations. Obtaining a license and ensuring compliance is almost certainly required according to current 2026 STR laws. Always verify the latest short term rental regulations and Airbnb license requirements directly with local government authorities for Dubai to ensure full compliance before hosting.
(Source: AirROI data, 2026, based on 87% licensed listings)
Top Performing Airbnb Properties in Dubai (2026)
Benchmark your potential! Explore examples of top-performing Airbnb properties in Dubaibased on Trailing Twelve Month (TTM) revenue. Analyze their characteristics, revenue, occupancy rate, and ADR to understand what drives success in this market.
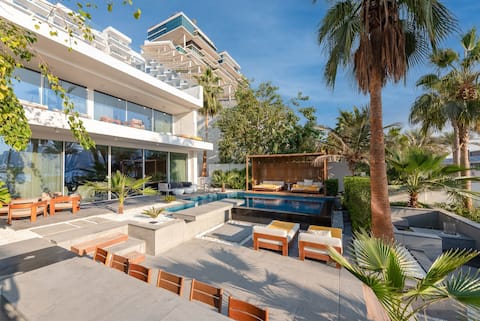
FIVE Palm Beachfront Villa -Private Pool & Jacuzzi
Entire Place • 5 bedrooms

Ultra-Luxury Villa w/ Private Pool & Beach on Palm
Entire Place • 5 bedrooms

Resthouse-type Beachfront 6BR Villa w/ Own Pool
Entire Place • 7 bedrooms

Beachfront 6BR Villa w/ Private Pool at the Palm
Entire Place • 7 bedrooms

FIVE Palm Beach Villa -Pool & Jacuzzi, 3-Level
Entire Place • 5 bedrooms

Villa on Beach w/ Private Pool The Palm Jumeirah
Entire Place • 6 bedrooms
Note: Performance varies based on location, size, amenities, seasonality, and management quality. Data reflects the past 12 months.
Top Performing Airbnb Hosts in Dubai (2026)
Learn from the best! This table showcases top-performing Airbnb hosts in Dubai based on the number of properties managed and estimated total revenue over the past year. Analyze their scale and performance metrics.
| Host Name | Properties | Grossing Revenue | Stay Reviews | Avg Rating |
|---|---|---|---|---|
| Deluxe Holiday Homes | 591 | $12,845,831 | 3906 | 4.24/5.0 |
| First Class | 157 | $9,211,792 | 4993 | 4.89/5.0 |
| Vacationer | 315 | $9,010,275 | 3355 | 4.80/5.0 |
| LUX Holiday Home | 130 | $7,641,526 | 3216 | 4.80/5.0 |
| Irina GoodStay | 112 | $7,339,456 | 4724 | 4.86/5.0 |
| Mint Stay | 127 | $6,998,103 | 1630 | 4.79/5.0 |
| First Class | 165 | $6,924,515 | 5763 | 4.85/5.0 |
| Suiteable | 177 | $6,175,753 | 2756 | 4.66/5.0 |
| Elite Royal Apartments | 46 | $4,801,401 | 2535 | 4.69/5.0 |
| Paul | 44 | $4,529,191 | 738 | 4.85/5.0 |
Analyzing the strategies of top hosts, such as their property selection, pricing, and guest communication, can offer valuable lessons for optimizing your own Airbnb operations in Dubai.
Dive Deeper: Advanced Dubai STR Market Data (2026)
Ready to unlock more insights? AirROI provides access to advanced metrics and comprehensive Airbnb data for Dubai. Explore detailed analytics beyond this report to refine your investment strategy, optimize pricing, and maximize your vacation rental profits.
Explore Advanced MetricsDubai Short-Term Rental Market Composition (2026): Property & Room Types
Room Type Distribution
Property Type Distribution
Market Composition Insights for Dubai
- The Dubai Airbnb market composition is heavily skewed towards Entire Home/Apt listings, which make up 97% of the 15,275 active rentals. This indicates strong guest preference for privacy and space.
- Looking at the property type distribution in Dubai, Apartment/Condo properties are the most common (95.5%), reflecting the local real estate landscape.
- Smaller segments like house, hotel/boutique, others (combined 4.5%) offer potential for unique stay experiences.
Dubai Airbnb Room Capacity Analysis (2026): Bedroom Distribution
Distribution of Listings by Number of Bedrooms
Room Capacity Insights for Dubai
- The dominant room capacity in Dubai is 1 bedroom listings, making up 51% of the market. This suggests a strong demand for properties suitable for couples or solo travelers.
- Together, 1 bedroom and 2 bedrooms properties represent 76.3% of the active Airbnb listings in Dubai, indicating a high concentration in these sizes.
- With over half the market (51%) consisting of studios or 1-bedroom units, Dubai is particularly well-suited for individuals or couples.
Dubai Vacation Rental Guest Capacity Trends (2026)
Distribution of Listings by Guest Capacity
Guest Capacity Insights for Dubai
- The most common guest capacity trend in Dubai vacation rentals is listings accommodating 2 guests (35%). This suggests the primary traveler segment is likely couples or solo travelers.
- Properties designed for 2 guests and 4 guests dominate the Dubai STR market, accounting for 60.2% of listings.
- 17.7% of properties accommodate 6+ guests, serving the market segment for larger families or group travel in Dubai.
- On average, properties in Dubai are equipped to host 3.7 guests.
Dubai Airbnb Booking Patterns (2026): Available vs. Booked Days
Available Days Distribution
Booked Days Distribution
Booking Pattern Insights for Dubai
- The most common availability pattern in Dubai falls within the 271-366 days range, representing 52.3% of listings. This suggests many properties have significant open periods on their calendars.
- Approximately 82.6% of listings show high availability (181+ days open annually), indicating potential for increased bookings or specific owner usage patterns.
- For booked days, the 91-180 days range is most frequent in Dubai (31.1%), reflecting common guest stay durations or potential owner blocking patterns.
- A notable 18.3% of properties secure long booking periods (181+ days booked per year), highlighting successful long-term rental strategies or significant owner usage.
Dubai Airbnb Minimum Stay Requirements Analysis
Distribution of Listings by Minimum Night Requirement
1 Night
3083 listings
20.2% of total
2 Nights
2379 listings
15.6% of total
3 Nights
1020 listings
6.7% of total
4-6 Nights
1291 listings
8.5% of total
7-29 Nights
1088 listings
7.1% of total
30+ Nights
6407 listings
42% of total
Key Insights
- The most prevalent minimum stay requirement in Dubai is 30+ Nights, adopted by 42% of listings. This highlights the market's preference for longer commitments.
- A significant segment (42%) caters to monthly stays (30+ nights) in Dubai, pointing to opportunities in the extended-stay market.
Recommendations
- Align with the market by considering a 30+ Nights minimum stay, as 42% of Dubai hosts use this setting.
- If feasible, allowing 1-night stays, especially midweek or during low season, could capture last-minute bookings, as only 20.2% currently do.
- Explore offering discounts for stays of 30+ nights to attract the 42% of the market seeking extended stays.
- Adjust minimum nights based on seasonality – potentially shorter during low season and longer during peak demand periods in Dubai.
Dubai Airbnb Cancellation Policy Trends Analysis (2026)
Limited
436 listings
2.9% of total
Refundable
2 listings
0% of total
Super Strict 30 Days
496 listings
3.3% of total
Super Strict 60 Days
833 listings
5.5% of total
Non-refundable
2 listings
0% of total
Flexible
1939 listings
12.8% of total
Moderate
4922 listings
32.6% of total
Firm
4598 listings
30.4% of total
Strict
1890 listings
12.5% of total
Cancellation Policy Insights for Dubai
- The prevailing Airbnb cancellation policy trend in Dubai is Moderate, used by 32.6% of listings.
- There's a relatively balanced mix between guest-friendly (45.4%) and stricter (42.9%) policies, offering choices for different guest needs.
Recommendations for Hosts
- Consider adopting a Moderate policy to align with the 32.6% market standard in Dubai.
- Using a Strict policy might deter some guests, as only 12.5% of listings use it. Evaluate if potential revenue protection outweighs possible lower booking rates.
- Regularly review your cancellation policy against competitors and market demand shifts in Dubai.
Dubai STR Booking Lead Time Analysis (2026)
Average Booking Lead Time by Month
Booking Lead Time Insights for Dubai
- The overall average booking lead time for vacation rentals in Dubai is 23 days.
- Guests book furthest in advance for stays during November (average 32 days), likely coinciding with peak travel demand or local events.
- The shortest booking windows occur for stays in June (average 13 days), indicating more last-minute travel plans during this time.
- Seasonally, Winter (29 days avg.) sees the longest lead times, while Summer (15 days avg.) has the shortest, reflecting typical travel planning cycles.
Recommendations for Hosts
- Use the overall average lead time (23 days) as a baseline for your pricing and availability strategy in Dubai.
- During June, focus on last-minute booking availability and promotions, as guests book with very short notice (13 days avg.).
- Target marketing efforts for the Winter season well in advance (at least 29 days) to capture early planners.
- Monitor your own booking lead times against these Dubai averages to identify opportunities for dynamic pricing adjustments.
Popular & Essential Airbnb Amenities in Dubai (2026)
Amenity Prevalence
Amenity Insights for Dubai
- Essential amenities in Dubai that guests expect include: Air conditioning, Wifi, TV, Kitchen, Washer. Lacking these (any) could significantly impact bookings.
- Popular amenities like Smoke alarm, Free parking on premises, Iron are common but not universal. Offering these can provide a competitive edge.
- A pool is a highly desired but not standard amenity, making it a key feature for attracting guests seeking leisure in Dubai.
Recommendations for Hosts
- Ensure your listing includes all essential amenities for Dubai: Air conditioning, Wifi, TV, Kitchen, Washer.
- Prioritize adding missing essentials: Air conditioning, Wifi, TV, Kitchen, Washer.
- Consider adding popular differentiators like Smoke alarm or Free parking on premises to increase appeal.
- Highlight unique or less common amenities you offer (e.g., hot tub, dedicated workspace, EV charger) in your listing description and photos.
- Regularly check competitor amenities in Dubai to stay competitive.
Dubai Airbnb Guest Demographics & Profile Analysis (2026)
Guest Profile Summary for Dubai
- The typical guest profile for Airbnb in Dubai consists of predominantly international visitors (89%), with top international origins including United Arab Emirates, typically belonging to the Post-2000s (Gen Z/Alpha) group (50%), primarily speaking English or Arabic.
- Domestic travelers account for 11.5% of guests.
- Key international markets include United Kingdom (14.4%) and United Arab Emirates (11.5%).
- Top languages spoken are English (44.3%) followed by Arabic (9.9%).
- A significant demographic segment is the Post-2000s (Gen Z/Alpha) group, representing 50% of guests.
Recommendations for Hosts
- Focus marketing internationally, particularly towards travelers from United Arab Emirates.
- Tailor amenities and listing descriptions to appeal to the dominant Post-2000s (Gen Z/Alpha) demographic (e.g., highlight fast WiFi, smart home features, local guides).
- Highlight unique local experiences or amenities relevant to the primary guest profile.
- Consider seasonal promotions aligned with peak travel times for key origin markets.
Nearby Short-Term Rental Market Comparison
How does the Dubai Airbnb market stack up against its neighbors? Compare key performance metrics like average monthly revenue, ADR, and occupancy rates in surrounding areas to understand the broader regional STR landscape.
| Market | Active Properties | Monthly Revenue | Daily Rate | Avg. Occupancy |
|---|---|---|---|---|
| Emaar Beachfront | 65 | $3,507 | $369.68 | 44% |
| Sharm | 58 | $2,398 | $588.29 | 20% |
| Dubai Marina | 32 | $2,348 | $225.47 | 46% |
| Mina Al arab | 25 | $2,271 | $442.53 | 25% |
| Business Bay | 1,210 | $2,269 | $251.35 | 47% |
| Fujairah | 26 | $2,241 | $563.36 | 21% |
| دبي | 588 | $1,948 | $230.79 | 45% |
| Abu Dhabi | 1,083 | $1,589 | $196.51 | 39% |
| Ras Al Khaimah | 37 | $1,577 | $222.23 | 30% |
| Ras Al-Khaimah | 34 | $1,509 | $226.14 | 28% |