Halibut Cove Airbnb Market Analysis 2025: Short Term Rental Data & Vacation Rental Statistics in Alaska, United States
Is Airbnb profitable in Halibut Cove in 2025? Explore comprehensive Airbnb analytics for Halibut Cove, Alaska, United States to uncover income potential. This 2025 STR market report for Halibut Cove, based on AirROI data from June 2024 to May 2025, reveals key trends in the niche market of 19 active listings.
Whether you're considering an Airbnb investment in Halibut Cove, optimizing your existing vacation rental, or exploring rental arbitrage opportunities, understanding the Halibut Cove Airbnb data is crucial. Understanding the local regulations is key to maximizing your short term rental income potential. Let's dive into the specifics.
Key Halibut Cove Airbnb Performance Metrics Overview
Monthly Airbnb Revenue Variations & Income Potential in Halibut Cove (2025)
Understanding the monthly revenue variations for Airbnb listings in Halibut Cove is key to maximizing your short term rental income potential. Seasonality significantly impacts earnings. Our analysis, based on data from the past 12 months, shows that the peak revenue month for STRs in Halibut Cove is typically June, while November often presents the lowest earnings, highlighting opportunities for strategic pricing adjustments during shoulder and low seasons. Explore the typical Airbnb income in Halibut Cove across different performance tiers:
- Best-in-class properties (Top 10%) achieve $6,242+ monthly, often utilizing dynamic pricing and superior guest experiences.
- Strong performing properties (Top 25%) earn $3,871 or more, indicating effective management and desirable locations/amenities.
- Typical properties (Median) generate around $2,428 per month, representing the average market performance.
- Entry-level properties (Bottom 25%) see earnings around $2,045, often with potential for optimization.
Average Monthly Airbnb Earnings Trend in Halibut Cove
Halibut Cove Airbnb Occupancy Rate Trends (2025)
Maximize your bookings by understanding the Halibut Cove STR occupancy trends. Seasonal demand shifts significantly influence how often properties are booked. Typically, Septembersees the highest demand (peak season occupancy), while October experiences the lowest (low season). Effective strategies, like adjusting minimum stays or offering promotions, can boost occupancy during slower periods. Here's how different property tiers perform in Halibut Cove:
- Best-in-class properties (Top 10%) achieve 45%+ occupancy, indicating high desirability and potentially optimized availability.
- Strong performing properties (Top 25%) maintain 34% or higher occupancy, suggesting good market fit and guest satisfaction.
- Typical properties (Median) have an occupancy rate around 25%.
- Entry-level properties (Bottom 25%) average 20% occupancy, potentially facing higher vacancy.
Average Monthly Occupancy Rate Trend in Halibut Cove
Average Daily Rate (ADR) Airbnb Trends in Halibut Cove (2025)
Effective short term rental pricing strategy in Halibut Cove involves understanding monthly ADR fluctuations. The Average Daily Rate (ADR) for Airbnb in Halibut Cove typically peaks in February and dips lowest during June. Leveraging Airbnb dynamic pricing tools or strategies based on this seasonality can significantly boost revenue. Here's a look at the typical nightly rates achieved:
- Best-in-class properties (Top 10%) command rates of $638+ per night, often due to premium features or locations.
- Strong performing properties (Top 25%) achieve nightly rates of $454 or more.
- Typical properties (Median) charge around $369 per night.
- Entry-level properties (Bottom 25%) earn around $283 per night.
Average Daily Rate (ADR) Trend by Month in Halibut Cove
Get Live Halibut Cove Market Intelligence 👇

Explore Real-time Analytics
Airbnb Seasonality Analysis & Trends in Halibut Cove (2025)
Peak Season (June, August, September)
- Revenue averages $6,891 per month
- Occupancy rates average 53.0%
- Daily rates average $432
Shoulder Season
- Revenue averages $2,765 per month
- Occupancy maintains around 26.9%
- Daily rates hold near $522
Low Season (October, November, December)
- Revenue drops to average $737 per month
- Occupancy decreases to average 10.5%
- Daily rates adjust to average $430
Seasonality Insights for Halibut Cove
- The Airbnb seasonality in Halibut Cove shows highly seasonal trends requiring careful strategy. While the sections above show seasonal averages, it's also insightful to look at the extremes:
- During the high season, the absolute peak month showcases Halibut Cove's highest earning potential, with monthly revenues capable of climbing to $8,232, occupancy reaching a high of 61.1%, and ADRs peaking at $545.
- Conversely, the slowest single month of the year, typically falling within the low season, marks the market's lowest point. In this month, revenue might dip to $419, occupancy could drop to 5.4%, and ADRs may adjust down to $428.
- Understanding both the seasonal averages and these monthly peaks and troughs in revenue, occupancy, and ADR is crucial for maximizing your Airbnb profit potential in Halibut Cove.
Seasonal Strategies for Maximizing Profit
- Peak Season: Maximize revenue through premium pricing and potentially longer minimum stays. Ensure high availability.
- Low Season: Offer competitive pricing, special promotions (e.g., extended stay discounts), and flexible cancellation policies. Target off-season travelers like remote workers or budget-conscious guests.
- Shoulder Seasons: Implement dynamic pricing that balances peak and low rates. Target weekend travelers or specific events. Offer slightly more flexible terms than peak season.
- Regularly analyze your own performance against these Halibut Cove seasonality benchmarks and adjust your pricing and availability strategy accordingly.
Best Areas for Airbnb Investment in Halibut Cove (2025)
Exploring the top neighborhoods for short-term rentals in Halibut Cove? This section highlights key areas, outlining why they are attractive for hosts and guests, along with notable local attractions. Consider these locations based on your target guest profile and investment strategy.
| Neighborhood / Area | Why Host Here? (Target Guests & Appeal) | Key Attractions & Landmarks |
|---|---|---|
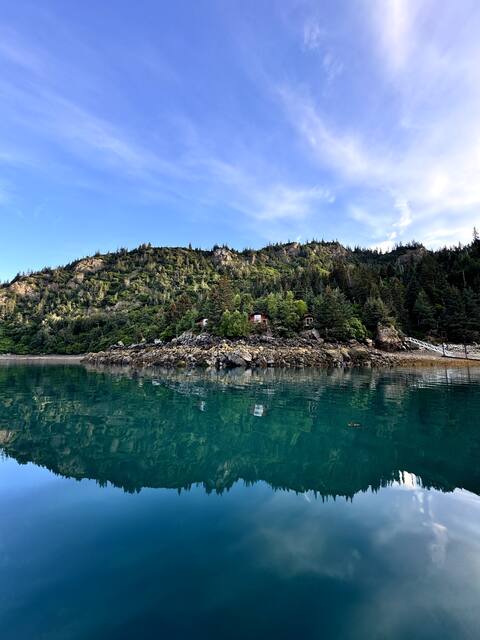
| Halibut Cove Village | A picturesque village only accessible by boat or seaplane, Halibut Cove offers breathtaking views, hiking opportunities, and unique residential properties. It's a popular spot for tourists looking for an authentic Alaskan experience. | Kachemak Bay State Park, Halibut Cove State Park, Glacier exploration tours, Cove Waterfall, Wildlife watching |
| Kachemak Bay | Known for its stunning coastline and diverse wildlife, Kachemak Bay is perfect for those interested in outdoor activities like kayaking, fishing, and exploring the natural beauty of Alaska. It's a highly sought-after destination for adventure tourists. | Kachemak Bay State Park, Kayaking tours, Hiking trails, Fishing spots, Wildlife viewing tours |
| Homer Spit | The famous spit offers a unique location with beaches, shops, and restaurants. It's a gateway to many fishing and boating activities and is popular among visitors seeking a lively atmosphere with a local vibe. | Homer Harbor, Homer Prensinsula, Fishing charters, Scenic views and photography spots, Art galleries |
| Seldovia | A small coastal town adjacent to Halibut Cove with rich history and charm. It's a peaceful getaway with a close-knit community feel, perfect for relaxed getaways and local cultural experiences. | Seldovia Harbor, Historic sites, Local art galleries, Fishing and boating spots, Wildlife tours |
| Anchor Point | The nearest point of land to the Aleutian Islands, Anchor Point offers unique fishing experiences and beautiful landscapes. It's ideal for outdoor enthusiasts and those seeking a true Alaskan adventure. | Anchor Point Beach, Fishing piers, Scenic viewpoints, Hiking trails, Wildlife watching |
| Kasilof River | Renowned for its salmon fishing, the Kasilof River area draws in many sports fishing enthusiasts, making it a prime location for those looking for outdoor adventure experiences. | Kasilof River fishing, Guided fishing tours, Kayaking opportunities, Scenic picnic areas, Wildlife viewing |
| Beluga Lake | A tranquil and scenic area perfect for nature lovers and those seeking a peaceful retreat. Beluga Lake is a lovely spot for water activities and enjoying the views of the surrounding wilderness. | Beluga Lake access, Scenic trails, Birdwatching spots, Boating, Photography opportunities |
| Ninilchik | A historic Russian fishing village with stunning views of the mountains and ocean. It's popular for its cultural heritage and offers a unique glimpse into Alaskan history and lifestyle. | Ninilchik Village historic sites, Fishing charters, Scenic views of the Kenai Peninsula, Ninilchik State Recreation Area, Wildlife viewing |
Understanding Airbnb License Requirements & STR Laws in Halibut Cove (2025)
With 16% of listings showing registration in 2025, understanding potential Airbnb license requirements is crucial in Halibut Cove. Always verify the latest short term rental regulations and Airbnb license requirements directly with local government authorities for Halibut Cove to ensure full compliance before hosting.
(Source: AirROI data, 2025, based on 16% licensed listings)
Top Performing Airbnb Properties in Halibut Cove (2025)
Benchmark your potential! Explore examples of top-performing Airbnb properties in Halibut Covebased on Trailing Twelve Month (TTM) revenue. Analyze their characteristics, revenue, occupancy rate, and ADR to understand what drives success in this market.
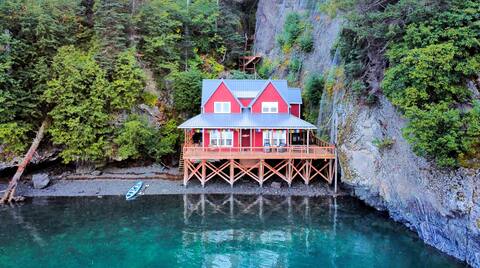
Waterfront Cottage w/ Breathtaking View & Kayaks
Entire Place • 3 bedrooms

Halibut Cove House
Entire Place • 4 bedrooms

Eagles Nest Cabin in Remote Halibut Cove, Alaska
Entire Place • 2 bedrooms

Exceptional guesthouse over the Bay
Entire Place • 1 bedroom
"Three Moose" Eco-Lodge
Entire Place • 5 bedrooms

Sea Shanty
Entire Place • 2 bedrooms
Note: Performance varies based on location, size, amenities, seasonality, and management quality. Data reflects the past 12 months.
Top Performing Airbnb Hosts in Halibut Cove (2025)
Learn from the best! This table showcases top-performing Airbnb hosts in Halibut Cove based on the number of properties managed and estimated total revenue over the past year. Analyze their scale and performance metrics.
| Host Name | Properties | Grossing Revenue | Stay Reviews | Avg Rating |
|---|---|---|---|---|
| Halibut Cove | 6 | $61,828 | 16 | 4.79/5.0 |
| Eric | 1 | $48,744 | 22 | 4.95/5.0 |
| Jennie | 5 | $45,598 | 8 | 5.00/5.0 |
| Olesya | 1 | $36,550 | 26 | 5.00/5.0 |
| Host #523329352 | 3 | $34,115 | 0 | Not Rated |
| Chris | 1 | $29,751 | 34 | 5.00/5.0 |
| Carmen | 1 | $28,955 | 10 | 5.00/5.0 |
| Mary | 1 | $12,160 | 11 | 5.00/5.0 |
Analyzing the strategies of top hosts, such as their property selection, pricing, and guest communication, can offer valuable lessons for optimizing your own Airbnb operations in Halibut Cove.
Dive Deeper: Advanced Halibut Cove STR Market Data (2025)
Ready to unlock more insights? AirROI provides access to advanced metrics and comprehensive Airbnb data for Halibut Cove. Explore detailed analytics beyond this report to refine your investment strategy, optimize pricing, and maximize your vacation rental profits.
Explore Advanced MetricsHalibut Cove Short-Term Rental Market Composition (2025): Property & Room Types
Room Type Distribution
Property Type Distribution
Market Composition Insights for Halibut Cove
- The Halibut Cove Airbnb market composition is heavily skewed towards Entire Home/Apt listings, which make up 100% of the 19 active rentals. This indicates strong guest preference for privacy and space.
- Looking at the property type distribution in Halibut Cove, Outdoor/Unique properties are the most common (84.2%), reflecting the local real estate landscape.
Halibut Cove Airbnb Room Capacity Analysis (2025): Bedroom Distribution
Distribution of Listings by Number of Bedrooms
Room Capacity Insights for Halibut Cove
- The dominant room capacity in Halibut Cove is 1 bedroom listings, making up 68.4% of the market. This suggests a strong demand for properties suitable for couples or solo travelers.
- Together, 1 bedroom and 2 bedrooms properties represent 78.9% of the active Airbnb listings in Halibut Cove, indicating a high concentration in these sizes.
- With over half the market (68.4%) consisting of studios or 1-bedroom units, Halibut Cove is particularly well-suited for individuals or couples.
Halibut Cove Vacation Rental Guest Capacity Trends (2025)
Distribution of Listings by Guest Capacity
Guest Capacity Insights for Halibut Cove
- The most common guest capacity trend in Halibut Cove vacation rentals is listings accommodating 4 guests (26.3%). This suggests the primary traveler segment is likely small families or groups.
- Properties designed for 4 guests and 6 guests dominate the Halibut Cove STR market, accounting for 47.4% of listings.
- 31.6% of properties accommodate 6+ guests, serving the market segment for larger families or group travel in Halibut Cove.
- On average, properties in Halibut Cove are equipped to host 4.3 guests.
Halibut Cove Airbnb Booking Patterns (2025): Available vs. Booked Days
Available Days Distribution
Booked Days Distribution
Booking Pattern Insights for Halibut Cove
- The most common availability pattern in Halibut Cove falls within the 271-366 days range, representing 94.7% of listings. This suggests many properties have significant open periods on their calendars.
- Approximately 100.0% of listings show high availability (181+ days open annually), indicating potential for increased bookings or specific owner usage patterns.
- For booked days, the 31-90 days range is most frequent in Halibut Cove (47.4%), reflecting common guest stay durations or potential owner blocking patterns.
Halibut Cove Airbnb Minimum Stay Requirements Analysis
Distribution of Listings by Minimum Night Requirement
1 Night
5 listings
26.3% of total
2 Nights
10 listings
52.6% of total
3 Nights
3 listings
15.8% of total
30+ Nights
1 listings
5.3% of total
Key Insights
- The most prevalent minimum stay requirement in Halibut Cove is 2 Nights, adopted by 52.6% of listings. This highlights the market's preference for shorter, flexible bookings.
- A strong majority (78.9%) of the Halibut Cove Airbnb data shows acceptance of very short stays (1-2 nights), indicating a dynamic, high-turnover market.
Recommendations
- Align with the market by considering a 2 Nights minimum stay, as 52.6% of Halibut Cove hosts use this setting.
- If feasible, allowing 1-night stays, especially midweek or during low season, could capture last-minute bookings, as only 26.3% currently do.
- Explore offering discounts for stays of 30+ nights to attract the 5.3% of the market seeking extended stays.
- Adjust minimum nights based on seasonality – potentially shorter during low season and longer during peak demand periods in Halibut Cove.
Halibut Cove Airbnb Cancellation Policy Trends Analysis (2025)
Flexible
3 listings
21.4% of total
Firm
9 listings
64.3% of total
Strict
2 listings
14.3% of total
Cancellation Policy Insights for Halibut Cove
- The prevailing Airbnb cancellation policy trend in Halibut Cove is Firm, used by 64.3% of listings.
- A majority (78.6%) of hosts in Halibut Cove utilize Firm or Strict policies, indicating a market where hosts prioritize booking security.
Recommendations for Hosts
- Consider adopting a Firm policy to align with the 64.3% market standard in Halibut Cove.
- Using a Strict policy might deter some guests, as only 14.3% of listings use it. Evaluate if potential revenue protection outweighs possible lower booking rates.
- Regularly review your cancellation policy against competitors and market demand shifts in Halibut Cove.
Halibut Cove STR Booking Lead Time Analysis (2025)
Average Booking Lead Time by Month
Booking Lead Time Insights for Halibut Cove
- The overall average booking lead time for vacation rentals in Halibut Cove is 32 days.
- Guests book furthest in advance for stays during June (average 73 days), likely coinciding with peak travel demand or local events.
- The shortest booking windows occur for stays in December (average 1 days), indicating more last-minute travel plans during this time.
- Seasonally, Summer (47 days avg.) sees the longest lead times, while Winter (1 days avg.) has the shortest, reflecting typical travel planning cycles.
Recommendations for Hosts
- Use the overall average lead time (32 days) as a baseline for your pricing and availability strategy in Halibut Cove.
- For June stays, consider implementing length-of-stay discounts or slightly higher rates for bookings made less than 73 days out to capitalize on advance planning.
- During December, focus on last-minute booking availability and promotions, as guests book with very short notice (1 days avg.).
- Target marketing efforts for the Summer season well in advance (at least 47 days) to capture early planners.
- Monitor your own booking lead times against these Halibut Cove averages to identify opportunities for dynamic pricing adjustments.
Popular & Essential Airbnb Amenities in Halibut Cove (2025)
Amenity Prevalence
Amenity Insights for Halibut Cove
- Popular amenities like Kitchen, BBQ grill, Carbon monoxide alarm are common but not universal. Offering these can provide a competitive edge.
- Warning: Wifi is not universally provided but is considered essential globally. Ensure reliable Wifi is offered.
Recommendations for Hosts
- Consider adding popular differentiators like Kitchen or BBQ grill to increase appeal.
- Highlight unique or less common amenities you offer (e.g., hot tub, dedicated workspace, EV charger) in your listing description and photos.
- Regularly check competitor amenities in Halibut Cove to stay competitive.
Halibut Cove Airbnb Guest Demographics & Profile Analysis (2025)
Guest Profile Summary for Halibut Cove
- The typical guest profile for Airbnb in Halibut Cove consists of primarily domestic travelers (100%), often arriving from nearby Anchorage, typically belonging to the Post-2000s (Gen Z/Alpha) group (50%), primarily speaking English or Spanish.
- Domestic travelers account for 100.0% of guests.
- Top languages spoken are English (71.4%) followed by Spanish (14.3%).
- A significant demographic segment is the Post-2000s (Gen Z/Alpha) group, representing 50% of guests.
Recommendations for Hosts
- Target domestic marketing efforts towards travelers from Anchorage and New York.
- Tailor amenities and listing descriptions to appeal to the dominant Post-2000s (Gen Z/Alpha) demographic (e.g., highlight fast WiFi, smart home features, local guides).
- Highlight unique local experiences or amenities relevant to the primary guest profile.
- Consider seasonal promotions aligned with peak travel times for key origin markets.
Nearby Short-Term Rental Market Comparison
How does the Halibut Cove Airbnb market stack up against its neighbors? Compare key performance metrics like average monthly revenue, ADR, and occupancy rates in surrounding areas to understand the broader regional STR landscape.
| Market | Active Properties | Monthly Revenue | Daily Rate | Avg. Occupancy |
|---|---|---|---|---|
| Homer | 468 | $2,001 | $270.99 | 44% |
| Kachemak City | 24 | $1,985 | $269.02 | 44% |
| Seldovia | 20 | $1,889 | $352.41 | 37% |
| Kenai | 189 | $1,579 | $225.61 | 47% |
| Soldotna | 312 | $1,378 | $262.69 | 42% |
| Sterling | 85 | $1,251 | $263.17 | 44% |
| Anchor Point | 44 | $1,103 | $218.26 | 37% |
| Kasilof | 72 | $805 | $220.52 | 37% |
| Ninilchik | 48 | $756 | $200.70 | 31% |
| Clam Gulch | 15 | $546 | $188.38 | 29% |