Happy Jack Airbnb Market Analysis 2025: Short Term Rental Data & Vacation Rental Statistics in Arizona, United States
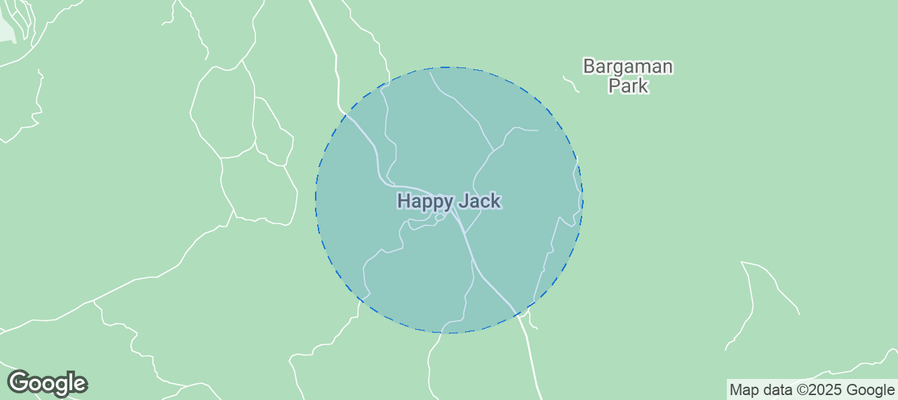
Is Airbnb profitable in Happy Jack in 2025? Explore comprehensive Airbnb analytics for Happy Jack, Arizona, United States to uncover income potential. This 2025 STR market report for Happy Jack, based on AirROI data from December 2024 to November 2025, reveals key trends in the niche market of 19 active listings.
Whether you're considering an Airbnb investment in Happy Jack, optimizing your existing vacation rental, or exploring rental arbitrage opportunities, understanding the Happy Jack Airbnb data is crucial. Leveraging the low regulation environment is key to maximizing your short term rental income potential. Let's dive into the specifics.
Key Happy Jack Airbnb Performance Metrics Overview
Monthly Airbnb Revenue Variations & Income Potential in Happy Jack (2025)
Understanding the monthly revenue variations for Airbnb listings in Happy Jack is key to maximizing your short term rental income potential. Seasonality significantly impacts earnings. Our analysis, based on data from the past 12 months, shows that the peak revenue month for STRs in Happy Jack is typically December, while April often presents the lowest earnings, highlighting opportunities for strategic pricing adjustments during shoulder and low seasons. Explore the typical Airbnb income in Happy Jack across different performance tiers:
- Best-in-class properties (Top 10%) achieve $5,830+ monthly, often utilizing dynamic pricing and superior guest experiences.
- Strong performing properties (Top 25%) earn $4,240 or more, indicating effective management and desirable locations/amenities.
- Typical properties (Median) generate around $2,999 per month, representing the average market performance.
- Entry-level properties (Bottom 25%) see earnings around $1,824, often with potential for optimization.
Average Monthly Airbnb Earnings Trend in Happy Jack
Happy Jack Airbnb Occupancy Rate Trends (2025)
Maximize your bookings by understanding the Happy Jack STR occupancy trends. Seasonal demand shifts significantly influence how often properties are booked. Typically, Decembersees the highest demand (peak season occupancy), while February experiences the lowest (low season). Effective strategies, like adjusting minimum stays or offering promotions, can boost occupancy during slower periods. Here's how different property tiers perform in Happy Jack:
- Best-in-class properties (Top 10%) achieve 76%+ occupancy, indicating high desirability and potentially optimized availability.
- Strong performing properties (Top 25%) maintain 58% or higher occupancy, suggesting good market fit and guest satisfaction.
- Typical properties (Median) have an occupancy rate around 36%.
- Entry-level properties (Bottom 25%) average 22% occupancy, potentially facing higher vacancy.
Average Monthly Occupancy Rate Trend in Happy Jack
Average Daily Rate (ADR) Airbnb Trends in Happy Jack (2025)
Effective short term rental pricing strategy in Happy Jack involves understanding monthly ADR fluctuations. The Average Daily Rate (ADR) for Airbnb in Happy Jack typically peaks in September and dips lowest during February. Leveraging Airbnb dynamic pricing tools or strategies based on this seasonality can significantly boost revenue. Here's a look at the typical nightly rates achieved:
- Best-in-class properties (Top 10%) command rates of $352+ per night, often due to premium features or locations.
- Strong performing properties (Top 25%) achieve nightly rates of $282 or more.
- Typical properties (Median) charge around $240 per night.
- Entry-level properties (Bottom 25%) earn around $204 per night.
Average Daily Rate (ADR) Trend by Month in Happy Jack
Get Live Happy Jack Market Intelligence 👇
Explore Real-time Analytics
Airbnb Seasonality Analysis & Trends in Happy Jack (2025)
Peak Season (December, August, July)
- Revenue averages $4,605 per month
- Occupancy rates average 54.1%
- Daily rates average $273
Shoulder Season
- Revenue averages $3,150 per month
- Occupancy maintains around 40.2%
- Daily rates hold near $266
Low Season (February, March, April)
- Revenue drops to average $2,069 per month
- Occupancy decreases to average 31.6%
- Daily rates adjust to average $240
Seasonality Insights for Happy Jack
- The Airbnb seasonality in Happy Jack shows highly seasonal trends requiring careful strategy. While the sections above show seasonal averages, it's also insightful to look at the extremes:
- During the high season, the absolute peak month showcases Happy Jack's highest earning potential, with monthly revenues capable of climbing to $5,130, occupancy reaching a high of 62.3%, and ADRs peaking at $280.
- Conversely, the slowest single month of the year, typically falling within the low season, marks the market's lowest point. In this month, revenue might dip to $1,861, occupancy could drop to 26.8%, and ADRs may adjust down to $238.
- Understanding both the seasonal averages and these monthly peaks and troughs in revenue, occupancy, and ADR is crucial for maximizing your Airbnb profit potential in Happy Jack.
Seasonal Strategies for Maximizing Profit
- Peak Season: Maximize revenue through premium pricing and potentially longer minimum stays. Ensure high availability.
- Low Season: Offer competitive pricing, special promotions (e.g., extended stay discounts), and flexible cancellation policies. Target off-season travelers like remote workers or budget-conscious guests.
- Shoulder Seasons: Implement dynamic pricing that balances peak and low rates. Target weekend travelers or specific events. Offer slightly more flexible terms than peak season.
- Regularly analyze your own performance against these Happy Jack seasonality benchmarks and adjust your pricing and availability strategy accordingly.
Best Areas for Airbnb Investment in Happy Jack (2025)
Exploring the top neighborhoods for short-term rentals in Happy Jack? This section highlights key areas, outlining why they are attractive for hosts and guests, along with notable local attractions. Consider these locations based on your target guest profile and investment strategy.
| Neighborhood / Area | Why Host Here? (Target Guests & Appeal) | Key Attractions & Landmarks |
|---|---|---|
| Pinewood | A serene mountain location perfect for outdoor activities like hiking, fishing, and camping. Its proximity to the Coconino National Forest attracts nature lovers year-round. | Coconino National Forest, Pinewood Lake, Hiking Trails, Fishing Spots, Campgrounds |
| Happy Jack Lodge | A cozy area known for its quaint lodges and strong community vibe. Ideal for families and travelers looking for a peaceful retreat away from the city. | Happy Jack Lodge, Local Shops, Community Events, Nature Trails |
| Mormon Lake | A beautiful area with scenic views and recreational activities like boating and hiking. Attracts visitors looking for a rustic escape close to water activities. | Mormon Lake, Boating, Hiking Trails, Scenic Overlooks |
| Blue Ridge | A quiet and picturesque area surrounded by pine trees, popular for those wanting to escape the heat and enjoy fresh mountain air during the summer months. | Blue Ridge Reservoir, Hiking Trails, Mountain Scenery, Wildlife Watching |
| Cedar Ridge | A charming neighborhood with a mix of cabins and modern homes. It’s appealing for vacationers seeking a tranquil stay with easy access to outdoor sports. | Cedar Ridge Cabin Rentals, Mountain Biking Trails, Nature Parks, Local Wildlife |
| Willow Valley | Known for its approachable outdoor atmosphere, this area is favored for its off-road activities, mountain biking, and proximity to various natural landmarks. | Willow Valley Trails, Outdoor Sports, Scenic Views, National Forest Access |
| Munds Park | A delightful place just south of Happy Jack with friendly neighbors and beautiful landscapes, making it a popular stop for casual visitors and nature enthusiasts. | Munds Park Trails, Local Parks, Golf Course, Wildflower Viewing |
| Flagstaff Nearby | While not in Happy Jack, Flagstaff offers a bustling downtown and access to diverse attractions which can serve as a base for travelers exploring the surrounding natural beauty. | Downtown Flagstaff, Lowell Observatory, Flagstaff Extreme Adventure Course, Northern Arizona University |
Understanding Airbnb License Requirements & STR Laws in Happy Jack (2025)
While Happy Jack, Arizona, United States currently shows low STR regulations, specific Airbnb license requirements might still exist or change. Always verify the latest short term rental regulations and Airbnb license requirements directly with local government authorities for Happy Jack to ensure full compliance before hosting.
(Source: AirROI data, 2025, finding no licensed listings among those analyzed)
Top Performing Airbnb Properties in Happy Jack (2025)
Benchmark your potential! Explore examples of top-performing Airbnb properties in Happy Jackbased on Trailing Twelve Month (TTM) revenue. Analyze their characteristics, revenue, occupancy rate, and ADR to understand what drives success in this market.
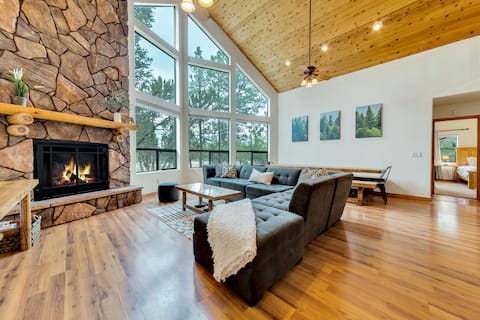
Unplug and Connect with Your Family: Rustic Cabin in the Heart of the Woods
Entire Place • 4 bedrooms
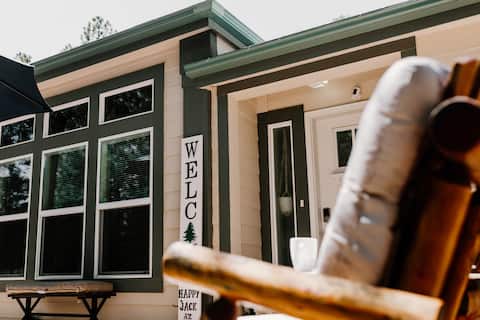
Making Memories in the Pines!
Entire Place • 4 bedrooms
Bring a Pet: Happy Jack Cabin w/ Fire Pit!
Entire Place • 3 bedrooms

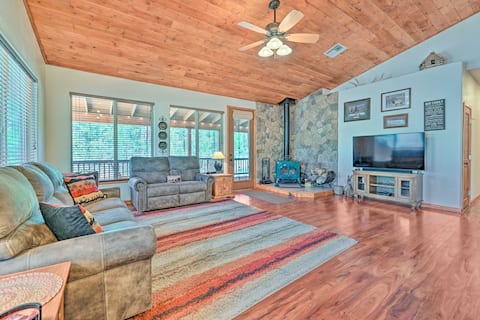
Timber Lodge Retreat
Entire Place • 3 bedrooms
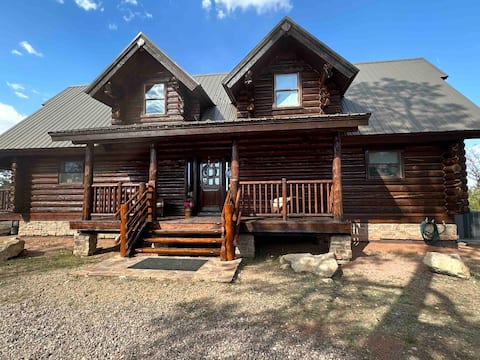
Beautiful Cozy Elk Cabin in the Woods
Entire Place • 3 bedrooms
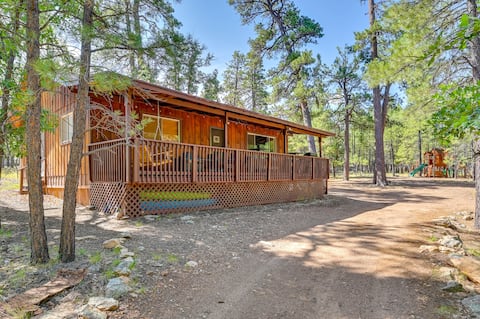
Coconino Cabin w/ Kayaks ~ 13 Mi to Reservoir
Entire Place • 3 bedrooms
Note: Performance varies based on location, size, amenities, seasonality, and management quality. Data reflects the past 12 months.
Top Performing Airbnb Hosts in Happy Jack (2025)
Learn from the best! This table showcases top-performing Airbnb hosts in Happy Jack based on the number of properties managed and estimated total revenue over the past year. Analyze their scale and performance metrics.
| Host Name | Properties | Grossing Revenue | Stay Reviews | Avg Rating |
|---|---|---|---|---|
| Evolve | 4 | $106,832 | 76 | 4.92/5.0 |
| Evolve | 3 | $97,178 | 105 | 4.94/5.0 |
| Evolve | 2 | $70,944 | 180 | 4.89/5.0 |
| William | 1 | $63,943 | 76 | 4.97/5.0 |
| Rudy | 1 | $53,238 | 25 | 5.00/5.0 |
| Brook | 1 | $49,386 | 22 | 5.00/5.0 |
| Heather | 1 | $47,200 | 57 | 4.93/5.0 |
| Rebekah | 1 | $45,813 | 52 | 4.96/5.0 |
| Niki | 1 | $27,493 | 68 | 4.93/5.0 |
| Patricia | 1 | $22,386 | 46 | 4.93/5.0 |
Analyzing the strategies of top hosts, such as their property selection, pricing, and guest communication, can offer valuable lessons for optimizing your own Airbnb operations in Happy Jack.
Dive Deeper: Advanced Happy Jack STR Market Data (2025)
Ready to unlock more insights? AirROI provides access to advanced metrics and comprehensive Airbnb data for Happy Jack. Explore detailed analytics beyond this report to refine your investment strategy, optimize pricing, and maximize your vacation rental profits.
Explore Advanced MetricsHappy Jack Short-Term Rental Market Composition (2025): Property & Room Types
Room Type Distribution
Property Type Distribution
Market Composition Insights for Happy Jack
- The Happy Jack Airbnb market composition is heavily skewed towards Entire Home/Apt listings, which make up 100% of the 19 active rentals. This indicates strong guest preference for privacy and space.
- Looking at the property type distribution in Happy Jack, Outdoor/Unique properties are the most common (94.7%), reflecting the local real estate landscape.
Happy Jack Airbnb Room Capacity Analysis (2025): Bedroom Distribution
Distribution of Listings by Number of Bedrooms
Room Capacity Insights for Happy Jack
- The dominant room capacity in Happy Jack is 3 bedrooms listings, making up 63.2% of the market. This suggests a strong demand for properties suitable for families or small groups.
- Together, 3 bedrooms and 2 bedrooms properties represent 79.0% of the active Airbnb listings in Happy Jack, indicating a high concentration in these sizes.
- A significant 73.7% of listings offer 3+ bedrooms, catering to larger groups and families seeking more space in Happy Jack.
Happy Jack Vacation Rental Guest Capacity Trends (2025)
Distribution of Listings by Guest Capacity
Guest Capacity Insights for Happy Jack
- The most common guest capacity trend in Happy Jack vacation rentals is listings accommodating 8+ guests (63.2%). This suggests the primary traveler segment is likely larger groups.
- Properties designed for 8+ guests and 7 guests dominate the Happy Jack STR market, accounting for 79.0% of listings.
- 84.3% of properties accommodate 6+ guests, serving the market segment for larger families or group travel in Happy Jack.
- On average, properties in Happy Jack are equipped to host 7.1 guests.
Happy Jack Airbnb Booking Patterns (2025): Available vs. Booked Days
Available Days Distribution
Booked Days Distribution
Booking Pattern Insights for Happy Jack
- The most common availability pattern in Happy Jack falls within the 181-270 days range, representing 42.1% of listings. This suggests many properties have significant open periods on their calendars.
- Approximately 73.7% of listings show high availability (181+ days open annually), indicating potential for increased bookings or specific owner usage patterns.
- For booked days, the 91-180 days range is most frequent in Happy Jack (42.1%), reflecting common guest stay durations or potential owner blocking patterns.
- A notable 26.4% of properties secure long booking periods (181+ days booked per year), highlighting successful long-term rental strategies or significant owner usage.
Happy Jack Airbnb Minimum Stay Requirements Analysis
Distribution of Listings by Minimum Night Requirement
1 Night
2 listings
10.5% of total
2 Nights
9 listings
47.4% of total
3 Nights
4 listings
21.1% of total
30+ Nights
4 listings
21.1% of total
Key Insights
- The most prevalent minimum stay requirement in Happy Jack is 2 Nights, adopted by 47.4% of listings. This highlights the market's preference for shorter, flexible bookings.
- A significant segment (21.1%) caters to monthly stays (30+ nights) in Happy Jack, pointing to opportunities in the extended-stay market.
Recommendations
- Align with the market by considering a 2 Nights minimum stay, as 47.4% of Happy Jack hosts use this setting.
- If feasible, allowing 1-night stays, especially midweek or during low season, could capture last-minute bookings, as only 10.5% currently do.
- A 2-night minimum appears standard (47.4%). Consider this for weekends or peak periods.
- Explore offering discounts for stays of 30+ nights to attract the 21.1% of the market seeking extended stays.
- Adjust minimum nights based on seasonality – potentially shorter during low season and longer during peak demand periods in Happy Jack.
Happy Jack Airbnb Cancellation Policy Trends Analysis (2025)
Flexible
3 listings
15.8% of total
Moderate
3 listings
15.8% of total
Firm
3 listings
15.8% of total
Strict
10 listings
52.6% of total
Cancellation Policy Insights for Happy Jack
- The prevailing Airbnb cancellation policy trend in Happy Jack is Strict, used by 52.6% of listings.
- A majority (68.4%) of hosts in Happy Jack utilize Firm or Strict policies, indicating a market where hosts prioritize booking security.
Recommendations for Hosts
- Consider adopting a Strict policy to align with the 52.6% market standard in Happy Jack.
- With 52.6% using Strict terms, this is a viable option in Happy Jack, particularly for high-value properties or during peak demand periods.
- Regularly review your cancellation policy against competitors and market demand shifts in Happy Jack.
Happy Jack STR Booking Lead Time Analysis (2025)
Average Booking Lead Time by Month
Booking Lead Time Insights for Happy Jack
- The overall average booking lead time for vacation rentals in Happy Jack is 54 days.
- Guests book furthest in advance for stays during November (average 118 days), likely coinciding with peak travel demand or local events.
- The shortest booking windows occur for stays in February (average 10 days), indicating more last-minute travel plans during this time.
- Seasonally, Fall (74 days avg.) sees the longest lead times, while Summer (37 days avg.) has the shortest, reflecting typical travel planning cycles.
Recommendations for Hosts
- Use the overall average lead time (54 days) as a baseline for your pricing and availability strategy in Happy Jack.
- For November stays, consider implementing length-of-stay discounts or slightly higher rates for bookings made less than 118 days out to capitalize on advance planning.
- During February, focus on last-minute booking availability and promotions, as guests book with very short notice (10 days avg.).
- Target marketing efforts for the Fall season well in advance (at least 74 days) to capture early planners.
- Monitor your own booking lead times against these Happy Jack averages to identify opportunities for dynamic pricing adjustments.
Popular & Essential Airbnb Amenities in Happy Jack (2025)
Amenity Prevalence
No amenities with partial availability (less than 100%) were found to display in the chart. All essential amenities might be present in all listings. Check insights below.
Amenity Insights for Happy Jack
- Essential amenities in Happy Jack that guests expect include: Microwave, TV, Heating, Refrigerator, Cooking basics, Hot water, Oven, Fire extinguisher, Kitchen, Free parking on premises. Lacking these (any) could significantly impact bookings.
Recommendations for Hosts
- Ensure your listing includes all essential amenities for Happy Jack: Microwave, TV, Heating, Refrigerator, Cooking basics, Hot water, Oven, Fire extinguisher, Kitchen, Free parking on premises.
- Highlight unique or less common amenities you offer (e.g., hot tub, dedicated workspace, EV charger) in your listing description and photos.
- Regularly check competitor amenities in Happy Jack to stay competitive.
Happy Jack Airbnb Guest Demographics & Profile Analysis (2025)
Guest Profile Summary for Happy Jack
- The typical guest profile for Airbnb in Happy Jack consists of primarily domestic travelers (99%), often arriving from nearby Phoenix, typically belonging to the Post-2000s (Gen Z/Alpha) group (50%), primarily speaking English or Spanish.
- Domestic travelers account for 98.9% of guests.
- Key international markets include United States (98.9%) and Mexico (1.1%).
- Top languages spoken are English (85.4%) followed by Spanish (14.6%).
- A significant demographic segment is the Post-2000s (Gen Z/Alpha) group, representing 50% of guests.
Recommendations for Hosts
- Target domestic marketing efforts towards travelers from Phoenix and Mesa.
- Tailor amenities and listing descriptions to appeal to the dominant Post-2000s (Gen Z/Alpha) demographic (e.g., highlight fast WiFi, smart home features, local guides).
- Highlight unique local experiences or amenities relevant to the primary guest profile.
- Consider seasonal promotions aligned with peak travel times for key origin markets.
Nearby Short-Term Rental Market Comparison
How does the Happy Jack Airbnb market stack up against its neighbors? Compare key performance metrics like average monthly revenue, ADR, and occupancy rates in surrounding areas to understand the broader regional STR landscape.
| Market | Active Properties | Monthly Revenue | Daily Rate | Avg. Occupancy |
|---|---|---|---|---|
| Paradise Valley | 64 | $10,508 | $1209.41 | 40% |
| Sedona | 1,640 | $5,860 | $414.79 | 50% |
| Fort Valley | 38 | $5,050 | $409.62 | 44% |
| Sedona City Limit | 391 | $4,862 | $328.32 | 50% |
| Carefree | 31 | $4,464 | $532.12 | 40% |
| Scottsdale | 4,315 | $4,333 | $370.63 | 47% |
| Doney Park | 17 | $4,302 | $296.02 | 55% |
| Cave Creek | 128 | $4,264 | $405.68 | 42% |
| Big Park | 431 | $3,755 | $289.05 | 47% |
| Kachina Village | 144 | $3,749 | $258.75 | 50% |