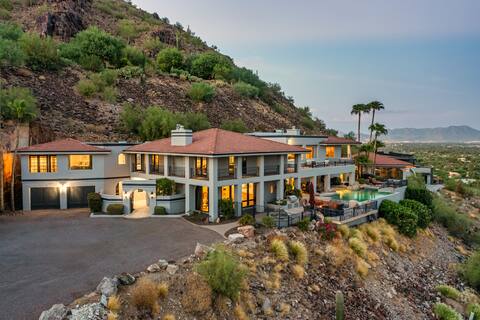
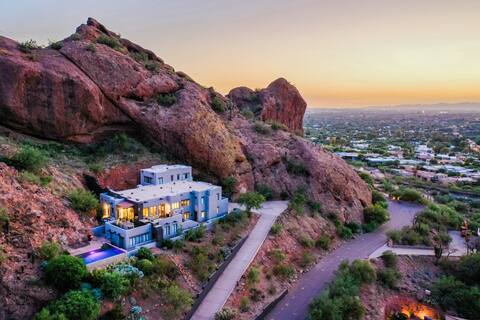
Paradise Valley Airbnb Market Analysis 2026: Short Term Rental Data & Vacation Rental Statistics in Arizona, United States
Is Airbnb profitable in Paradise Valley in 2026? Explore comprehensive Airbnb analytics for Paradise Valley, Arizona, United States to uncover income potential. This 2026 STR market report for Paradise Valley, based on AirROI data from February 2025 to January 2026, reveals key trends in the niche market of 67 active listings.
Whether you're considering an Airbnb investment in Paradise Valley, optimizing your existing vacation rental, or exploring rental arbitrage opportunities, understanding the Paradise Valley Airbnb data is crucial. Leveraging the low regulation environment is key to maximizing your short term rental income potential. Let's dive into the specifics.
Key Paradise Valley Airbnb Performance Metrics Overview
Monthly Airbnb Revenue Variations & Income Potential in Paradise Valley (2026)
Understanding the monthly revenue variations for Airbnb listings in Paradise Valley is key to maximizing your short term rental income potential. Seasonality significantly impacts earnings. Our analysis, based on data from the past 12 months, shows that the peak revenue month for STRs in Paradise Valley is typically March, while August often presents the lowest earnings, highlighting opportunities for strategic pricing adjustments during shoulder and low seasons. Explore the typical Airbnb income in Paradise Valley across different performance tiers:
- Best-in-class properties (Top 10%) achieve $28,867+ monthly, often utilizing dynamic pricing and superior guest experiences.
- Strong performing properties (Top 25%) earn $20,091 or more, indicating effective management and desirable locations/amenities.
- Typical properties (Median) generate around $12,422 per month, representing the average market performance.
- Entry-level properties (Bottom 25%) see earnings around $5,031, often with potential for optimization.
Average Monthly Airbnb Earnings Trend in Paradise Valley
Paradise Valley Airbnb Occupancy Rate Trends (2026)
Maximize your bookings by understanding the Paradise Valley STR occupancy trends. Seasonal demand shifts significantly influence how often properties are booked. Typically, Marchsees the highest demand (peak season occupancy), while August experiences the lowest (low season). Effective strategies, like adjusting minimum stays or offering promotions, can boost occupancy during slower periods. Here's how different property tiers perform in Paradise Valley:
- Best-in-class properties (Top 10%) achieve 77%+ occupancy, indicating high desirability and potentially optimized availability.
- Strong performing properties (Top 25%) maintain 58% or higher occupancy, suggesting good market fit and guest satisfaction.
- Typical properties (Median) have an occupancy rate around 38%.
- Entry-level properties (Bottom 25%) average 21% occupancy, potentially facing higher vacancy.
Average Monthly Occupancy Rate Trend in Paradise Valley
Average Daily Rate (ADR) Airbnb Trends in Paradise Valley (2026)
Effective short term rental pricing strategy in Paradise Valley involves understanding monthly ADR fluctuations. The Average Daily Rate (ADR) for Airbnb in Paradise Valley typically peaks in January and dips lowest during August. Leveraging Airbnb dynamic pricing tools or strategies based on this seasonality can significantly boost revenue. Here's a look at the typical nightly rates achieved:
- Best-in-class properties (Top 10%) command rates of $2,433+ per night, often due to premium features or locations.
- Strong performing properties (Top 25%) achieve nightly rates of $1,752 or more.
- Typical properties (Median) charge around $1,069 per night.
- Entry-level properties (Bottom 25%) earn around $593 per night.
Average Daily Rate (ADR) Trend by Month in Paradise Valley
Get Live Paradise Valley Market Intelligence 👇

Explore Real-time Analytics
Airbnb Seasonality Analysis & Trends in Paradise Valley (2026)
Peak Season (March, December, February)
- Revenue averages $19,686 per month
- Occupancy rates average 51.1%
- Daily rates average $1,357
Shoulder Season
- Revenue averages $14,186 per month
- Occupancy maintains around 40.4%
- Daily rates hold near $1,246
Low Season (July, August, September)
- Revenue drops to average $9,309 per month
- Occupancy decreases to average 33.7%
- Daily rates adjust to average $1,072
Seasonality Insights for Paradise Valley
- The Airbnb seasonality in Paradise Valley shows highly seasonal trends requiring careful strategy. While the sections above show seasonal averages, it's also insightful to look at the extremes:
- During the high season, the absolute peak month showcases Paradise Valley's highest earning potential, with monthly revenues capable of climbing to $22,418, occupancy reaching a high of 57.7%, and ADRs peaking at $1,436.
- Conversely, the slowest single month of the year, typically falling within the low season, marks the market's lowest point. In this month, revenue might dip to $9,087, occupancy could drop to 33.0%, and ADRs may adjust down to $1,047.
- Understanding both the seasonal averages and these monthly peaks and troughs in revenue, occupancy, and ADR is crucial for maximizing your Airbnb profit potential in Paradise Valley.
Seasonal Strategies for Maximizing Profit
- Peak Season: Maximize revenue through premium pricing and potentially longer minimum stays. Ensure high availability.
- Low Season: Offer competitive pricing, special promotions (e.g., extended stay discounts), and flexible cancellation policies. Target off-season travelers like remote workers or budget-conscious guests.
- Shoulder Seasons: Implement dynamic pricing that balances peak and low rates. Target weekend travelers or specific events. Offer slightly more flexible terms than peak season.
- Regularly analyze your own performance against these Paradise Valley seasonality benchmarks and adjust your pricing and availability strategy accordingly.
Best Areas for Airbnb Investment in Paradise Valley (2026)
Exploring the top neighborhoods for short-term rentals in Paradise Valley? This section highlights key areas, outlining why they are attractive for hosts and guests, along with notable local attractions. Consider these locations based on your target guest profile and investment strategy.
| Neighborhood / Area | Why Host Here? (Target Guests & Appeal) | Key Attractions & Landmarks |
|---|---|---|
| Camelback Mountain | A stunning natural landmark offering hiking, beautiful views, and outdoor activities. Ideal for nature lovers and those seeking adventure. | Camelback Mountain Trail, Echo Canyon Recreation Area, Desert Botanical Garden, Phoenix Zoo, Piestewa Peak |
| Old Town Scottsdale | A vibrant area known for its art galleries, nightlife, and western charm. Attracts tourists looking for fun and culture in a lively setting. | Scottsdale Waterfront, Scottsdale Museum of Contemporary Art, Old Town Art Walk, Restaurants and Bars, Shopping Districts |
| Paradise Valley Estates | Upscale community offering luxury homes and resort-style living. Popular among visitors seeking luxury and tranquility. | Dominique's at The Boulders, Mountain Shadows Resort, Spa and Wellness Centers, Golf Courses, High-end Dining |
| Phoenix Mountain Preserve | A natural preserve with trails for hiking and biking, favorable for those who appreciate outdoor activities in a picturesque environment. | Piestewa Peak, Squaw Peak, Hiking Trails, Scenic Overlooks, Wildlife Viewing |
| Taliesin West | Frank Lloyd Wright's winter home and school, a National Historic Landmark attracting architecture enthusiasts and tourists interested in design. | Taliesin West Tours, Architecture Tours, Sculpture Garden, Art Galleries, Nature Trails |
| Desert Ridge | An upscale community with shopping, dining, and recreational options, appealing to families and those seeking convenience and comfort. | Desert Ridge Marketplace, Golf Courses, Parks, Restaurants, Entertainment Venues |
| Biltmore Area | Known for its luxury resorts, shopping, and golf courses, perfect for travelers looking for a lavish getaway in a beautiful setting. | Arizona Biltmore Resort, Biltmore Fashion Park, Golf Courses, Spa Services, Fine Dining |
| Saguaro Lake | A scenic lake located in the Tonto National Forest, ideal for outdoor activities like boating, fishing, and hiking, attracts nature lovers. | Saguaro Lake, Boating and Fishing, Hiking Trails, Tonto National Forest, Picnic Areas |
Understanding Airbnb License Requirements & STR Laws in Paradise Valley (2026)
While Paradise Valley, Arizona, United States currently shows low STR regulations, specific Airbnb license requirements might still exist or change. Always verify the latest short term rental regulations and Airbnb license requirements directly with local government authorities for Paradise Valley to ensure full compliance before hosting.
(Source: AirROI data, 2026, finding no licensed listings among those analyzed)
Top Performing Airbnb Properties in Paradise Valley (2026)
Benchmark your potential! Explore examples of top-performing Airbnb properties in Paradise Valleybased on Trailing Twelve Month (TTM) revenue. Analyze their characteristics, revenue, occupancy rate, and ADR to understand what drives success in this market.
Mansion on the Mountain
Entire Place • 7 bedrooms
Luxury 7BR Dream Villa Top of Camelback Best Views
Entire Place • 7 bedrooms

Casa de Camelback- Views and location!
Entire Place • 7 bedrooms

Luxury retreat with lazy river and guest casita
Entire Place • 7 bedrooms

Scottsdale Family Estate: Pool, Spa & Pickleball
Entire Place • 5 bedrooms

Modern estate w/heated pool & hot tub
Entire Place • 6 bedrooms
Note: Performance varies based on location, size, amenities, seasonality, and management quality. Data reflects the past 12 months.
Top Performing Airbnb Hosts in Paradise Valley (2026)
Learn from the best! This table showcases top-performing Airbnb hosts in Paradise Valley based on the number of properties managed and estimated total revenue over the past year. Analyze their scale and performance metrics.
| Host Name | Properties | Grossing Revenue | Stay Reviews | Avg Rating |
|---|---|---|---|---|
| Holiday Rental | 5 | $659,463 | 9 | 5.00/5.0 |
| Porter | 3 | $618,331 | 90 | 4.89/5.0 |
| Revana | 3 | $577,801 | 12 | 4.93/5.0 |
| Travli Hospitality | 2 | $414,094 | 64 | 4.99/5.0 |
| AvantStay Scottsdale | 3 | $393,495 | 102 | 4.58/5.0 |
| Tiffany | 1 | $361,674 | 47 | 4.98/5.0 |
| GoodNight | 2 | $340,125 | 80 | 4.46/5.0 |
| Camelback Collection | 1 | $326,562 | 33 | 4.76/5.0 |
| Mary | 2 | $292,837 | 9 | 4.92/5.0 |
| Kelsey | 1 | $285,653 | 10 | 5.00/5.0 |
Analyzing the strategies of top hosts, such as their property selection, pricing, and guest communication, can offer valuable lessons for optimizing your own Airbnb operations in Paradise Valley.
Dive Deeper: Advanced Paradise Valley STR Market Data (2026)
Ready to unlock more insights? AirROI provides access to advanced metrics and comprehensive Airbnb data for Paradise Valley. Explore detailed analytics beyond this report to refine your investment strategy, optimize pricing, and maximize your vacation rental profits.
Explore Advanced MetricsParadise Valley Short-Term Rental Market Composition (2026): Property & Room Types
Room Type Distribution
Property Type Distribution
Market Composition Insights for Paradise Valley
- The Paradise Valley Airbnb market composition is heavily skewed towards Entire Home/Apt listings, which make up 97% of the 67 active rentals. This indicates strong guest preference for privacy and space.
- Looking at the property type distribution in Paradise Valley, House properties are the most common (83.6%), reflecting the local real estate landscape.
- Houses represent a significant 83.6% portion, catering likely to families or larger groups.
- The presence of 10.4% Hotel/Boutique listings indicates integration with traditional hospitality.
- Smaller segments like apartment/condo, others (combined 6.0%) offer potential for unique stay experiences.
Paradise Valley Airbnb Room Capacity Analysis (2026): Bedroom Distribution
Distribution of Listings by Number of Bedrooms
Room Capacity Insights for Paradise Valley
- The dominant room capacity in Paradise Valley is 5+ bedrooms listings, making up 67.2% of the market. This suggests a strong demand for properties suitable for families or small groups.
- Together, 5+ bedrooms and 4 bedrooms properties represent 80.6% of the active Airbnb listings in Paradise Valley, indicating a high concentration in these sizes.
- A significant 82.1% of listings offer 3+ bedrooms, catering to larger groups and families seeking more space in Paradise Valley.
Paradise Valley Vacation Rental Guest Capacity Trends (2026)
Distribution of Listings by Guest Capacity
Guest Capacity Insights for Paradise Valley
- The most common guest capacity trend in Paradise Valley vacation rentals is listings accommodating 8+ guests (80.6%). This suggests the primary traveler segment is likely larger groups.
- Properties designed for 8+ guests and 4 guests dominate the Paradise Valley STR market, accounting for 91.0% of listings.
- 82.1% of properties accommodate 6+ guests, serving the market segment for larger families or group travel in Paradise Valley.
- On average, properties in Paradise Valley are equipped to host 7.1 guests.
Paradise Valley Airbnb Booking Patterns (2026): Available vs. Booked Days
Available Days Distribution
Booked Days Distribution
Booking Pattern Insights for Paradise Valley
- The most common availability pattern in Paradise Valley falls within the 181-270 days range, representing 46.3% of listings. This suggests many properties have significant open periods on their calendars.
- Approximately 88.1% of listings show high availability (181+ days open annually), indicating potential for increased bookings or specific owner usage patterns.
- For booked days, the 91-180 days range is most frequent in Paradise Valley (46.3%), reflecting common guest stay durations or potential owner blocking patterns.
- A notable 12.0% of properties secure long booking periods (181+ days booked per year), highlighting successful long-term rental strategies or significant owner usage.
Paradise Valley Airbnb Minimum Stay Requirements Analysis
Distribution of Listings by Minimum Night Requirement
1 Night
3 listings
4.5% of total
2 Nights
15 listings
22.4% of total
3 Nights
9 listings
13.4% of total
4-6 Nights
3 listings
4.5% of total
7-29 Nights
1 listings
1.5% of total
30+ Nights
36 listings
53.7% of total
Key Insights
- The most prevalent minimum stay requirement in Paradise Valley is 30+ Nights, adopted by 53.7% of listings. This highlights the market's preference for longer commitments.
- A significant segment (53.7%) caters to monthly stays (30+ nights) in Paradise Valley, pointing to opportunities in the extended-stay market.
Recommendations
- Align with the market by considering a 30+ Nights minimum stay, as 53.7% of Paradise Valley hosts use this setting.
- If feasible, allowing 1-night stays, especially midweek or during low season, could capture last-minute bookings, as only 4.5% currently do.
- Explore offering discounts for stays of 30+ nights to attract the 53.7% of the market seeking extended stays.
- Adjust minimum nights based on seasonality – potentially shorter during low season and longer during peak demand periods in Paradise Valley.
Paradise Valley Airbnb Cancellation Policy Trends Analysis (2026)
Super Strict 60 Days
6 listings
9% of total
Super Strict 30 Days
6 listings
9% of total
Limited
1 listings
1.5% of total
Flexible
7 listings
10.4% of total
Moderate
6 listings
9% of total
Firm
31 listings
46.3% of total
Strict
10 listings
14.9% of total
Cancellation Policy Insights for Paradise Valley
- The prevailing Airbnb cancellation policy trend in Paradise Valley is Firm, used by 46.3% of listings.
- A majority (61.2%) of hosts in Paradise Valley utilize Firm or Strict policies, indicating a market where hosts prioritize booking security.
Recommendations for Hosts
- Consider adopting a Firm policy to align with the 46.3% market standard in Paradise Valley.
- Using a Strict policy might deter some guests, as only 14.9% of listings use it. Evaluate if potential revenue protection outweighs possible lower booking rates.
- Regularly review your cancellation policy against competitors and market demand shifts in Paradise Valley.
Paradise Valley STR Booking Lead Time Analysis (2026)
Average Booking Lead Time by Month
Booking Lead Time Insights for Paradise Valley
- The overall average booking lead time for vacation rentals in Paradise Valley is 66 days.
- Guests book furthest in advance for stays during October (average 109 days), likely coinciding with peak travel demand or local events.
- The shortest booking windows occur for stays in July (average 34 days), indicating more last-minute travel plans during this time.
- Seasonally, Fall (88 days avg.) sees the longest lead times, while Summer (40 days avg.) has the shortest, reflecting typical travel planning cycles.
Recommendations for Hosts
- Use the overall average lead time (66 days) as a baseline for your pricing and availability strategy in Paradise Valley.
- For October stays, consider implementing length-of-stay discounts or slightly higher rates for bookings made less than 109 days out to capitalize on advance planning.
- Target marketing efforts for the Fall season well in advance (at least 88 days) to capture early planners.
- Monitor your own booking lead times against these Paradise Valley averages to identify opportunities for dynamic pricing adjustments.
Popular & Essential Airbnb Amenities in Paradise Valley (2026)
Amenity Prevalence
Amenity Insights for Paradise Valley
- Essential amenities in Paradise Valley that guests expect include: TV, Wifi, Smoke alarm, Dishes and silverware, Air conditioning, Heating, Coffee maker, Kitchen, Microwave, Dryer. Lacking these (any) could significantly impact bookings.
Recommendations for Hosts
- Ensure your listing includes all essential amenities for Paradise Valley: TV, Wifi, Smoke alarm, Dishes and silverware, Air conditioning, Heating, Coffee maker, Kitchen, Microwave, Dryer.
- Prioritize adding missing essentials: Smoke alarm, Dishes and silverware, Air conditioning, Heating, Coffee maker, Kitchen, Microwave, Dryer.
- Highlight unique or less common amenities you offer (e.g., hot tub, dedicated workspace, EV charger) in your listing description and photos.
- Regularly check competitor amenities in Paradise Valley to stay competitive.
Paradise Valley Airbnb Guest Demographics & Profile Analysis (2026)
Guest Profile Summary for Paradise Valley
- The typical guest profile for Airbnb in Paradise Valley consists of primarily domestic travelers (94%), often arriving from nearby Phoenix, typically belonging to the Post-2000s (Gen Z/Alpha) group (50%), primarily speaking English or Spanish.
- Domestic travelers account for 94.4% of guests.
- Key international markets include United States (94.4%) and Canada (4%).
- Top languages spoken are English (79.2%) followed by Spanish (12.8%).
- A significant demographic segment is the Post-2000s (Gen Z/Alpha) group, representing 50% of guests.
Recommendations for Hosts
- Target domestic marketing efforts towards travelers from Phoenix and New York.
- Tailor amenities and listing descriptions to appeal to the dominant Post-2000s (Gen Z/Alpha) demographic (e.g., highlight fast WiFi, smart home features, local guides).
- Highlight unique local experiences or amenities relevant to the primary guest profile.
- Consider seasonal promotions aligned with peak travel times for key origin markets.
Nearby Short-Term Rental Market Comparison
How does the Paradise Valley Airbnb market stack up against its neighbors? Compare key performance metrics like average monthly revenue, ADR, and occupancy rates in surrounding areas to understand the broader regional STR landscape.
| Market | Active Properties | Monthly Revenue | Daily Rate | Avg. Occupancy |
|---|---|---|---|---|
| Sedona | 1,658 | $5,761 | $410.99 | 50% |
| Sedona City Limit | 372 | $4,884 | $333.39 | 51% |
| Scottsdale | 4,331 | $4,202 | $370.53 | 47% |
| Carefree | 31 | $4,052 | $522.63 | 39% |
| Cave Creek | 132 | $4,016 | $399.83 | 42% |
| Big Park | 427 | $3,618 | $294.75 | 47% |
| Fountain Hills | 215 | $3,506 | $356.69 | 45% |
| Star Valley | 12 | $3,374 | $279.20 | 43% |
| Payson town limits | 44 | $3,258 | $293.23 | 44% |
| Gilbert | 618 | $3,117 | $255.30 | 50% |