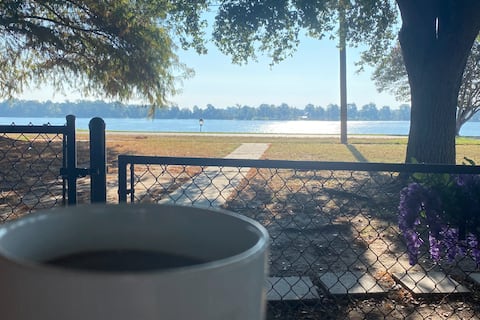
Lake Village Airbnb Market Analysis 2026: Short Term Rental Data & Vacation Rental Statistics in Arkansas, United States
Is Airbnb profitable in Lake Village in 2026? Explore comprehensive Airbnb analytics for Lake Village, Arkansas, United States to uncover income potential. This 2026 STR market report for Lake Village, based on AirROI data from February 2025 to January 2026, reveals key trends in the niche market of 24 active listings.
Whether you're considering an Airbnb investment in Lake Village, optimizing your existing vacation rental, or exploring rental arbitrage opportunities, understanding the Lake Village Airbnb data is crucial. Leveraging the low regulation environment is key to maximizing your short term rental income potential. Let's dive into the specifics.
Key Lake Village Airbnb Performance Metrics Overview
Monthly Airbnb Revenue Variations & Income Potential in Lake Village (2026)
Understanding the monthly revenue variations for Airbnb listings in Lake Village is key to maximizing your short term rental income potential. Seasonality significantly impacts earnings. Our analysis, based on data from the past 12 months, shows that the peak revenue month for STRs in Lake Village is typically March, while February often presents the lowest earnings, highlighting opportunities for strategic pricing adjustments during shoulder and low seasons. Explore the typical Airbnb income in Lake Village across different performance tiers:
- Best-in-class properties (Top 10%) achieve $3,256+ monthly, often utilizing dynamic pricing and superior guest experiences.
- Strong performing properties (Top 25%) earn $2,315 or more, indicating effective management and desirable locations/amenities.
- Typical properties (Median) generate around $1,747 per month, representing the average market performance.
- Entry-level properties (Bottom 25%) see earnings around $1,075, often with potential for optimization.
Average Monthly Airbnb Earnings Trend in Lake Village
Lake Village Airbnb Occupancy Rate Trends (2026)
Maximize your bookings by understanding the Lake Village STR occupancy trends. Seasonal demand shifts significantly influence how often properties are booked. Typically, Octobersees the highest demand (peak season occupancy), while January experiences the lowest (low season). Effective strategies, like adjusting minimum stays or offering promotions, can boost occupancy during slower periods. Here's how different property tiers perform in Lake Village:
- Best-in-class properties (Top 10%) achieve 70%+ occupancy, indicating high desirability and potentially optimized availability.
- Strong performing properties (Top 25%) maintain 55% or higher occupancy, suggesting good market fit and guest satisfaction.
- Typical properties (Median) have an occupancy rate around 40%.
- Entry-level properties (Bottom 25%) average 24% occupancy, potentially facing higher vacancy.
Average Monthly Occupancy Rate Trend in Lake Village
Average Daily Rate (ADR) Airbnb Trends in Lake Village (2026)
Effective short term rental pricing strategy in Lake Village involves understanding monthly ADR fluctuations. The Average Daily Rate (ADR) for Airbnb in Lake Village typically peaks in January and dips lowest during February. Leveraging Airbnb dynamic pricing tools or strategies based on this seasonality can significantly boost revenue. Here's a look at the typical nightly rates achieved:
- Best-in-class properties (Top 10%) command rates of $216+ per night, often due to premium features or locations.
- Strong performing properties (Top 25%) achieve nightly rates of $164 or more.
- Typical properties (Median) charge around $138 per night.
- Entry-level properties (Bottom 25%) earn around $114 per night.
Average Daily Rate (ADR) Trend by Month in Lake Village
Get Live Lake Village Market Intelligence 👇

Explore Real-time Analytics
Airbnb Seasonality Analysis & Trends in Lake Village (2026)
Peak Season (March, October, August)
- Revenue averages $2,202 per month
- Occupancy rates average 47.5%
- Daily rates average $144
Shoulder Season
- Revenue averages $1,913 per month
- Occupancy maintains around 41.3%
- Daily rates hold near $146
Low Season (January, February, December)
- Revenue drops to average $1,507 per month
- Occupancy decreases to average 35.3%
- Daily rates adjust to average $147
Seasonality Insights for Lake Village
- The Airbnb seasonality in Lake Village shows moderate seasonality with distinct peak and low periods. While the sections above show seasonal averages, it's also insightful to look at the extremes:
- During the high season, the absolute peak month showcases Lake Village's highest earning potential, with monthly revenues capable of climbing to $2,296, occupancy reaching a high of 50.4%, and ADRs peaking at $159.
- Conversely, the slowest single month of the year, typically falling within the low season, marks the market's lowest point. In this month, revenue might dip to $1,448, occupancy could drop to 30.8%, and ADRs may adjust down to $131.
- Understanding both the seasonal averages and these monthly peaks and troughs in revenue, occupancy, and ADR is crucial for maximizing your Airbnb profit potential in Lake Village.
Seasonal Strategies for Maximizing Profit
- Peak Season: Maximize revenue through premium pricing and potentially longer minimum stays. Ensure high availability.
- Low Season: Offer competitive pricing, special promotions (e.g., extended stay discounts), and flexible cancellation policies. Target off-season travelers like remote workers or budget-conscious guests.
- Shoulder Seasons: Implement dynamic pricing that balances peak and low rates. Target weekend travelers or specific events. Offer slightly more flexible terms than peak season.
- Regularly analyze your own performance against these Lake Village seasonality benchmarks and adjust your pricing and availability strategy accordingly.
Best Areas for Airbnb Investment in Lake Village (2026)
Exploring the top neighborhoods for short-term rentals in Lake Village? This section highlights key areas, outlining why they are attractive for hosts and guests, along with notable local attractions. Consider these locations based on your target guest profile and investment strategy.
| Neighborhood / Area | Why Host Here? (Target Guests & Appeal) | Key Attractions & Landmarks |
|---|---|---|
| Lake Village Downtown | The heart of Lake Village featuring local shops, restaurants, and access to the scenic Lake Chicot. Attractive to travelers seeking a small-town vibe with convenient amenities. | Lake Chicot State Park, Local eateries, Historic buildings, Lake Chicot, Downtown shops |
| Lake Chicot State Park | A natural gem offering outdoor activities like fishing, boating, and hiking. Ideal for nature lovers and those seeking relaxation amidst beautiful landscapes. | Fishing and boating, Hiking trails, Picnic areas, Wildlife viewing, Campground |
| Cane Creek State Park | A serene park located nearby that offers camping, hiking, and fishing opportunities, attracting outdoor enthusiasts and families looking for weekend getaways. | Cane Creek Lake, Fishing and kayaking, Hiking trails, Camping facilities, Wildlife observation |
| Pine Hills Golf Club | A local golf course that attracts golfers from the region. Golf enthusiasts often look for nearby accommodation for golf trips and weekend outings. | Golfing, Beautiful scenery, Clubhouse amenities, Golf events, Outdoor relaxation |
| Nearby Greenville, MS | A short drive from Lake Village, Greenville offers additional dining and entertainment options making it attractive for those seeking more urban activities nearby. | Delta Cultural Center, Parker's Crossroads, Local restaurants and bars, Riverfront Park, Shopping options |
| Chicot County Courthouse | A historic landmark in Lake Village that attracts visitors interested in history and architecture. A key attraction for those exploring the area's heritage. | Historical architecture, Local heritage tours, Photography opportunities, Art installations, Cultural events |
| Local Festivals and Events | Lake Village hosts various community events and festivals throughout the year, drawing visitors looking for unique local experiences and local culture. | Annual Fair, Art and Craft Festivals, Music Festivals, Food Fairs, Cultural Activities |
| Scenic Boat Rides on Lake Chicot | Tourists are often drawn to scenic boat rides on Lake Chicot for beautiful views and relaxation. Ideal for those looking for leisure activities on the water. | Boat rental services, Guided tours, Sunset cruises, Wildlife exploration, Fishing excursions |
Understanding Airbnb License Requirements & STR Laws in Lake Village (2026)
While Lake Village, Arkansas, United States currently shows low STR regulations, specific Airbnb license requirements might still exist or change. Always verify the latest short term rental regulations and Airbnb license requirements directly with local government authorities for Lake Village to ensure full compliance before hosting.
(Source: AirROI data, 2026, based on 4% licensed listings)
Top Performing Airbnb Properties in Lake Village (2026)
Benchmark your potential! Explore examples of top-performing Airbnb properties in Lake Villagebased on Trailing Twelve Month (TTM) revenue. Analyze their characteristics, revenue, occupancy rate, and ADR to understand what drives success in this market.
Our Little Lake Getaway
Entire Place • 3 bedrooms

Lake views in family sized cabin for up to 9!
Entire Place • 3 bedrooms

Watch the sunrise w/ your family on Lake Chicot!
Entire Place • 3 bedrooms

Lake front retreat on Lake Chicot!
Entire Place • 1 bedroom

Family Fun by the Lake!
Entire Place • 2 bedrooms

Fishing cabin with views on Lake Chicot!
Entire Place • 1 bedroom
Note: Performance varies based on location, size, amenities, seasonality, and management quality. Data reflects the past 12 months.
Top Performing Airbnb Hosts in Lake Village (2026)
Learn from the best! This table showcases top-performing Airbnb hosts in Lake Village based on the number of properties managed and estimated total revenue over the past year. Analyze their scale and performance metrics.
| Host Name | Properties | Grossing Revenue | Stay Reviews | Avg Rating |
|---|---|---|---|---|
| Amber | 16 | $277,025 | 531 | 4.75/5.0 |
| Megan | 1 | $53,306 | 36 | 4.97/5.0 |
| Helen | 3 | $18,824 | 26 | 4.69/5.0 |
| Jonathan | 1 | $18,696 | 151 | 4.91/5.0 |
| Briona | 1 | $15,932 | 57 | 4.75/5.0 |
| Host #406972781 | 1 | $7,489 | 0 | Not Rated |
| Evolve | 1 | $7,165 | 17 | 4.88/5.0 |
Analyzing the strategies of top hosts, such as their property selection, pricing, and guest communication, can offer valuable lessons for optimizing your own Airbnb operations in Lake Village.
Dive Deeper: Advanced Lake Village STR Market Data (2026)
Ready to unlock more insights? AirROI provides access to advanced metrics and comprehensive Airbnb data for Lake Village. Explore detailed analytics beyond this report to refine your investment strategy, optimize pricing, and maximize your vacation rental profits.
Explore Advanced MetricsLake Village Short-Term Rental Market Composition (2026): Property & Room Types
Room Type Distribution
Property Type Distribution
Market Composition Insights for Lake Village
- The Lake Village Airbnb market composition is heavily skewed towards Entire Home/Apt listings, which make up 100% of the 24 active rentals. This indicates strong guest preference for privacy and space.
- Looking at the property type distribution in Lake Village, Outdoor/Unique properties are the most common (41.7%), reflecting the local real estate landscape.
- Houses represent a significant 25% portion, catering likely to families or larger groups.
Lake Village Airbnb Room Capacity Analysis (2026): Bedroom Distribution
Distribution of Listings by Number of Bedrooms
Room Capacity Insights for Lake Village
- The dominant room capacity in Lake Village is 1 bedroom listings, making up 45.8% of the market. This suggests a strong demand for properties suitable for couples or solo travelers.
- Together, 1 bedroom and 2 bedrooms properties represent 79.1% of the active Airbnb listings in Lake Village, indicating a high concentration in these sizes.
- A significant 20.8% of listings offer 3+ bedrooms, catering to larger groups and families seeking more space in Lake Village.
Lake Village Vacation Rental Guest Capacity Trends (2026)
Distribution of Listings by Guest Capacity
Guest Capacity Insights for Lake Village
- The most common guest capacity trend in Lake Village vacation rentals is listings accommodating 6 guests (25%). This suggests the primary traveler segment is likely larger groups.
- Properties designed for 6 guests and 2 guests dominate the Lake Village STR market, accounting for 50.0% of listings.
- 41.7% of properties accommodate 6+ guests, serving the market segment for larger families or group travel in Lake Village.
- On average, properties in Lake Village are equipped to host 4.6 guests.
Lake Village Airbnb Booking Patterns (2026): Available vs. Booked Days
Available Days Distribution
Booked Days Distribution
Booking Pattern Insights for Lake Village
- The most common availability pattern in Lake Village falls within the 271-366 days range, representing 45.8% of listings. This suggests many properties have significant open periods on their calendars.
- Approximately 79.1% of listings show high availability (181+ days open annually), indicating potential for increased bookings or specific owner usage patterns.
- For booked days, the 91-180 days range is most frequent in Lake Village (37.5%), reflecting common guest stay durations or potential owner blocking patterns.
- A notable 20.8% of properties secure long booking periods (181+ days booked per year), highlighting successful long-term rental strategies or significant owner usage.
Lake Village Airbnb Minimum Stay Requirements Analysis
Distribution of Listings by Minimum Night Requirement
1 Night
16 listings
66.7% of total
2 Nights
3 listings
12.5% of total
3 Nights
1 listings
4.2% of total
30+ Nights
4 listings
16.7% of total
Key Insights
- The most prevalent minimum stay requirement in Lake Village is 1 Night, adopted by 66.7% of listings. This highlights the market's preference for shorter, flexible bookings.
- A strong majority (79.2%) of the Lake Village Airbnb data shows acceptance of very short stays (1-2 nights), indicating a dynamic, high-turnover market.
- A significant segment (16.7%) caters to monthly stays (30+ nights) in Lake Village, pointing to opportunities in the extended-stay market.
Recommendations
- Align with the market by considering a 1 Night minimum stay, as 66.7% of Lake Village hosts use this setting.
- Explore offering discounts for stays of 30+ nights to attract the 16.7% of the market seeking extended stays.
- Adjust minimum nights based on seasonality – potentially shorter during low season and longer during peak demand periods in Lake Village.
Lake Village Airbnb Cancellation Policy Trends Analysis (2026)
Flexible
18 listings
75% of total
Moderate
2 listings
8.3% of total
Firm
2 listings
8.3% of total
Strict
2 listings
8.3% of total
Cancellation Policy Insights for Lake Village
- The prevailing Airbnb cancellation policy trend in Lake Village is Flexible, used by 75% of listings.
- The market strongly favors guest-friendly terms, with 83.3% of listings offering Flexible or Moderate policies. This suggests guests in Lake Village may expect booking flexibility.
- Strict cancellation policies are quite rare (8.3%), potentially making listings with this policy less competitive unless justified by high demand or property type.
Recommendations for Hosts
- Consider adopting a Flexible policy to align with the 75% market standard in Lake Village.
- Given the high prevalence of Flexible policies (75%), offering this can enhance booking appeal, especially during shoulder seasons.
- Using a Strict policy might deter some guests, as only 8.3% of listings use it. Evaluate if potential revenue protection outweighs possible lower booking rates.
- Regularly review your cancellation policy against competitors and market demand shifts in Lake Village.
Lake Village STR Booking Lead Time Analysis (2026)
Average Booking Lead Time by Month
Booking Lead Time Insights for Lake Village
- The overall average booking lead time for vacation rentals in Lake Village is 37 days.
- Guests book furthest in advance for stays during October (average 71 days), likely coinciding with peak travel demand or local events.
- The shortest booking windows occur for stays in January (average 7 days), indicating more last-minute travel plans during this time.
- Seasonally, Fall (52 days avg.) sees the longest lead times, while Summer (23 days avg.) has the shortest, reflecting typical travel planning cycles.
Recommendations for Hosts
- Use the overall average lead time (37 days) as a baseline for your pricing and availability strategy in Lake Village.
- For October stays, consider implementing length-of-stay discounts or slightly higher rates for bookings made less than 71 days out to capitalize on advance planning.
- During January, focus on last-minute booking availability and promotions, as guests book with very short notice (7 days avg.).
- Target marketing efforts for the Fall season well in advance (at least 52 days) to capture early planners.
- Monitor your own booking lead times against these Lake Village averages to identify opportunities for dynamic pricing adjustments.
Popular & Essential Airbnb Amenities in Lake Village (2026)
Amenity Prevalence
Amenity Insights for Lake Village
- Essential amenities in Lake Village that guests expect include: Free parking on premises, Air conditioning, Smoke alarm, TV, Wifi. Lacking these (any) could significantly impact bookings.
- Popular amenities like Pets allowed, Refrigerator, Essentials are common but not universal. Offering these can provide a competitive edge.
Recommendations for Hosts
- Ensure your listing includes all essential amenities for Lake Village: Free parking on premises, Air conditioning, Smoke alarm, TV, Wifi.
- Prioritize adding missing essentials: Wifi.
- Consider adding popular differentiators like Pets allowed or Refrigerator to increase appeal.
- Highlight unique or less common amenities you offer (e.g., hot tub, dedicated workspace, EV charger) in your listing description and photos.
- Regularly check competitor amenities in Lake Village to stay competitive.
Lake Village Airbnb Guest Demographics & Profile Analysis (2026)
Guest Profile Summary for Lake Village
- The typical guest profile for Airbnb in Lake Village consists of primarily domestic travelers (95%), often arriving from nearby White Hall, typically belonging to the Post-2000s (Gen Z/Alpha) group (50%), primarily speaking English or French.
- Domestic travelers account for 94.8% of guests.
- Key international markets include United States (94.8%) and United Kingdom (2.2%).
- Top languages spoken are English (86.6%) followed by French (6%).
- A significant demographic segment is the Post-2000s (Gen Z/Alpha) group, representing 50% of guests.
Recommendations for Hosts
- Target domestic marketing efforts towards travelers from White Hall and Youngsville.
- Tailor amenities and listing descriptions to appeal to the dominant Post-2000s (Gen Z/Alpha) demographic (e.g., highlight fast WiFi, smart home features, local guides).
- Highlight unique local experiences or amenities relevant to the primary guest profile.
- Consider seasonal promotions aligned with peak travel times for key origin markets.
Nearby Short-Term Rental Market Comparison
How does the Lake Village Airbnb market stack up against its neighbors? Compare key performance metrics like average monthly revenue, ADR, and occupancy rates in surrounding areas to understand the broader regional STR landscape.
| Market | Active Properties | Monthly Revenue | Daily Rate | Avg. Occupancy |
|---|---|---|---|---|
| Jonesboro | 11 | $2,988 | $229.32 | 42% |
| Homer | 11 | $2,891 | $236.92 | 40% |
| Fountain Lake | 10 | $2,710 | $258.81 | 39% |
| Chatham | 10 | $2,339 | $187.26 | 46% |
| Farmerville | 28 | $2,279 | $196.18 | 40% |
| Greenville | 15 | $2,128 | $237.86 | 34% |
| Cleveland | 18 | $2,118 | $201.82 | 37% |
| Big Rock Township | 19 | $1,958 | $166.83 | 43% |
| Brandon | 80 | $1,917 | $196.65 | 40% |
| Ruston | 75 | $1,896 | $178.05 | 41% |