Piney Airbnb Market Analysis 2026: Short Term Rental Data & Vacation Rental Statistics in Arkansas, United States
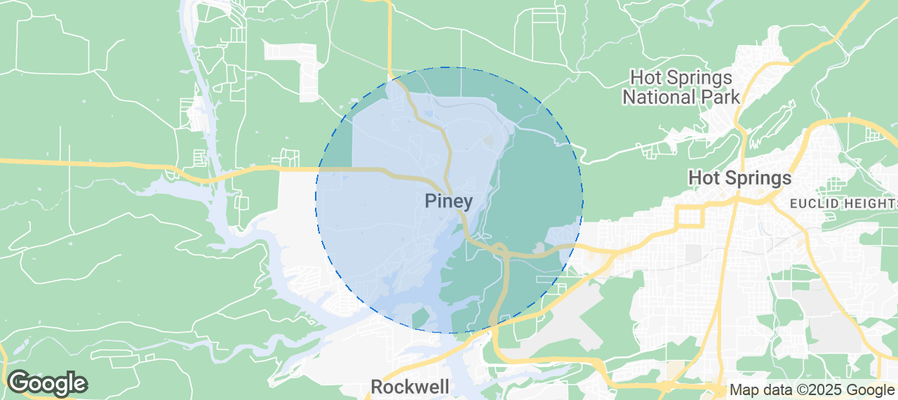
Is Airbnb profitable in Piney in 2026? Explore comprehensive Airbnb analytics for Piney, Arkansas, United States to uncover income potential. This 2026 STR market report for Piney, based on AirROI data from February 2025 to January 2026, reveals key trends in the niche market of 24 active listings.
Whether you're considering an Airbnb investment in Piney, optimizing your existing vacation rental, or exploring rental arbitrage opportunities, understanding the Piney Airbnb data is crucial. Leveraging the low regulation environment is key to maximizing your short term rental income potential. Let's dive into the specifics.
Key Piney Airbnb Performance Metrics Overview
Monthly Airbnb Revenue Variations & Income Potential in Piney (2026)
Understanding the monthly revenue variations for Airbnb listings in Piney is key to maximizing your short term rental income potential. Seasonality significantly impacts earnings. Our analysis, based on data from the past 12 months, shows that the peak revenue month for STRs in Piney is typically June, while January often presents the lowest earnings, highlighting opportunities for strategic pricing adjustments during shoulder and low seasons. Explore the typical Airbnb income in Piney across different performance tiers:
- Best-in-class properties (Top 10%) achieve $10,232+ monthly, often utilizing dynamic pricing and superior guest experiences.
- Strong performing properties (Top 25%) earn $5,968 or more, indicating effective management and desirable locations/amenities.
- Typical properties (Median) generate around $3,215 per month, representing the average market performance.
- Entry-level properties (Bottom 25%) see earnings around $1,796, often with potential for optimization.
Average Monthly Airbnb Earnings Trend in Piney
Piney Airbnb Occupancy Rate Trends (2026)
Maximize your bookings by understanding the Piney STR occupancy trends. Seasonal demand shifts significantly influence how often properties are booked. Typically, Marchsees the highest demand (peak season occupancy), while January experiences the lowest (low season). Effective strategies, like adjusting minimum stays or offering promotions, can boost occupancy during slower periods. Here's how different property tiers perform in Piney:
- Best-in-class properties (Top 10%) achieve 67%+ occupancy, indicating high desirability and potentially optimized availability.
- Strong performing properties (Top 25%) maintain 45% or higher occupancy, suggesting good market fit and guest satisfaction.
- Typical properties (Median) have an occupancy rate around 24%.
- Entry-level properties (Bottom 25%) average 13% occupancy, potentially facing higher vacancy.
Average Monthly Occupancy Rate Trend in Piney
Average Daily Rate (ADR) Airbnb Trends in Piney (2026)
Effective short term rental pricing strategy in Piney involves understanding monthly ADR fluctuations. The Average Daily Rate (ADR) for Airbnb in Piney typically peaks in January and dips lowest during April. Leveraging Airbnb dynamic pricing tools or strategies based on this seasonality can significantly boost revenue. Here's a look at the typical nightly rates achieved:
- Best-in-class properties (Top 10%) command rates of $763+ per night, often due to premium features or locations.
- Strong performing properties (Top 25%) achieve nightly rates of $509 or more.
- Typical properties (Median) charge around $397 per night.
- Entry-level properties (Bottom 25%) earn around $151 per night.
Average Daily Rate (ADR) Trend by Month in Piney
Get Live Piney Market Intelligence 👇
Explore Real-time Analytics
Airbnb Seasonality Analysis & Trends in Piney (2026)
Peak Season (June, July, March)
- Revenue averages $6,786 per month
- Occupancy rates average 41.6%
- Daily rates average $399
Shoulder Season
- Revenue averages $4,009 per month
- Occupancy maintains around 29.0%
- Daily rates hold near $381
Low Season (January, February, September)
- Revenue drops to average $2,802 per month
- Occupancy decreases to average 25.9%
- Daily rates adjust to average $386
Seasonality Insights for Piney
- The Airbnb seasonality in Piney shows highly seasonal trends requiring careful strategy. While the sections above show seasonal averages, it's also insightful to look at the extremes:
- During the high season, the absolute peak month showcases Piney's highest earning potential, with monthly revenues capable of climbing to $7,682, occupancy reaching a high of 42.9%, and ADRs peaking at $432.
- Conversely, the slowest single month of the year, typically falling within the low season, marks the market's lowest point. In this month, revenue might dip to $2,302, occupancy could drop to 18.9%, and ADRs may adjust down to $325.
- Understanding both the seasonal averages and these monthly peaks and troughs in revenue, occupancy, and ADR is crucial for maximizing your Airbnb profit potential in Piney.
Seasonal Strategies for Maximizing Profit
- Peak Season: Maximize revenue through premium pricing and potentially longer minimum stays. Ensure high availability.
- Low Season: Offer competitive pricing, special promotions (e.g., extended stay discounts), and flexible cancellation policies. Target off-season travelers like remote workers or budget-conscious guests.
- Shoulder Seasons: Implement dynamic pricing that balances peak and low rates. Target weekend travelers or specific events. Offer slightly more flexible terms than peak season.
- Regularly analyze your own performance against these Piney seasonality benchmarks and adjust your pricing and availability strategy accordingly.
Best Areas for Airbnb Investment in Piney (2026)
Exploring the top neighborhoods for short-term rentals in Piney? This section highlights key areas, outlining why they are attractive for hosts and guests, along with notable local attractions. Consider these locations based on your target guest profile and investment strategy.
| Neighborhood / Area | Why Host Here? (Target Guests & Appeal) | Key Attractions & Landmarks |
|---|---|---|
| DeGray Lake | A popular destination for outdoor enthusiasts, offering camping, fishing, and water sports. Ideal for vacationers looking for scenic experiences and nature activities. | DeGray Lake Resort State Park, Lake DeGray, Caddo River, Hiking Trails, Fishing Spots |
| Piney Bay | A serene area perfect for those seeking a quiet retreat. Great for families and individuals wanting to relax by the water in a tranquil setting. | Piney Bay Recreation Area, Lake Dardanelle, Hiking Trails, Scenic Overlooks |
| Hot Springs National Park | A historic and scenic area famous for its natural hot springs. Attracts tourists looking for wellness experiences and outdoor activities. | Hot Springs Bathhouse Row, Garvan Woodland Gardens, Lake Hamilton, Historic downtown Hot Springs |
| Little Rock | The capital city of Arkansas, offering rich historical experiences and cultural attractions. Appeals to business travelers and tourists interested in the city’s history. | Arkansas State Capitol, Little Rock Central High School National Historic Site, River Market District, William J. Clinton Presidential Library |
| Mount Ida | Known as the Quartz Crystal Capital of the World, Mount Ida is popular among rockhounds and outdoor adventurers. Great for families and nature lovers. | Crystal Mining, Lake Ouachita, Ouachita National Forest, Hiking and ATV Trails |
| Berryville | A charming town with a rich history and proximity to outdoor activities. Great for visitors looking for a peaceful small-town experience. | Historic Berryville Square, Ozark Mountains, Local Festivals, Fishing and Boating on the White River |
| Bearden | A quiet rural area that offers a unique experience with outdoor activities around farms and local culture. Suitable for those seeking local charm. | Rural Attractions, Local Farms, Fishing in Local Ponds, Scenic Views |
| Kensett | A small town near the White River, perfect for those looking for a quiet escape or fishing trips. Appeals to visitors wanting a simplistic lifestyle. | White River, Fishing Spots, Local Parks, Historical Sites |
Understanding Airbnb License Requirements & STR Laws in Piney (2026)
While Piney, Arkansas, United States currently shows low STR regulations, specific Airbnb license requirements might still exist or change. Always verify the latest short term rental regulations and Airbnb license requirements directly with local government authorities for Piney to ensure full compliance before hosting.
(Source: AirROI data, 2026, finding no licensed listings among those analyzed)
Top Performing Airbnb Properties in Piney (2026)
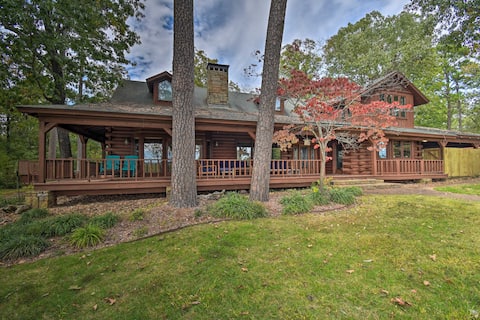
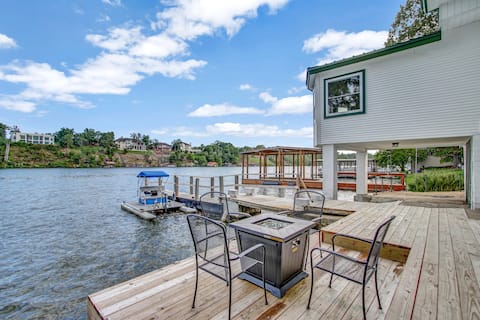
Benchmark your potential! Explore examples of top-performing Airbnb properties in Pineybased on Trailing Twelve Month (TTM) revenue. Analyze their characteristics, revenue, occupancy rate, and ADR to understand what drives success in this market.

Lakeside Retreat w/Pool, Hot Tub, Games & Dock
Entire Place • 6 bedrooms
Hot Tub, Grill: Hilltop Log Cabin in Hot Springs!
Entire Place • 4 bedrooms

Spacious Lakefront Home | Pool | Hot Tub | Fire Pi
Entire Place • 7 bedrooms
Lake Haven Chateau: Hot tub, Game Room and Boat
Entire Place • 3 bedrooms

The Little Grey Lakehouse
Entire Place • 4 bedrooms

Twin Lake Retreats: Kingfisher & Wild Orchid
Entire Place • 8 bedrooms
Note: Performance varies based on location, size, amenities, seasonality, and management quality. Data reflects the past 12 months.
Top Performing Airbnb Hosts in Piney (2026)
Learn from the best! This table showcases top-performing Airbnb hosts in Piney based on the number of properties managed and estimated total revenue over the past year. Analyze their scale and performance metrics.
| Host Name | Properties | Grossing Revenue | Stay Reviews | Avg Rating |
|---|---|---|---|---|
| Overnight Digs | 10 | $467,439 | 70 | 5.00/5.0 |
| James | 2 | $125,962 | 259 | 4.81/5.0 |
| Evolve | 1 | $98,207 | 75 | 4.96/5.0 |
| Black Swan Stays | 1 | $98,071 | 51 | 4.86/5.0 |
| Terry | 1 | $76,089 | 17 | 4.82/5.0 |
| Gail | 1 | $47,500 | 53 | 5.00/5.0 |
| Janet | 1 | $26,780 | 35 | 4.94/5.0 |
| Stan | 1 | $20,712 | 82 | 4.71/5.0 |
| Devon Allan | 4 | $9,761 | 52 | 4.51/5.0 |
| Jerry | 1 | $4,923 | 111 | 4.87/5.0 |
Analyzing the strategies of top hosts, such as their property selection, pricing, and guest communication, can offer valuable lessons for optimizing your own Airbnb operations in Piney.
Dive Deeper: Advanced Piney STR Market Data (2026)
Ready to unlock more insights? AirROI provides access to advanced metrics and comprehensive Airbnb data for Piney. Explore detailed analytics beyond this report to refine your investment strategy, optimize pricing, and maximize your vacation rental profits.
Explore Advanced MetricsPiney Short-Term Rental Market Composition (2026): Property & Room Types
Room Type Distribution
Property Type Distribution
Market Composition Insights for Piney
- The Piney Airbnb market composition is heavily skewed towards Entire Home/Apt listings, which make up 100% of the 24 active rentals. This indicates strong guest preference for privacy and space.
- Looking at the property type distribution in Piney, House properties are the most common (58.3%), reflecting the local real estate landscape.
- Houses represent a significant 58.3% portion, catering likely to families or larger groups.
Piney Airbnb Room Capacity Analysis (2026): Bedroom Distribution
Distribution of Listings by Number of Bedrooms
Room Capacity Insights for Piney
- The dominant room capacity in Piney is 4 bedrooms listings, making up 33.3% of the market. This suggests a strong demand for properties suitable for families or small groups.
- Together, 4 bedrooms and 5+ bedrooms properties represent 58.3% of the active Airbnb listings in Piney, indicating a high concentration in these sizes.
- A significant 75.0% of listings offer 3+ bedrooms, catering to larger groups and families seeking more space in Piney.
Piney Vacation Rental Guest Capacity Trends (2026)
Distribution of Listings by Guest Capacity
Guest Capacity Insights for Piney
- The most common guest capacity trend in Piney vacation rentals is listings accommodating 8+ guests (66.7%). This suggests the primary traveler segment is likely larger groups.
- Properties designed for 8+ guests and 6 guests dominate the Piney STR market, accounting for 75.0% of listings.
- 75.0% of properties accommodate 6+ guests, serving the market segment for larger families or group travel in Piney.
- On average, properties in Piney are equipped to host 6.8 guests.
Piney Airbnb Booking Patterns (2026): Available vs. Booked Days
Available Days Distribution
Booked Days Distribution
Booking Pattern Insights for Piney
- The most common availability pattern in Piney falls within the 271-366 days range, representing 66.7% of listings. This suggests many properties have significant open periods on their calendars.
- Approximately 83.4% of listings show high availability (181+ days open annually), indicating potential for increased bookings or specific owner usage patterns.
- For booked days, the 31-90 days range is most frequent in Piney (45.8%), reflecting common guest stay durations or potential owner blocking patterns.
- A notable 16.7% of properties secure long booking periods (181+ days booked per year), highlighting successful long-term rental strategies or significant owner usage.
Piney Airbnb Minimum Stay Requirements Analysis
Distribution of Listings by Minimum Night Requirement
1 Night
5 listings
20.8% of total
2 Nights
14 listings
58.3% of total
3 Nights
1 listings
4.2% of total
30+ Nights
4 listings
16.7% of total
Key Insights
- The most prevalent minimum stay requirement in Piney is 2 Nights, adopted by 58.3% of listings. This highlights the market's preference for shorter, flexible bookings.
- A strong majority (79.1%) of the Piney Airbnb data shows acceptance of very short stays (1-2 nights), indicating a dynamic, high-turnover market.
- A significant segment (16.7%) caters to monthly stays (30+ nights) in Piney, pointing to opportunities in the extended-stay market.
Recommendations
- Align with the market by considering a 2 Nights minimum stay, as 58.3% of Piney hosts use this setting.
- If feasible, allowing 1-night stays, especially midweek or during low season, could capture last-minute bookings, as only 20.8% currently do.
- Explore offering discounts for stays of 30+ nights to attract the 16.7% of the market seeking extended stays.
- Adjust minimum nights based on seasonality – potentially shorter during low season and longer during peak demand periods in Piney.
Piney Airbnb Cancellation Policy Trends Analysis (2026)
Flexible
2 listings
8.3% of total
Moderate
1 listings
4.2% of total
Firm
15 listings
62.5% of total
Strict
6 listings
25% of total
Cancellation Policy Insights for Piney
- The prevailing Airbnb cancellation policy trend in Piney is Firm, used by 62.5% of listings.
- A majority (87.5%) of hosts in Piney utilize Firm or Strict policies, indicating a market where hosts prioritize booking security.
Recommendations for Hosts
- Consider adopting a Firm policy to align with the 62.5% market standard in Piney.
- Regularly review your cancellation policy against competitors and market demand shifts in Piney.
Piney STR Booking Lead Time Analysis (2026)
Average Booking Lead Time by Month
Booking Lead Time Insights for Piney
- The overall average booking lead time for vacation rentals in Piney is 27 days.
- Guests book furthest in advance for stays during September (average 48 days), likely coinciding with peak travel demand or local events.
- The shortest booking windows occur for stays in February (average 12 days), indicating more last-minute travel plans during this time.
- Seasonally, Summer (33 days avg.) sees the longest lead times, while Winter (20 days avg.) has the shortest, reflecting typical travel planning cycles.
Recommendations for Hosts
- Use the overall average lead time (27 days) as a baseline for your pricing and availability strategy in Piney.
- For September stays, consider implementing length-of-stay discounts or slightly higher rates for bookings made less than 48 days out to capitalize on advance planning.
- During February, focus on last-minute booking availability and promotions, as guests book with very short notice (12 days avg.).
- Target marketing efforts for the Summer season well in advance (at least 33 days) to capture early planners.
- Monitor your own booking lead times against these Piney averages to identify opportunities for dynamic pricing adjustments.
Popular & Essential Airbnb Amenities in Piney (2026)
Amenity Prevalence
No amenities with partial availability (less than 100%) were found to display in the chart. All essential amenities might be present in all listings. Check insights below.
Amenity Insights for Piney
- Essential amenities in Piney that guests expect include: Free parking on premises, Hot water, Refrigerator, Backyard, Wifi, Hair dryer, Bed linens, Coffee maker, TV, Kitchen. Lacking these (any) could significantly impact bookings.
Recommendations for Hosts
- Ensure your listing includes all essential amenities for Piney: Free parking on premises, Hot water, Refrigerator, Backyard, Wifi, Hair dryer, Bed linens, Coffee maker, TV, Kitchen.
- Highlight unique or less common amenities you offer (e.g., hot tub, dedicated workspace, EV charger) in your listing description and photos.
- Regularly check competitor amenities in Piney to stay competitive.
Piney Airbnb Guest Demographics & Profile Analysis (2026)
Guest Profile Summary for Piney
- The typical guest profile for Airbnb in Piney consists of primarily domestic travelers (99%), often arriving from nearby Dallas, typically belonging to the Post-2000s (Gen Z/Alpha) group (50%), primarily speaking English or Spanish.
- Domestic travelers account for 99.1% of guests.
- Key international markets include United States (99.1%) and Canada (0.9%).
- Top languages spoken are English (86.7%) followed by Spanish (6.7%).
- A significant demographic segment is the Post-2000s (Gen Z/Alpha) group, representing 50% of guests.
Recommendations for Hosts
- Target domestic marketing efforts towards travelers from Dallas and Fort Worth.
- Tailor amenities and listing descriptions to appeal to the dominant Post-2000s (Gen Z/Alpha) demographic (e.g., highlight fast WiFi, smart home features, local guides).
- Highlight unique local experiences or amenities relevant to the primary guest profile.
- Consider seasonal promotions aligned with peak travel times for key origin markets.
Nearby Short-Term Rental Market Comparison
How does the Piney Airbnb market stack up against its neighbors? Compare key performance metrics like average monthly revenue, ADR, and occupancy rates in surrounding areas to understand the broader regional STR landscape.
| Market | Active Properties | Monthly Revenue | Daily Rate | Avg. Occupancy |
|---|---|---|---|---|
| Rockwell | 13 | $7,988 | $554.32 | 46% |
| McCurtain County | 85 | $5,126 | $519.27 | 35% |
| Broken Bow | 2,882 | $4,449 | $430.98 | 37% |
| Hochatown | 17 | $3,781 | $398.64 | 33% |
| Lake Hamilton | 77 | $3,228 | $328.72 | 34% |
| Garland County | 112 | $2,994 | $306.01 | 37% |
| Glenwood | 46 | $2,825 | $334.42 | 33% |
| Royal | 99 | $2,723 | $299.88 | 34% |
| Fountain Lake | 10 | $2,710 | $258.81 | 39% |
| Combs | 17 | $2,582 | $170.19 | 52% |