Aguanga Airbnb Market Analysis 2025: Short Term Rental Data & Vacation Rental Statistics in California, United States
Is Airbnb profitable in Aguanga in 2025? Explore comprehensive Airbnb analytics for Aguanga, California, United States to uncover income potential. This 2025 STR market report for Aguanga, based on AirROI data from September 2024 to August 2025, reveals key trends in the niche market of 19 active listings.
Whether you're considering an Airbnb investment in Aguanga, optimizing your existing vacation rental, or exploring rental arbitrage opportunities, understanding the Aguanga Airbnb data is crucial. Leveraging the low regulation environment is key to maximizing your short term rental income potential. Let's dive into the specifics.
Key Aguanga Airbnb Performance Metrics Overview
Monthly Airbnb Revenue Variations & Income Potential in Aguanga (2025)
Understanding the monthly revenue variations for Airbnb listings in Aguanga is key to maximizing your short term rental income potential. Seasonality significantly impacts earnings. Our analysis, based on data from the past 12 months, shows that the peak revenue month for STRs in Aguanga is typically March, while July often presents the lowest earnings, highlighting opportunities for strategic pricing adjustments during shoulder and low seasons. Explore the typical Airbnb income in Aguanga across different performance tiers:
- Best-in-class properties (Top 10%) achieve $4,054+ monthly, often utilizing dynamic pricing and superior guest experiences.
- Strong performing properties (Top 25%) earn $2,548 or more, indicating effective management and desirable locations/amenities.
- Typical properties (Median) generate around $1,261 per month, representing the average market performance.
- Entry-level properties (Bottom 25%) see earnings around $741, often with potential for optimization.
Average Monthly Airbnb Earnings Trend in Aguanga
Aguanga Airbnb Occupancy Rate Trends (2025)
Maximize your bookings by understanding the Aguanga STR occupancy trends. Seasonal demand shifts significantly influence how often properties are booked. Typically, Marchsees the highest demand (peak season occupancy), while July experiences the lowest (low season). Effective strategies, like adjusting minimum stays or offering promotions, can boost occupancy during slower periods. Here's how different property tiers perform in Aguanga:
- Best-in-class properties (Top 10%) achieve 68%+ occupancy, indicating high desirability and potentially optimized availability.
- Strong performing properties (Top 25%) maintain 47% or higher occupancy, suggesting good market fit and guest satisfaction.
- Typical properties (Median) have an occupancy rate around 26%.
- Entry-level properties (Bottom 25%) average 15% occupancy, potentially facing higher vacancy.
Average Monthly Occupancy Rate Trend in Aguanga
Average Daily Rate (ADR) Airbnb Trends in Aguanga (2025)
Effective short term rental pricing strategy in Aguanga involves understanding monthly ADR fluctuations. The Average Daily Rate (ADR) for Airbnb in Aguanga typically peaks in April and dips lowest during February. Leveraging Airbnb dynamic pricing tools or strategies based on this seasonality can significantly boost revenue. Here's a look at the typical nightly rates achieved:
- Best-in-class properties (Top 10%) command rates of $255+ per night, often due to premium features or locations.
- Strong performing properties (Top 25%) achieve nightly rates of $205 or more.
- Typical properties (Median) charge around $171 per night.
- Entry-level properties (Bottom 25%) earn around $131 per night.
Average Daily Rate (ADR) Trend by Month in Aguanga
Get Live Aguanga Market Intelligence 👇

Explore Real-time Analytics
Airbnb Seasonality Analysis & Trends in Aguanga (2025)
Peak Season (March, October, December)
- Revenue averages $2,040 per month
- Occupancy rates average 39.2%
- Daily rates average $174
Shoulder Season
- Revenue averages $1,749 per month
- Occupancy maintains around 32.7%
- Daily rates hold near $178
Low Season (January, April, July)
- Revenue drops to average $1,473 per month
- Occupancy decreases to average 26.0%
- Daily rates adjust to average $180
Seasonality Insights for Aguanga
- The Airbnb seasonality in Aguanga shows moderate seasonality with distinct peak and low periods. While the sections above show seasonal averages, it's also insightful to look at the extremes:
- During the high season, the absolute peak month showcases Aguanga's highest earning potential, with monthly revenues capable of climbing to $2,116, occupancy reaching a high of 41.1%, and ADRs peaking at $187.
- Conversely, the slowest single month of the year, typically falling within the low season, marks the market's lowest point. In this month, revenue might dip to $1,359, occupancy could drop to 22.2%, and ADRs may adjust down to $170.
- Understanding both the seasonal averages and these monthly peaks and troughs in revenue, occupancy, and ADR is crucial for maximizing your Airbnb profit potential in Aguanga.
Seasonal Strategies for Maximizing Profit
- Peak Season: Maximize revenue through premium pricing and potentially longer minimum stays. Ensure high availability.
- Low Season: Offer competitive pricing, special promotions (e.g., extended stay discounts), and flexible cancellation policies. Target off-season travelers like remote workers or budget-conscious guests.
- Shoulder Seasons: Implement dynamic pricing that balances peak and low rates. Target weekend travelers or specific events. Offer slightly more flexible terms than peak season.
- Regularly analyze your own performance against these Aguanga seasonality benchmarks and adjust your pricing and availability strategy accordingly.
Best Areas for Airbnb Investment in Aguanga (2025)
Exploring the top neighborhoods for short-term rentals in Aguanga? This section highlights key areas, outlining why they are attractive for hosts and guests, along with notable local attractions. Consider these locations based on your target guest profile and investment strategy.
| Neighborhood / Area | Why Host Here? (Target Guests & Appeal) | Key Attractions & Landmarks |
|---|---|---|
| Lake Riverside Estates | A scenic community surrounding Lake Riverside, offering tranquil views and a peaceful environment. Popular for nature lovers and those looking for a getaway from city life. | Lake Riverside, Riverside County Land, Outdoor hiking trails, Nature photography, Peaceful retreat ambience |
| Temecula Wine Country | Famous for its wineries and vineyards, Temecula Wine Country is a prime location for tourists looking to explore wine tasting, hot air balloon rides, and beautiful landscapes. | Winery tours, Hot air balloon rides, Temecula Valley Polo Club, Old Town Temecula, Wine festivals |
| Anza-Borrego Desert State Park | The largest state park in California, known for its unique desert landscapes and wildflower blooms. An ideal spot for those interested in hiking and outdoor activities. | Hiking trails, Wildflower viewing, Palm Canyon, Desert wildlife, Stargazing |
| Murrieta | A growing suburban area near Aguanga, with family-friendly amenities and close proximity to shopping. Attractive to families and travelers looking for a quieter stay. | Murrieta Hot Springs, Shopping centers, Golf courses, Parks, Local dining options |
| Julian | A charming historic town known for its apple pie and gold rush history. Attracts visitors year-round with its small-town charm and outdoor activities. | Julian Pie Company, Volcan Mountain, Gold mine tours, Apple picking, Local boutiques |
| Idyllwild | A mountain community known for its artistic vibe and stunning natural beauty. Popular for those seeking art, music festivals, and hiking adventures. | Idyllwild Arts Academy, Mount San Jacinto, Hiking trails, Art festivals, Scenic viewpoints |
| Palm Springs | A famous resort city with vibrant nightlife, luxury hotels, and spa services. It attracts tourists seeking luxury and relaxation in the desert. | Palm Springs Aerial Tramway, Coachella Valley, Golf courses, Art museums, Nightlife |
| Borrego Springs | A quiet desert community and gateway to Anza-Borrego Desert State Park. Ideal for those interested in outdoor activities and solitude. | Giant desert sculptures, Hiking, Bird watching, Wildflower fields, Clear night skies |
Understanding Airbnb License Requirements & STR Laws in Aguanga (2025)
While Aguanga, California, United States currently shows low STR regulations, specific Airbnb license requirements might still exist or change. Always verify the latest short term rental regulations and Airbnb license requirements directly with local government authorities for Aguanga to ensure full compliance before hosting.
(Source: AirROI data, 2025, finding no licensed listings among those analyzed)
Top Performing Airbnb Properties in Aguanga (2025)
Benchmark your potential! Explore examples of top-performing Airbnb properties in Aguangabased on Trailing Twelve Month (TTM) revenue. Analyze their characteristics, revenue, occupancy rate, and ADR to understand what drives success in this market.
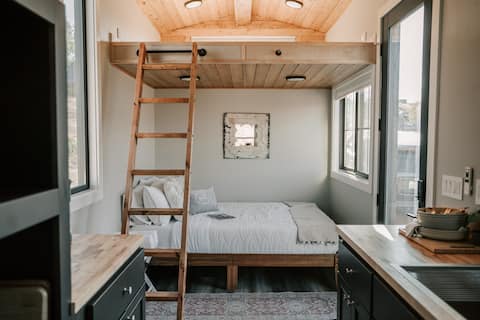
High Desert Tiny Home w/ Sauna
Entire Place • 1 bedroom

Luxury Off-Grid Desert Retreat: The Overlook
Entire Place • N/A

Off-grid Desert Retreat: Casa Rosada
Entire Place • 1 bedroom

Cozy Modern Cabin Mountain Cottage- Near Wineries!
Entire Place • 1 bedroom

Big RV - Pool, Dogs, View, Wineries near Temecula
Entire Place • 1 bedroom
Cozy Tiny Home Village
Entire Place • 3 bedrooms
Note: Performance varies based on location, size, amenities, seasonality, and management quality. Data reflects the past 12 months.
Top Performing Airbnb Hosts in Aguanga (2025)
Learn from the best! This table showcases top-performing Airbnb hosts in Aguanga based on the number of properties managed and estimated total revenue over the past year. Analyze their scale and performance metrics.
| Host Name | Properties | Grossing Revenue | Stay Reviews | Avg Rating |
|---|---|---|---|---|
| John | 3 | $129,275 | 867 | 4.94/5.0 |
| Nicole | 5 | $53,691 | 366 | 4.99/5.0 |
| Ken | 2 | $25,811 | 54 | 4.98/5.0 |
| Nicholas | 3 | $23,855 | 30 | 4.91/5.0 |
| Ron And Helen | 1 | $9,995 | 9 | 5.00/5.0 |
| Andre | 1 | $5,176 | 1 | Not Rated |
| Host #26785801 | 1 | $3,864 | 4 | 5.00/5.0 |
| John | 1 | $2,910 | 5 | 4.60/5.0 |
| Shane | 1 | $2,494 | 8 | 5.00/5.0 |
| Becca | 1 | $1,882 | 11 | 4.73/5.0 |
Analyzing the strategies of top hosts, such as their property selection, pricing, and guest communication, can offer valuable lessons for optimizing your own Airbnb operations in Aguanga.
Dive Deeper: Advanced Aguanga STR Market Data (2025)
Ready to unlock more insights? AirROI provides access to advanced metrics and comprehensive Airbnb data for Aguanga. Explore detailed analytics beyond this report to refine your investment strategy, optimize pricing, and maximize your vacation rental profits.
Explore Advanced MetricsAguanga Short-Term Rental Market Composition (2025): Property & Room Types
Room Type Distribution
Property Type Distribution
Market Composition Insights for Aguanga
- The Aguanga Airbnb market composition is heavily skewed towards Entire Home/Apt listings, which make up 100% of the 19 active rentals. This indicates strong guest preference for privacy and space.
- Looking at the property type distribution in Aguanga, Outdoor/Unique properties are the most common (57.9%), reflecting the local real estate landscape.
- Houses represent a significant 36.8% portion, catering likely to families or larger groups.
- The presence of 5.3% Hotel/Boutique listings indicates integration with traditional hospitality.
Aguanga Airbnb Room Capacity Analysis (2025): Bedroom Distribution
Distribution of Listings by Number of Bedrooms
Room Capacity Insights for Aguanga
- The dominant room capacity in Aguanga is 1 bedroom listings, making up 73.7% of the market. This suggests a strong demand for properties suitable for couples or solo travelers.
- Together, 1 bedroom and 3 bedrooms properties represent 89.5% of the active Airbnb listings in Aguanga, indicating a high concentration in these sizes.
- With over half the market (73.7%) consisting of studios or 1-bedroom units, Aguanga is particularly well-suited for individuals or couples.
Aguanga Vacation Rental Guest Capacity Trends (2025)
Distribution of Listings by Guest Capacity
Guest Capacity Insights for Aguanga
- The most common guest capacity trend in Aguanga vacation rentals is listings accommodating 2 guests (42.1%). This suggests the primary traveler segment is likely couples or solo travelers.
- Properties designed for 2 guests and 4 guests dominate the Aguanga STR market, accounting for 73.7% of listings.
- A significant 42.1% of listings cater specifically to 1-2 guests, highlighting strong demand from couples and solo travelers in Aguanga.
- 21.0% of properties accommodate 6+ guests, serving the market segment for larger families or group travel in Aguanga.
- On average, properties in Aguanga are equipped to host 3.7 guests.
Aguanga Airbnb Booking Patterns (2025): Available vs. Booked Days
Available Days Distribution
Booked Days Distribution
Booking Pattern Insights for Aguanga
- The most common availability pattern in Aguanga falls within the 271-366 days range, representing 73.7% of listings. This suggests many properties have significant open periods on their calendars.
- Approximately 89.5% of listings show high availability (181+ days open annually), indicating potential for increased bookings or specific owner usage patterns.
- For booked days, the 31-90 days range is most frequent in Aguanga (42.1%), reflecting common guest stay durations or potential owner blocking patterns.
- A notable 15.8% of properties secure long booking periods (181+ days booked per year), highlighting successful long-term rental strategies or significant owner usage.
Aguanga Airbnb Minimum Stay Requirements Analysis
Distribution of Listings by Minimum Night Requirement
1 Night
13 listings
72.2% of total
2 Nights
1 listings
5.6% of total
4-6 Nights
2 listings
11.1% of total
30+ Nights
2 listings
11.1% of total
Key Insights
- The most prevalent minimum stay requirement in Aguanga is 1 Night, adopted by 72.2% of listings. This highlights the market's preference for shorter, flexible bookings.
- A strong majority (77.8%) of the Aguanga Airbnb data shows acceptance of very short stays (1-2 nights), indicating a dynamic, high-turnover market.
- A significant segment (11.1%) caters to monthly stays (30+ nights) in Aguanga, pointing to opportunities in the extended-stay market.
Recommendations
- Align with the market by considering a 1 Night minimum stay, as 72.2% of Aguanga hosts use this setting.
- Explore offering discounts for stays of 30+ nights to attract the 11.1% of the market seeking extended stays.
- Adjust minimum nights based on seasonality – potentially shorter during low season and longer during peak demand periods in Aguanga.
Aguanga Airbnb Cancellation Policy Trends Analysis (2025)
Flexible
5 listings
27.8% of total
Moderate
9 listings
50% of total
Firm
3 listings
16.7% of total
Strict
1 listings
5.6% of total
Cancellation Policy Insights for Aguanga
- The prevailing Airbnb cancellation policy trend in Aguanga is Moderate, used by 50% of listings.
- The market strongly favors guest-friendly terms, with 77.8% of listings offering Flexible or Moderate policies. This suggests guests in Aguanga may expect booking flexibility.
- Strict cancellation policies are quite rare (5.6%), potentially making listings with this policy less competitive unless justified by high demand or property type.
Recommendations for Hosts
- Consider adopting a Moderate policy to align with the 50% market standard in Aguanga.
- Using a Strict policy might deter some guests, as only 5.6% of listings use it. Evaluate if potential revenue protection outweighs possible lower booking rates.
- Regularly review your cancellation policy against competitors and market demand shifts in Aguanga.
Aguanga STR Booking Lead Time Analysis (2025)
Average Booking Lead Time by Month
Booking Lead Time Insights for Aguanga
- The overall average booking lead time for vacation rentals in Aguanga is 29 days.
- Guests book furthest in advance for stays during May (average 55 days), likely coinciding with peak travel demand or local events.
- The shortest booking windows occur for stays in January (average 11 days), indicating more last-minute travel plans during this time.
- Seasonally, Summer (39 days avg.) sees the longest lead times, while Winter (25 days avg.) has the shortest, reflecting typical travel planning cycles.
Recommendations for Hosts
- Use the overall average lead time (29 days) as a baseline for your pricing and availability strategy in Aguanga.
- For May stays, consider implementing length-of-stay discounts or slightly higher rates for bookings made less than 55 days out to capitalize on advance planning.
- During January, focus on last-minute booking availability and promotions, as guests book with very short notice (11 days avg.).
- Target marketing efforts for the Summer season well in advance (at least 39 days) to capture early planners.
- Monitor your own booking lead times against these Aguanga averages to identify opportunities for dynamic pricing adjustments.
Popular & Essential Airbnb Amenities in Aguanga (2025)
Amenity Prevalence
Amenity Insights for Aguanga
- Essential amenities in Aguanga that guests expect include: Fire extinguisher, Free parking on premises, Smoke alarm. Lacking these (any) could significantly impact bookings.
- Popular amenities like Air conditioning, Carbon monoxide alarm, Kitchen are common but not universal. Offering these can provide a competitive edge.
Recommendations for Hosts
- Ensure your listing includes all essential amenities for Aguanga: Fire extinguisher, Free parking on premises, Smoke alarm.
- Consider adding popular differentiators like Air conditioning or Carbon monoxide alarm to increase appeal.
- Highlight unique or less common amenities you offer (e.g., hot tub, dedicated workspace, EV charger) in your listing description and photos.
- Regularly check competitor amenities in Aguanga to stay competitive.
Aguanga Airbnb Guest Demographics & Profile Analysis (2025)
Guest Profile Summary for Aguanga
- The typical guest profile for Airbnb in Aguanga consists of primarily domestic travelers (95%), often arriving from nearby Los Angeles, typically belonging to the Post-2000s (Gen Z/Alpha) group (50%), primarily speaking English or Spanish.
- Domestic travelers account for 94.7% of guests.
- Key international markets include United States (94.7%) and Spain (0.5%).
- Top languages spoken are English (60.4%) followed by Spanish (15.8%).
- A significant demographic segment is the Post-2000s (Gen Z/Alpha) group, representing 50% of guests.
Recommendations for Hosts
- Target domestic marketing efforts towards travelers from Los Angeles and San Diego.
- Tailor amenities and listing descriptions to appeal to the dominant Post-2000s (Gen Z/Alpha) demographic (e.g., highlight fast WiFi, smart home features, local guides).
- Highlight unique local experiences or amenities relevant to the primary guest profile.
- Consider seasonal promotions aligned with peak travel times for key origin markets.
Nearby Short-Term Rental Market Comparison
How does the Aguanga Airbnb market stack up against its neighbors? Compare key performance metrics like average monthly revenue, ADR, and occupancy rates in surrounding areas to understand the broader regional STR landscape.
| Market | Active Properties | Monthly Revenue | Daily Rate | Avg. Occupancy |
|---|---|---|---|---|
| Rancho San Diego | 26 | $9,132 | $582.97 | 52% |
| Thousand Palms | 34 | $8,701 | $761.22 | 39% |
| Newport Beach | 1,238 | $8,224 | $719.06 | 45% |
| Bermuda Dunes | 148 | $7,016 | $665.26 | 40% |
| GlenOak Hills | 42 | $6,964 | $633.53 | 39% |
| Del Mar | 123 | $6,779 | $630.42 | 45% |
| Mount Helix | 35 | $6,685 | $511.04 | 51% |
| Lakeside | 37 | $6,268 | $567.81 | 44% |
| Rancho Santa Fe | 32 | $6,223 | $903.54 | 34% |
| Encinitas | 569 | $5,854 | $533.96 | 50% |