Aliso Viejo Airbnb Market Analysis 2026: Short Term Rental Data & Vacation Rental Statistics in California, United States
Is Airbnb profitable in Aliso Viejo in 2026? Explore comprehensive Airbnb analytics for Aliso Viejo, California, United States to uncover income potential. This 2026 STR market report for Aliso Viejo, based on AirROI data from February 2025 to January 2026, reveals key trends in the niche market of 31 active listings.
Whether you're considering an Airbnb investment in Aliso Viejo, optimizing your existing vacation rental, or exploring rental arbitrage opportunities, understanding the Aliso Viejo Airbnb data is crucial. Leveraging the low regulation environment is key to maximizing your short term rental income potential. Let's dive into the specifics.
Key Aliso Viejo Airbnb Performance Metrics Overview
Monthly Airbnb Revenue Variations & Income Potential in Aliso Viejo (2026)
Understanding the monthly revenue variations for Airbnb listings in Aliso Viejo is key to maximizing your short term rental income potential. Seasonality significantly impacts earnings. Our analysis, based on data from the past 12 months, shows that the peak revenue month for STRs in Aliso Viejo is typically June, while January often presents the lowest earnings, highlighting opportunities for strategic pricing adjustments during shoulder and low seasons. Explore the typical Airbnb income in Aliso Viejo across different performance tiers:
- Best-in-class properties (Top 10%) achieve $6,524+ monthly, often utilizing dynamic pricing and superior guest experiences.
- Strong performing properties (Top 25%) earn $4,403 or more, indicating effective management and desirable locations/amenities.
- Typical properties (Median) generate around $2,362 per month, representing the average market performance.
- Entry-level properties (Bottom 25%) see earnings around $818, often with potential for optimization.
Average Monthly Airbnb Earnings Trend in Aliso Viejo
Aliso Viejo Airbnb Occupancy Rate Trends (2026)
Maximize your bookings by understanding the Aliso Viejo STR occupancy trends. Seasonal demand shifts significantly influence how often properties are booked. Typically, Aprilsees the highest demand (peak season occupancy), while January experiences the lowest (low season). Effective strategies, like adjusting minimum stays or offering promotions, can boost occupancy during slower periods. Here's how different property tiers perform in Aliso Viejo:
- Best-in-class properties (Top 10%) achieve 83%+ occupancy, indicating high desirability and potentially optimized availability.
- Strong performing properties (Top 25%) maintain 61% or higher occupancy, suggesting good market fit and guest satisfaction.
- Typical properties (Median) have an occupancy rate around 34%.
- Entry-level properties (Bottom 25%) average 15% occupancy, potentially facing higher vacancy.
Average Monthly Occupancy Rate Trend in Aliso Viejo
Average Daily Rate (ADR) Airbnb Trends in Aliso Viejo (2026)
Effective short term rental pricing strategy in Aliso Viejo involves understanding monthly ADR fluctuations. The Average Daily Rate (ADR) for Airbnb in Aliso Viejo typically peaks in June and dips lowest during February. Leveraging Airbnb dynamic pricing tools or strategies based on this seasonality can significantly boost revenue. Here's a look at the typical nightly rates achieved:
- Best-in-class properties (Top 10%) command rates of $325+ per night, often due to premium features or locations.
- Strong performing properties (Top 25%) achieve nightly rates of $232 or more.
- Typical properties (Median) charge around $169 per night.
- Entry-level properties (Bottom 25%) earn around $93 per night.
Average Daily Rate (ADR) Trend by Month in Aliso Viejo
Get Live Aliso Viejo Market Intelligence 👇

Explore Real-time Analytics
Airbnb Seasonality Analysis & Trends in Aliso Viejo (2026)
Peak Season (June, July, April)
- Revenue averages $4,276 per month
- Occupancy rates average 52.0%
- Daily rates average $189
Shoulder Season
- Revenue averages $3,048 per month
- Occupancy maintains around 42.4%
- Daily rates hold near $183
Low Season (January, October, December)
- Revenue drops to average $1,347 per month
- Occupancy decreases to average 25.8%
- Daily rates adjust to average $187
Seasonality Insights for Aliso Viejo
- The Airbnb seasonality in Aliso Viejo shows highly seasonal trends requiring careful strategy. While the sections above show seasonal averages, it's also insightful to look at the extremes:
- During the high season, the absolute peak month showcases Aliso Viejo's highest earning potential, with monthly revenues capable of climbing to $4,641, occupancy reaching a high of 56.4%, and ADRs peaking at $193.
- Conversely, the slowest single month of the year, typically falling within the low season, marks the market's lowest point. In this month, revenue might dip to $779, occupancy could drop to 19.4%, and ADRs may adjust down to $177.
- Understanding both the seasonal averages and these monthly peaks and troughs in revenue, occupancy, and ADR is crucial for maximizing your Airbnb profit potential in Aliso Viejo.
Seasonal Strategies for Maximizing Profit
- Peak Season: Maximize revenue through premium pricing and potentially longer minimum stays. Ensure high availability.
- Low Season: Offer competitive pricing, special promotions (e.g., extended stay discounts), and flexible cancellation policies. Target off-season travelers like remote workers or budget-conscious guests.
- Shoulder Seasons: Implement dynamic pricing that balances peak and low rates. Target weekend travelers or specific events. Offer slightly more flexible terms than peak season.
- Regularly analyze your own performance against these Aliso Viejo seasonality benchmarks and adjust your pricing and availability strategy accordingly.
Best Areas for Airbnb Investment in Aliso Viejo (2026)
Exploring the top neighborhoods for short-term rentals in Aliso Viejo? This section highlights key areas, outlining why they are attractive for hosts and guests, along with notable local attractions. Consider these locations based on your target guest profile and investment strategy.
| Neighborhood / Area | Why Host Here? (Target Guests & Appeal) | Key Attractions & Landmarks |
|---|---|---|
| Laguna Beach | A beautiful coastal city known for its stunning beaches, art galleries, and art festivals. It's a popular destination for both tourists and locals looking for a scenic getaway. | Main Beach, Laguna Art Museum, Heisler Park, Tide Pools, Festival of Arts, Pageant of the Masters |
| Mission Viejo | A family-friendly community with ample parks, shopping centers, and recreational activities. Attractive to families and longer-term renters looking for a suburban lifestyle. | Lake Mission Viejo, Mission Viejo Mall, Oso Creek Trail, Marguerite Park, Tijeras Creek Golf Club |
| Irvine | An affluent city known for its excellent schools, high-tech companies, and beautiful parks. Popular with business professionals and families due to its economic opportunities and quality of life. | Irvine Spectrum Center, University of California, Irvine, Great Park, Quail Hill Park, Tustin Marketplace |
| Laguna Niguel | A coastal gem with stunning ocean views and a relaxed atmosphere. Attracts visitors looking for a quieter beach experience with easy access to both beach and city life. | Laguna Niguel Regional Park, Salt Creek Beach, Rancho Niguel Park, The Shops at Mission Viejo, Aliso and Wood Canyons Wilderness Park |
| Tustin | A historic city with a growing downtown area, Tustin has a mix of modern developments and historical sites. It's becoming popular for those looking for an urban vibe with a suburban feel. | Old Town Tustin, Tustin Marketplace, The District at Tustin Legacy, Tustin Ranch Golf Club, Tustin Area Historical Society |
| Foothill Ranch | A planned community that offers shopping, dining, and outdoor activities, making it appealing to younger families and professionals. | Foothill Ranch Towne Centre, Whiting Ranch Wilderness Park, Lake Forest Sports Park, Heritage Hill Historic Park, Saddleback Church |
| Costa Mesa | A vibrant city known for its shopping, dining, and arts scene. It attracts a younger crowd looking for lively entertainment and cultural experiences. | South Coast Plaza, The CAMP, The OC Fair & Event Center, Segerstrom Center for the Arts, Costa Mesa Historical Society |
| San Juan Capistrano | Historic charm meets modern convenience in this scenic area known for its Mission and equestrian culture. Popular with tourists wanting a taste of California's history and nature. | Mission San Juan Capistrano, Los Rios Historic District, Heritage Park, Swallow's Inn, The Ecology Center |
Understanding Airbnb License Requirements & STR Laws in Aliso Viejo (2026)
While Aliso Viejo, California, United States currently shows low STR regulations, specific Airbnb license requirements might still exist or change. Always verify the latest short term rental regulations and Airbnb license requirements directly with local government authorities for Aliso Viejo to ensure full compliance before hosting.
(Source: AirROI data, 2026, finding no licensed listings among those analyzed)
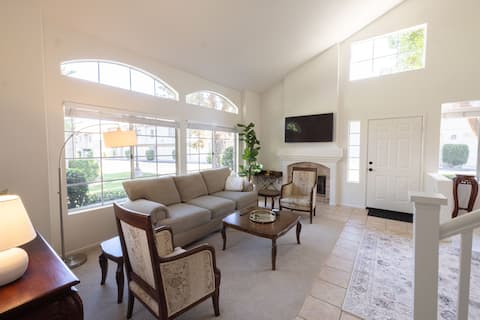
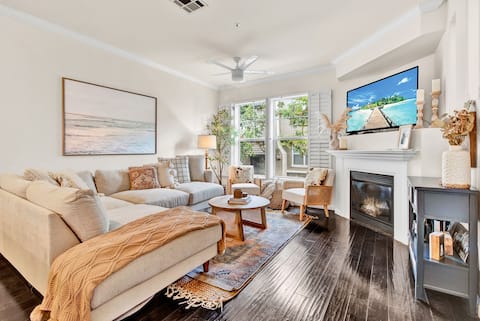
Top Performing Airbnb Properties in Aliso Viejo (2026)
Benchmark your potential! Explore examples of top-performing Airbnb properties in Aliso Viejobased on Trailing Twelve Month (TTM) revenue. Analyze their characteristics, revenue, occupancy rate, and ADR to understand what drives success in this market.

Modern condo with heated pool & hot tub
Entire Place • 1 bedroom
Cozy sunlit 3 bed 3 bath townhome in Aliso Viejo
Entire Place • 3 bedrooms
NEW! Coastal Luxury - Families & Remote Workers!
Entire Place • 2 bedrooms

Stunning Home with Private Pool!
Entire Place • 4 bedrooms

4 Bedroom House Aliso Viejo - 10 mins to the beach
Entire Place • 4 bedrooms

Laguna Audubon - Hummingbird Hideaway
Entire Place • 1 bedroom
Note: Performance varies based on location, size, amenities, seasonality, and management quality. Data reflects the past 12 months.
Top Performing Airbnb Hosts in Aliso Viejo (2026)
Learn from the best! This table showcases top-performing Airbnb hosts in Aliso Viejo based on the number of properties managed and estimated total revenue over the past year. Analyze their scale and performance metrics.
| Host Name | Properties | Grossing Revenue | Stay Reviews | Avg Rating |
|---|---|---|---|---|
| Natalia | 1 | $59,320 | 35 | 4.83/5.0 |
| Ali | 1 | $59,217 | 10 | 5.00/5.0 |
| Rachel | 1 | $54,172 | 10 | 5.00/5.0 |
| Morena | 1 | $45,021 | 4 | 4.75/5.0 |
| Anthony | 1 | $38,392 | 7 | 4.86/5.0 |
| Cari | 1 | $38,022 | 166 | 4.95/5.0 |
| Horizon Home | 2 | $35,114 | 29 | 4.59/5.0 |
| Lauren | 1 | $32,971 | 120 | 4.96/5.0 |
| Simone | 1 | $27,164 | 10 | 5.00/5.0 |
| Sherif | 1 | $24,346 | 61 | 4.82/5.0 |
Analyzing the strategies of top hosts, such as their property selection, pricing, and guest communication, can offer valuable lessons for optimizing your own Airbnb operations in Aliso Viejo.
Dive Deeper: Advanced Aliso Viejo STR Market Data (2026)
Ready to unlock more insights? AirROI provides access to advanced metrics and comprehensive Airbnb data for Aliso Viejo. Explore detailed analytics beyond this report to refine your investment strategy, optimize pricing, and maximize your vacation rental profits.
Explore Advanced MetricsAliso Viejo Short-Term Rental Market Composition (2026): Property & Room Types
Room Type Distribution
Property Type Distribution
Market Composition Insights for Aliso Viejo
- The Aliso Viejo Airbnb market composition is heavily skewed towards Entire Home/Apt listings, which make up 77.4% of the 31 active rentals. This indicates strong guest preference for privacy and space.
- Looking at the property type distribution in Aliso Viejo, House properties are the most common (67.7%), reflecting the local real estate landscape.
- Houses represent a significant 67.7% portion, catering likely to families or larger groups.
Aliso Viejo Airbnb Room Capacity Analysis (2026): Bedroom Distribution
Distribution of Listings by Number of Bedrooms
Room Capacity Insights for Aliso Viejo
- The dominant room capacity in Aliso Viejo is 2 bedrooms listings, making up 25.8% of the market. This suggests a strong demand for properties suitable for couples or solo travelers.
- Together, 2 bedrooms and 3 bedrooms properties represent 48.4% of the active Airbnb listings in Aliso Viejo, indicating a high concentration in these sizes.
- A significant 38.7% of listings offer 3+ bedrooms, catering to larger groups and families seeking more space in Aliso Viejo.
Aliso Viejo Vacation Rental Guest Capacity Trends (2026)
Distribution of Listings by Guest Capacity
Guest Capacity Insights for Aliso Viejo
- The most common guest capacity trend in Aliso Viejo vacation rentals is listings accommodating 5 guests (16.1%). This suggests the primary traveler segment is likely larger groups.
- Properties designed for 5 guests and 2 guests dominate the Aliso Viejo STR market, accounting for 29.0% of listings.
- 29.0% of properties accommodate 6+ guests, serving the market segment for larger families or group travel in Aliso Viejo.
- On average, properties in Aliso Viejo are equipped to host 3.8 guests.
Aliso Viejo Airbnb Booking Patterns (2026): Available vs. Booked Days
Available Days Distribution
Booked Days Distribution
Booking Pattern Insights for Aliso Viejo
- The most common availability pattern in Aliso Viejo falls within the 271-366 days range, representing 64.5% of listings. This suggests many properties have significant open periods on their calendars.
- Approximately 90.3% of listings show high availability (181+ days open annually), indicating potential for increased bookings or specific owner usage patterns.
- For booked days, the 91-180 days range is most frequent in Aliso Viejo (32.3%), reflecting common guest stay durations or potential owner blocking patterns.
- A notable 9.7% of properties secure long booking periods (181+ days booked per year), highlighting successful long-term rental strategies or significant owner usage.
Aliso Viejo Airbnb Minimum Stay Requirements Analysis
Distribution of Listings by Minimum Night Requirement
2 Nights
1 listings
3.2% of total
7-29 Nights
15 listings
48.4% of total
30+ Nights
15 listings
48.4% of total
Key Insights
- The most prevalent minimum stay requirement in Aliso Viejo is 7-29 Nights, adopted by 48.4% of listings. This highlights the market's preference for shorter, flexible bookings.
- Very short stays (1-2 nights) are less common (3.2%), suggesting hosts prefer slightly longer bookings to optimize turnover.
- A significant segment (48.4%) caters to monthly stays (30+ nights) in Aliso Viejo, pointing to opportunities in the extended-stay market.
Recommendations
- Align with the market by considering a 7-29 Nights minimum stay, as 48.4% of Aliso Viejo hosts use this setting.
- Explore offering discounts for stays of 30+ nights to attract the 48.4% of the market seeking extended stays.
- Adjust minimum nights based on seasonality – potentially shorter during low season and longer during peak demand periods in Aliso Viejo.
Aliso Viejo Airbnb Cancellation Policy Trends Analysis (2026)
Flexible
5 listings
16.1% of total
Moderate
4 listings
12.9% of total
Firm
16 listings
51.6% of total
Strict
6 listings
19.4% of total
Cancellation Policy Insights for Aliso Viejo
- The prevailing Airbnb cancellation policy trend in Aliso Viejo is Firm, used by 51.6% of listings.
- A majority (71.0%) of hosts in Aliso Viejo utilize Firm or Strict policies, indicating a market where hosts prioritize booking security.
Recommendations for Hosts
- Consider adopting a Firm policy to align with the 51.6% market standard in Aliso Viejo.
- Regularly review your cancellation policy against competitors and market demand shifts in Aliso Viejo.
Aliso Viejo STR Booking Lead Time Analysis (2026)
Average Booking Lead Time by Month
Booking Lead Time Insights for Aliso Viejo
- The overall average booking lead time for vacation rentals in Aliso Viejo is 33 days.
- Guests book furthest in advance for stays during April (average 47 days), likely coinciding with peak travel demand or local events.
- The shortest booking windows occur for stays in November (average 6 days), indicating more last-minute travel plans during this time.
- Seasonally, Winter (39 days avg.) sees the longest lead times, while Fall (21 days avg.) has the shortest, reflecting typical travel planning cycles.
Recommendations for Hosts
- Use the overall average lead time (33 days) as a baseline for your pricing and availability strategy in Aliso Viejo.
- For April stays, consider implementing length-of-stay discounts or slightly higher rates for bookings made less than 47 days out to capitalize on advance planning.
- During November, focus on last-minute booking availability and promotions, as guests book with very short notice (6 days avg.).
- Target marketing efforts for the Winter season well in advance (at least 39 days) to capture early planners.
- Monitor your own booking lead times against these Aliso Viejo averages to identify opportunities for dynamic pricing adjustments.
Popular & Essential Airbnb Amenities in Aliso Viejo (2026)
Amenity Prevalence
Amenity Insights for Aliso Viejo
- Essential amenities in Aliso Viejo that guests expect include: Wifi, Smoke alarm, Refrigerator, Bed linens, Heating, Washer. Lacking these (any) could significantly impact bookings.
- Popular amenities like Coffee maker, Hot water, Microwave are common but not universal. Offering these can provide a competitive edge.
Recommendations for Hosts
- Ensure your listing includes all essential amenities for Aliso Viejo: Wifi, Smoke alarm, Refrigerator, Bed linens, Heating, Washer.
- Prioritize adding missing essentials: Bed linens, Heating, Washer.
- Consider adding popular differentiators like Coffee maker or Hot water to increase appeal.
- Highlight unique or less common amenities you offer (e.g., hot tub, dedicated workspace, EV charger) in your listing description and photos.
- Regularly check competitor amenities in Aliso Viejo to stay competitive.
Aliso Viejo Airbnb Guest Demographics & Profile Analysis (2026)
Guest Profile Summary for Aliso Viejo
- The typical guest profile for Airbnb in Aliso Viejo consists of primarily domestic travelers (83%), often arriving from nearby Lake Forest, typically belonging to the Post-2000s (Gen Z/Alpha) group (50%), primarily speaking English or German.
- Domestic travelers account for 82.8% of guests.
- Key international markets include United States (82.8%) and Australia (4.7%).
- Top languages spoken are English (62.2%) followed by German (8.1%).
- A significant demographic segment is the Post-2000s (Gen Z/Alpha) group, representing 50% of guests.
Recommendations for Hosts
- Target domestic marketing efforts towards travelers from Lake Forest and Los Angeles.
- Tailor amenities and listing descriptions to appeal to the dominant Post-2000s (Gen Z/Alpha) demographic (e.g., highlight fast WiFi, smart home features, local guides).
- Highlight unique local experiences or amenities relevant to the primary guest profile.
- Consider seasonal promotions aligned with peak travel times for key origin markets.
Nearby Short-Term Rental Market Comparison
How does the Aliso Viejo Airbnb market stack up against its neighbors? Compare key performance metrics like average monthly revenue, ADR, and occupancy rates in surrounding areas to understand the broader regional STR landscape.
| Market | Active Properties | Monthly Revenue | Daily Rate | Avg. Occupancy |
|---|---|---|---|---|
| Newport Beach | 1,273 | $8,950 | $744.06 | 47% |
| Rancho San Diego | 25 | $8,649 | $568.72 | 48% |
| Malibu | 251 | $8,293 | $1263.89 | 35% |
| Thousand Palms | 33 | $8,119 | $725.48 | 36% |
| Manhattan Beach | 267 | $7,875 | $585.30 | 53% |
| Lakeside | 33 | $7,537 | $604.33 | 44% |
| GlenOak Hills | 41 | $7,394 | $648.65 | 41% |
| Bermuda Dunes | 143 | $7,324 | $664.90 | 39% |
| Mount Helix | 33 | $7,163 | $594.94 | 50% |
| Del Mar | 128 | $7,011 | $671.56 | 45% |