American Canyon Airbnb Market Analysis 2026: Short Term Rental Data & Vacation Rental Statistics in California, United States
Is Airbnb profitable in American Canyon in 2026? Explore comprehensive Airbnb analytics for American Canyon, California, United States to uncover income potential. This 2026 STR market report for American Canyon, based on AirROI data from February 2025 to January 2026, reveals key trends in the niche market of 30 active listings.
Whether you're considering an Airbnb investment in American Canyon, optimizing your existing vacation rental, or exploring rental arbitrage opportunities, understanding the American Canyon Airbnb data is crucial. Leveraging the low regulation environment is key to maximizing your short term rental income potential. Let's dive into the specifics.
Key American Canyon Airbnb Performance Metrics Overview
Monthly Airbnb Revenue Variations & Income Potential in American Canyon (2026)
Understanding the monthly revenue variations for Airbnb listings in American Canyon is key to maximizing your short term rental income potential. Seasonality significantly impacts earnings. Our analysis, based on data from the past 12 months, shows that the peak revenue month for STRs in American Canyon is typically April, while January often presents the lowest earnings, highlighting opportunities for strategic pricing adjustments during shoulder and low seasons. Explore the typical Airbnb income in American Canyon across different performance tiers:
- Best-in-class properties (Top 10%) achieve $11,468+ monthly, often utilizing dynamic pricing and superior guest experiences.
- Strong performing properties (Top 25%) earn $7,150 or more, indicating effective management and desirable locations/amenities.
- Typical properties (Median) generate around $2,740 per month, representing the average market performance.
- Entry-level properties (Bottom 25%) see earnings around $996, often with potential for optimization.
Average Monthly Airbnb Earnings Trend in American Canyon
American Canyon Airbnb Occupancy Rate Trends (2026)
Maximize your bookings by understanding the American Canyon STR occupancy trends. Seasonal demand shifts significantly influence how often properties are booked. Typically, Aprilsees the highest demand (peak season occupancy), while January experiences the lowest (low season). Effective strategies, like adjusting minimum stays or offering promotions, can boost occupancy during slower periods. Here's how different property tiers perform in American Canyon:
- Best-in-class properties (Top 10%) achieve 65%+ occupancy, indicating high desirability and potentially optimized availability.
- Strong performing properties (Top 25%) maintain 47% or higher occupancy, suggesting good market fit and guest satisfaction.
- Typical properties (Median) have an occupancy rate around 30%.
- Entry-level properties (Bottom 25%) average 18% occupancy, potentially facing higher vacancy.
Average Monthly Occupancy Rate Trend in American Canyon
Average Daily Rate (ADR) Airbnb Trends in American Canyon (2026)
Effective short term rental pricing strategy in American Canyon involves understanding monthly ADR fluctuations. The Average Daily Rate (ADR) for Airbnb in American Canyon typically peaks in May and dips lowest during February. Leveraging Airbnb dynamic pricing tools or strategies based on this seasonality can significantly boost revenue. Here's a look at the typical nightly rates achieved:
- Best-in-class properties (Top 10%) command rates of $876+ per night, often due to premium features or locations.
- Strong performing properties (Top 25%) achieve nightly rates of $579 or more.
- Typical properties (Median) charge around $228 per night.
- Entry-level properties (Bottom 25%) earn around $118 per night.
Average Daily Rate (ADR) Trend by Month in American Canyon
Get Live American Canyon Market Intelligence 👇

Explore Real-time Analytics
Airbnb Seasonality Analysis & Trends in American Canyon (2026)
Peak Season (April, May, June)
- Revenue averages $6,420 per month
- Occupancy rates average 40.1%
- Daily rates average $400
Shoulder Season
- Revenue averages $4,892 per month
- Occupancy maintains around 35.6%
- Daily rates hold near $383
Low Season (January, February, December)
- Revenue drops to average $2,951 per month
- Occupancy decreases to average 27.7%
- Daily rates adjust to average $358
Seasonality Insights for American Canyon
- The Airbnb seasonality in American Canyon shows highly seasonal trends requiring careful strategy. While the sections above show seasonal averages, it's also insightful to look at the extremes:
- During the high season, the absolute peak month showcases American Canyon's highest earning potential, with monthly revenues capable of climbing to $6,807, occupancy reaching a high of 45.8%, and ADRs peaking at $408.
- Conversely, the slowest single month of the year, typically falling within the low season, marks the market's lowest point. In this month, revenue might dip to $2,079, occupancy could drop to 20.3%, and ADRs may adjust down to $346.
- Understanding both the seasonal averages and these monthly peaks and troughs in revenue, occupancy, and ADR is crucial for maximizing your Airbnb profit potential in American Canyon.
Seasonal Strategies for Maximizing Profit
- Peak Season: Maximize revenue through premium pricing and potentially longer minimum stays. Ensure high availability.
- Low Season: Offer competitive pricing, special promotions (e.g., extended stay discounts), and flexible cancellation policies. Target off-season travelers like remote workers or budget-conscious guests.
- Shoulder Seasons: Implement dynamic pricing that balances peak and low rates. Target weekend travelers or specific events. Offer slightly more flexible terms than peak season.
- Regularly analyze your own performance against these American Canyon seasonality benchmarks and adjust your pricing and availability strategy accordingly.
Best Areas for Airbnb Investment in American Canyon (2026)
Exploring the top neighborhoods for short-term rentals in American Canyon? This section highlights key areas, outlining why they are attractive for hosts and guests, along with notable local attractions. Consider these locations based on your target guest profile and investment strategy.
| Neighborhood / Area | Why Host Here? (Target Guests & Appeal) | Key Attractions & Landmarks |
|---|---|---|
| American Canyon Main Street | The heart of American Canyon featuring local shops and restaurants. This area draws visitors looking to explore the heart of the community and enjoy local flavors. | American Canyon Wetlands, American Canyon Library, Local shops and eateries, Geyser Peak Winery, Public parks |
| Glen Cove | A scenic neighborhood by the water that offers stunning views of the Napa River. Popular among those seeking a peaceful getaway close to nature attractions. | Glen Cove Marina, Nature trails, Waterfront dining, Napa River access, Scenic parks |
| Napa Valley mountains | Proximity to renowned wineries and vineyards, attracting wine lovers and tourists looking to experience the Napa Valley winery culture. | Napa Valley wineries, Hiking trails, Breathtaking views, Downtown Napa, Wine tasting tours |
| Six Flags Discovery Kingdom | Major family-friendly amusement park and attraction in Vallejo, close to American Canyon, drawing visitors of all ages. | Six Flags rides, Animal exhibits, Entertainment shows, Dining options, Shopping at the park |
| Sonoma Coast | A bit farther, but offers beautiful coastal views and attractions, appealing to those seeking a beach experience along with wine country. | Bodega Bay, Sonoma Coast State Park, Beaches and tide pools, Local seafood eateries, Scenic coastal drives |
| Napa River | The charming area along the Napa River that provides recreational activities, making it popular among families and tourists alike. | Napa River kayaking, Picnic areas, Walking paths, Local festivals, Art installations |
| Fairfield | Nearby city with vibrant shopping and dining options, offering additional entertainment and convenience for those staying in American Canyon. | Westfield Solano Shopping Center, Local diners and restaurants, Civic Center, Fairfield Museums, Brooks Park |
| Lake Marie | A beautiful local park with a lake and trails, ideal for outdoor enthusiasts and families looking for nature activities. | Picnic areas, Hiking trails, Fishing opportunities, Wildlife viewing, Great for weekend getaways |
Understanding Airbnb License Requirements & STR Laws in American Canyon (2026)
While American Canyon, California, United States currently shows low STR regulations, specific Airbnb license requirements might still exist or change. Always verify the latest short term rental regulations and Airbnb license requirements directly with local government authorities for American Canyon to ensure full compliance before hosting.
(Source: AirROI data, 2026, finding no licensed listings among those analyzed)
Top Performing Airbnb Properties in American Canyon (2026)
Benchmark your potential! Explore examples of top-performing Airbnb properties in American Canyonbased on Trailing Twelve Month (TTM) revenue. Analyze their characteristics, revenue, occupancy rate, and ADR to understand what drives success in this market.
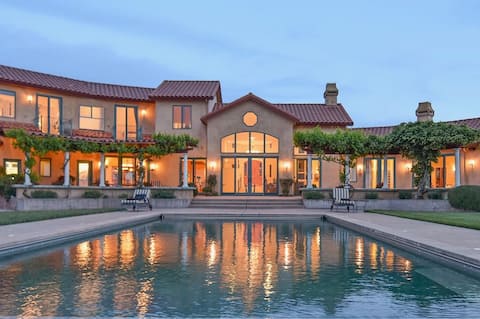
Napa Valley Villa: Exclusive Vineyard Retreat
Entire Place • 3 bedrooms

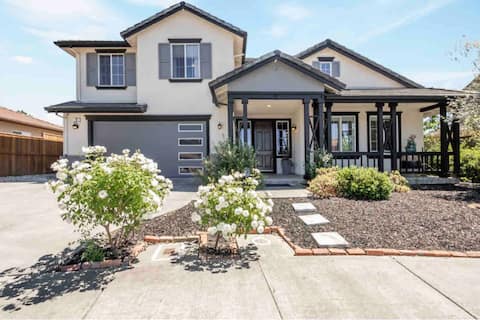
Deluxe Napa Retreat | Unwind in Style with Hot Tub
Entire Place • 4 bedrooms
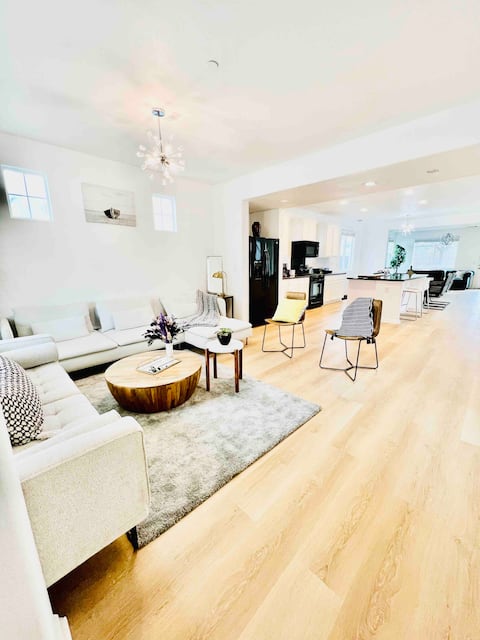
Art house. 10 min to napa/hilltop views
Entire Place • 4 bedrooms
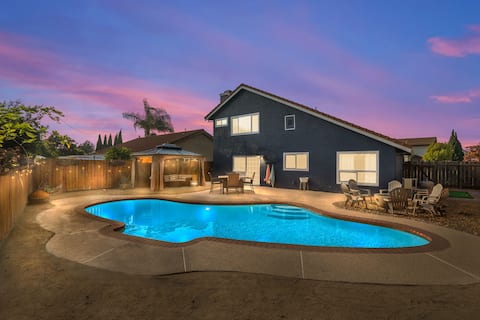
Spacious home near Napa | Hot tub | Pool | Games
Entire Place • 3 bedrooms
Napa Valley
Entire Place • 5 bedrooms

Gorgeous Napa County 4 Bedrooms & 4.5 Bathrooms
Entire Place • 4 bedrooms
Note: Performance varies based on location, size, amenities, seasonality, and management quality. Data reflects the past 12 months.
Top Performing Airbnb Hosts in American Canyon (2026)
Learn from the best! This table showcases top-performing Airbnb hosts in American Canyon based on the number of properties managed and estimated total revenue over the past year. Analyze their scale and performance metrics.
| Host Name | Properties | Grossing Revenue | Stay Reviews | Avg Rating |
|---|---|---|---|---|
| David | 2 | $186,412 | 20 | 4.95/5.0 |
| Koko | 3 | $160,658 | 91 | 4.95/5.0 |
| Dahlia | 1 | $123,723 | 81 | 5.00/5.0 |
| Amit | 1 | $116,255 | 241 | 4.90/5.0 |
| Ana | 1 | $102,404 | 63 | 4.92/5.0 |
| Susie | 1 | $93,036 | 42 | 4.86/5.0 |
| Stay Smart | 2 | $90,821 | 26 | 4.88/5.0 |
| Max | 2 | $72,452 | 309 | 4.69/5.0 |
| Michelle | 1 | $65,469 | 300 | 4.86/5.0 |
| Surinder | 1 | $45,029 | 133 | 4.89/5.0 |
Analyzing the strategies of top hosts, such as their property selection, pricing, and guest communication, can offer valuable lessons for optimizing your own Airbnb operations in American Canyon.
Dive Deeper: Advanced American Canyon STR Market Data (2026)
Ready to unlock more insights? AirROI provides access to advanced metrics and comprehensive Airbnb data for American Canyon. Explore detailed analytics beyond this report to refine your investment strategy, optimize pricing, and maximize your vacation rental profits.
Explore Advanced MetricsAmerican Canyon Short-Term Rental Market Composition (2026): Property & Room Types
Room Type Distribution
Property Type Distribution
Market Composition Insights for American Canyon
- The American Canyon Airbnb market composition is heavily skewed towards Entire Home/Apt listings, which make up 73.3% of the 30 active rentals. This indicates strong guest preference for privacy and space.
- Looking at the property type distribution in American Canyon, House properties are the most common (76.7%), reflecting the local real estate landscape.
- Houses represent a significant 76.7% portion, catering likely to families or larger groups.
- Smaller segments like apartment/condo (combined 3.3%) offer potential for unique stay experiences.
American Canyon Airbnb Room Capacity Analysis (2026): Bedroom Distribution
Distribution of Listings by Number of Bedrooms
Room Capacity Insights for American Canyon
- The dominant room capacity in American Canyon is 5+ bedrooms listings, making up 23.3% of the market. This suggests a strong demand for properties suitable for families or small groups.
- Together, 5+ bedrooms and 4 bedrooms properties represent 40.0% of the active Airbnb listings in American Canyon, indicating a high concentration in these sizes.
- A significant 53.3% of listings offer 3+ bedrooms, catering to larger groups and families seeking more space in American Canyon.
American Canyon Vacation Rental Guest Capacity Trends (2026)
Distribution of Listings by Guest Capacity
Guest Capacity Insights for American Canyon
- The most common guest capacity trend in American Canyon vacation rentals is listings accommodating 8+ guests (43.3%). This suggests the primary traveler segment is likely larger groups.
- Properties designed for 8+ guests and 7 guests dominate the American Canyon STR market, accounting for 50.0% of listings.
- 56.7% of properties accommodate 6+ guests, serving the market segment for larger families or group travel in American Canyon.
- On average, properties in American Canyon are equipped to host 4.9 guests.
American Canyon Airbnb Booking Patterns (2026): Available vs. Booked Days
Available Days Distribution
Booked Days Distribution
Booking Pattern Insights for American Canyon
- The most common availability pattern in American Canyon falls within the 271-366 days range, representing 50% of listings. This suggests many properties have significant open periods on their calendars.
- Approximately 93.3% of listings show high availability (181+ days open annually), indicating potential for increased bookings or specific owner usage patterns.
- For booked days, the 91-180 days range is most frequent in American Canyon (43.3%), reflecting common guest stay durations or potential owner blocking patterns.
- A notable 6.7% of properties secure long booking periods (181+ days booked per year), highlighting successful long-term rental strategies or significant owner usage.
American Canyon Airbnb Minimum Stay Requirements Analysis
Distribution of Listings by Minimum Night Requirement
1 Night
11 listings
36.7% of total
2 Nights
10 listings
33.3% of total
3 Nights
5 listings
16.7% of total
7-29 Nights
2 listings
6.7% of total
30+ Nights
2 listings
6.7% of total
Key Insights
- The most prevalent minimum stay requirement in American Canyon is 1 Night, adopted by 36.7% of listings. This highlights the market's preference for shorter, flexible bookings.
- A strong majority (70.0%) of the American Canyon Airbnb data shows acceptance of very short stays (1-2 nights), indicating a dynamic, high-turnover market.
Recommendations
- Align with the market by considering a 1 Night minimum stay, as 36.7% of American Canyon hosts use this setting.
- Explore offering discounts for stays of 30+ nights to attract the 6.7% of the market seeking extended stays.
- Adjust minimum nights based on seasonality – potentially shorter during low season and longer during peak demand periods in American Canyon.
American Canyon Airbnb Cancellation Policy Trends Analysis (2026)
Flexible
9 listings
30% of total
Moderate
6 listings
20% of total
Firm
8 listings
26.7% of total
Strict
7 listings
23.3% of total
Cancellation Policy Insights for American Canyon
- The prevailing Airbnb cancellation policy trend in American Canyon is Flexible, used by 30% of listings.
- There's a relatively balanced mix between guest-friendly (50.0%) and stricter (50.0%) policies, offering choices for different guest needs.
Recommendations for Hosts
- Consider adopting a Flexible policy to align with the 30% market standard in American Canyon.
- Regularly review your cancellation policy against competitors and market demand shifts in American Canyon.
American Canyon STR Booking Lead Time Analysis (2026)
Average Booking Lead Time by Month
Booking Lead Time Insights for American Canyon
- The overall average booking lead time for vacation rentals in American Canyon is 50 days.
- Guests book furthest in advance for stays during May (average 87 days), likely coinciding with peak travel demand or local events.
- The shortest booking windows occur for stays in November (average 25 days), indicating more last-minute travel plans during this time.
- Seasonally, Spring (54 days avg.) sees the longest lead times, while Winter (29 days avg.) has the shortest, reflecting typical travel planning cycles.
Recommendations for Hosts
- Use the overall average lead time (50 days) as a baseline for your pricing and availability strategy in American Canyon.
- For May stays, consider implementing length-of-stay discounts or slightly higher rates for bookings made less than 87 days out to capitalize on advance planning.
- Target marketing efforts for the Spring season well in advance (at least 54 days) to capture early planners.
- Monitor your own booking lead times against these American Canyon averages to identify opportunities for dynamic pricing adjustments.
Popular & Essential Airbnb Amenities in American Canyon (2026)
Amenity Prevalence
Amenity Insights for American Canyon
- Popular amenities like Kitchen, Free parking on premises, Heating are common but not universal. Offering these can provide a competitive edge.
- Warning: Wifi is not universally provided but is considered essential globally. Ensure reliable Wifi is offered.
Recommendations for Hosts
- Consider adding popular differentiators like Kitchen or Free parking on premises to increase appeal.
- Highlight unique or less common amenities you offer (e.g., hot tub, dedicated workspace, EV charger) in your listing description and photos.
- Regularly check competitor amenities in American Canyon to stay competitive.
American Canyon Airbnb Guest Demographics & Profile Analysis (2026)
Guest Profile Summary for American Canyon
- The typical guest profile for Airbnb in American Canyon consists of primarily domestic travelers (92%), often arriving from nearby San Francisco, typically belonging to the Post-2000s (Gen Z/Alpha) group (50%), primarily speaking English or Spanish.
- Domestic travelers account for 91.6% of guests.
- Key international markets include United States (91.6%) and Canada (1.8%).
- Top languages spoken are English (66%) followed by Spanish (14.7%).
- A significant demographic segment is the Post-2000s (Gen Z/Alpha) group, representing 50% of guests.
Recommendations for Hosts
- Target domestic marketing efforts towards travelers from San Francisco and San Jose.
- Tailor amenities and listing descriptions to appeal to the dominant Post-2000s (Gen Z/Alpha) demographic (e.g., highlight fast WiFi, smart home features, local guides).
- Highlight unique local experiences or amenities relevant to the primary guest profile.
- Consider seasonal promotions aligned with peak travel times for key origin markets.
Nearby Short-Term Rental Market Comparison
How does the American Canyon Airbnb market stack up against its neighbors? Compare key performance metrics like average monthly revenue, ADR, and occupancy rates in surrounding areas to understand the broader regional STR landscape.
| Market | Active Properties | Monthly Revenue | Daily Rate | Avg. Occupancy |
|---|---|---|---|---|
| Moss Beach | 34 | $10,092 | $676.91 | 53% |
| Sonoma | 228 | $9,647 | $819.87 | 43% |
| Marshall | 18 | $8,897 | $607.75 | 50% |
| St. Helena | 50 | $8,684 | $924.70 | 38% |
| Kenwood | 60 | $8,643 | $810.83 | 41% |
| Glen Ellen | 85 | $8,482 | $799.53 | 43% |
| Eldridge | 21 | $8,410 | $930.61 | 41% |
| Dillon Beach | 82 | $8,062 | $703.26 | 41% |
| Stinson Beach | 106 | $7,814 | $812.15 | 43% |
| Healdsburg | 195 | $7,538 | $744.46 | 41% |