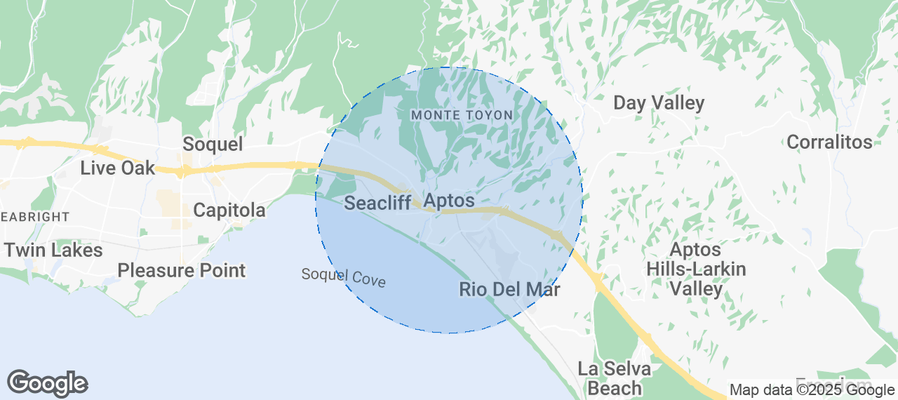
Aptos Airbnb Market Analysis 2026: Short Term Rental Data & Vacation Rental Statistics in California, United States
Is Airbnb profitable in Aptos in 2026? Explore comprehensive Airbnb analytics for Aptos, California, United States to uncover income potential. This 2026 STR market report for Aptos, based on AirROI data from February 2025 to January 2026, reveals key trends in the niche market of 42 active listings.
Whether you're considering an Airbnb investment in Aptos, optimizing your existing vacation rental, or exploring rental arbitrage opportunities, understanding the Aptos Airbnb data is crucial. Leveraging the low regulation environment is key to maximizing your short term rental income potential. Let's dive into the specifics.
Key Aptos Airbnb Performance Metrics Overview
Monthly Airbnb Revenue Variations & Income Potential in Aptos (2026)
Understanding the monthly revenue variations for Airbnb listings in Aptos is key to maximizing your short term rental income potential. Seasonality significantly impacts earnings. Our analysis, based on data from the past 12 months, shows that the peak revenue month for STRs in Aptos is typically July, while February often presents the lowest earnings, highlighting opportunities for strategic pricing adjustments during shoulder and low seasons. Explore the typical Airbnb income in Aptos across different performance tiers:
- Best-in-class properties (Top 10%) achieve $11,918+ monthly, often utilizing dynamic pricing and superior guest experiences.
- Strong performing properties (Top 25%) earn $8,663 or more, indicating effective management and desirable locations/amenities.
- Typical properties (Median) generate around $4,978 per month, representing the average market performance.
- Entry-level properties (Bottom 25%) see earnings around $2,826, often with potential for optimization.
Average Monthly Airbnb Earnings Trend in Aptos
Aptos Airbnb Occupancy Rate Trends (2026)
Maximize your bookings by understanding the Aptos STR occupancy trends. Seasonal demand shifts significantly influence how often properties are booked. Typically, Julysees the highest demand (peak season occupancy), while May experiences the lowest (low season). Effective strategies, like adjusting minimum stays or offering promotions, can boost occupancy during slower periods. Here's how different property tiers perform in Aptos:
- Best-in-class properties (Top 10%) achieve 79%+ occupancy, indicating high desirability and potentially optimized availability.
- Strong performing properties (Top 25%) maintain 64% or higher occupancy, suggesting good market fit and guest satisfaction.
- Typical properties (Median) have an occupancy rate around 44%.
- Entry-level properties (Bottom 25%) average 26% occupancy, potentially facing higher vacancy.
Average Monthly Occupancy Rate Trend in Aptos
Average Daily Rate (ADR) Airbnb Trends in Aptos (2026)
Effective short term rental pricing strategy in Aptos involves understanding monthly ADR fluctuations. The Average Daily Rate (ADR) for Airbnb in Aptos typically peaks in July and dips lowest during January. Leveraging Airbnb dynamic pricing tools or strategies based on this seasonality can significantly boost revenue. Here's a look at the typical nightly rates achieved:
- Best-in-class properties (Top 10%) command rates of $714+ per night, often due to premium features or locations.
- Strong performing properties (Top 25%) achieve nightly rates of $541 or more.
- Typical properties (Median) charge around $342 per night.
- Entry-level properties (Bottom 25%) earn around $198 per night.
Average Daily Rate (ADR) Trend by Month in Aptos
Get Live Aptos Market Intelligence 👇
Explore Real-time Analytics
Airbnb Seasonality Analysis & Trends in Aptos (2026)
Peak Season (July, August, June)
- Revenue averages $8,886 per month
- Occupancy rates average 56.9%
- Daily rates average $442
Shoulder Season
- Revenue averages $5,944 per month
- Occupancy maintains around 47.7%
- Daily rates hold near $399
Low Season (January, February, May)
- Revenue drops to average $3,673 per month
- Occupancy decreases to average 32.3%
- Daily rates adjust to average $400
Seasonality Insights for Aptos
- The Airbnb seasonality in Aptos shows highly seasonal trends requiring careful strategy. While the sections above show seasonal averages, it's also insightful to look at the extremes:
- During the high season, the absolute peak month showcases Aptos's highest earning potential, with monthly revenues capable of climbing to $9,488, occupancy reaching a high of 61.9%, and ADRs peaking at $457.
- Conversely, the slowest single month of the year, typically falling within the low season, marks the market's lowest point. In this month, revenue might dip to $2,744, occupancy could drop to 24.3%, and ADRs may adjust down to $375.
- Understanding both the seasonal averages and these monthly peaks and troughs in revenue, occupancy, and ADR is crucial for maximizing your Airbnb profit potential in Aptos.
Seasonal Strategies for Maximizing Profit
- Peak Season: Maximize revenue through premium pricing and potentially longer minimum stays. Ensure high availability.
- Low Season: Offer competitive pricing, special promotions (e.g., extended stay discounts), and flexible cancellation policies. Target off-season travelers like remote workers or budget-conscious guests.
- Shoulder Seasons: Implement dynamic pricing that balances peak and low rates. Target weekend travelers or specific events. Offer slightly more flexible terms than peak season.
- Regularly analyze your own performance against these Aptos seasonality benchmarks and adjust your pricing and availability strategy accordingly.
Best Areas for Airbnb Investment in Aptos (2026)
Exploring the top neighborhoods for short-term rentals in Aptos? This section highlights key areas, outlining why they are attractive for hosts and guests, along with notable local attractions. Consider these locations based on your target guest profile and investment strategy.
| Neighborhood / Area | Why Host Here? (Target Guests & Appeal) | Key Attractions & Landmarks |
|---|---|---|
| Seacliff State Beach | A stunning beach with scenic views and popular for its beautiful coastline and outdoor activities. Great for tourists looking for relaxation and recreation in nature. | Seacliff State Beach, Walton Lighthouse, Fishing Pier, Picnic Areas, Sand Dunes |
| Aptos Village | Charming village atmosphere with plenty of local shops, dining, and access to nearby hiking and biking trails. Offers a quaint experience for those looking to escape the busier coastal areas. | Aptos Creek, Redwood Forests, Local Restaurants, Antique Shops, Farmers Market |
| Rio del Mar | A quiet beach community known for its lovely beach and family-friendly atmosphere. Perfect for families and those looking for a calm beach getaway. | Rio del Mar Beach, Pajaro River, Aptos History Museum, Local Parks, Water Sports |
| New Brighton State Beach | Popular for its expansive beach and nature trails. A great spot for families and outdoor enthusiasts, drawing in visitors year-round. | New Brighton State Beach, Nature Trails, Camping Sites, Fishing Areas, Picnic Facilities |
| Santa Cruz Beach Boardwalk | Though slightly further, this iconic attraction is just a short drive away and draws millions of visitors yearly, making it a prime location for Airbnb investments. | Beach Boardwalk, Amusement Rides, Santa Cruz Wharf, Local Shops, Dining Options |
| Seascape Resort | A lovely resort area on the beach, attracting visitors looking for luxury accommodations and amenities. Ideal for those seeking a more upscale rental experience. | Seascape Beach, Spa Services, Golf Courses, Dining at the Resort, Beachfront Activities |
| Forest of Nisene Marks State Park | A local favorite for hiking and nature lovers, offering countless trails and beautiful landscapes. Attracts eco-tourists and outdoor enthusiasts. | Nisene Marks Trails, Redwood Forests, Picnic Areas, Nature Programs, Interpretive Signage |
| Capitola Village | A neighboring village known for its colorful beachfront and charming atmosphere, making it a desirable location for tourists looking for a quaint beach getaway. | Capitola Beach, Capitola Wharf, Local Shops, Restaurants, Art Galleries |
Understanding Airbnb License Requirements & STR Laws in Aptos (2026)
While Aptos, California, United States currently shows low STR regulations, specific Airbnb license requirements might still exist or change. Always verify the latest short term rental regulations and Airbnb license requirements directly with local government authorities for Aptos to ensure full compliance before hosting.
(Source: AirROI data, 2026, based on 2% licensed listings)
Top Performing Airbnb Properties in Aptos (2026)
Benchmark your potential! Explore examples of top-performing Airbnb properties in Aptosbased on Trailing Twelve Month (TTM) revenue. Analyze their characteristics, revenue, occupancy rate, and ADR to understand what drives success in this market.

Exclusive Modern Retreat- The Johanna House
Entire Place • 3 bedrooms

Peaceful Treehouse with Ocean View
Entire Place • 3 bedrooms

1950's Beachfront Home - Stunning Views!
Entire Place • 2 bedrooms

Rio Del Mar Beach House - Breathtaking Views!
Entire Place • 3 bedrooms

3 Bedroom Rio Del Mar Home - Steps to Beach!
Entire Place • 3 bedrooms

Spacious House in Walking Distance to the Beach
Entire Place • 4 bedrooms
Note: Performance varies based on location, size, amenities, seasonality, and management quality. Data reflects the past 12 months.
Top Performing Airbnb Hosts in Aptos (2026)
Learn from the best! This table showcases top-performing Airbnb hosts in Aptos based on the number of properties managed and estimated total revenue over the past year. Analyze their scale and performance metrics.
| Host Name | Properties | Grossing Revenue | Stay Reviews | Avg Rating |
|---|---|---|---|---|
| Ovr | 11 | $899,819 | 356 | 4.85/5.0 |
| Janiece | 2 | $264,640 | 769 | 4.88/5.0 |
| Monica | 1 | $182,996 | 67 | 4.97/5.0 |
| Power West Properties Inc. | 5 | $139,735 | 36 | 4.97/5.0 |
| Cheshire Rio | 2 | $134,325 | 12 | 4.94/5.0 |
| Bailey Property Management | 3 | $85,671 | 43 | 4.70/5.0 |
| Evolve | 2 | $75,957 | 24 | 4.67/5.0 |
| David | 1 | $53,343 | 56 | 5.00/5.0 |
| Shanda | 1 | $48,667 | 91 | 4.98/5.0 |
| Laura | 1 | $48,385 | 509 | 4.94/5.0 |
Analyzing the strategies of top hosts, such as their property selection, pricing, and guest communication, can offer valuable lessons for optimizing your own Airbnb operations in Aptos.
Dive Deeper: Advanced Aptos STR Market Data (2026)
Ready to unlock more insights? AirROI provides access to advanced metrics and comprehensive Airbnb data for Aptos. Explore detailed analytics beyond this report to refine your investment strategy, optimize pricing, and maximize your vacation rental profits.
Explore Advanced MetricsAptos Short-Term Rental Market Composition (2026): Property & Room Types
Room Type Distribution
Property Type Distribution
Market Composition Insights for Aptos
- The Aptos Airbnb market composition is heavily skewed towards Entire Home/Apt listings, which make up 92.9% of the 42 active rentals. This indicates strong guest preference for privacy and space.
- Looking at the property type distribution in Aptos, House properties are the most common (66.7%), reflecting the local real estate landscape.
- Houses represent a significant 66.7% portion, catering likely to families or larger groups.
- The presence of 7.1% Hotel/Boutique listings indicates integration with traditional hospitality.
- Smaller segments like others, unique stays, outdoor/unique (combined 9.6%) offer potential for unique stay experiences.
Aptos Airbnb Room Capacity Analysis (2026): Bedroom Distribution
Distribution of Listings by Number of Bedrooms
Room Capacity Insights for Aptos
- The dominant room capacity in Aptos is 2 bedrooms listings, making up 38.1% of the market. This suggests a strong demand for properties suitable for couples or solo travelers.
- Together, 2 bedrooms and 3 bedrooms properties represent 64.3% of the active Airbnb listings in Aptos, indicating a high concentration in these sizes.
- A significant 38.1% of listings offer 3+ bedrooms, catering to larger groups and families seeking more space in Aptos.
Aptos Vacation Rental Guest Capacity Trends (2026)
Distribution of Listings by Guest Capacity
Guest Capacity Insights for Aptos
- The most common guest capacity trend in Aptos vacation rentals is listings accommodating 6 guests (28.6%). This suggests the primary traveler segment is likely larger groups.
- Properties designed for 6 guests and 8+ guests dominate the Aptos STR market, accounting for 57.2% of listings.
- 57.2% of properties accommodate 6+ guests, serving the market segment for larger families or group travel in Aptos.
- On average, properties in Aptos are equipped to host 5.3 guests.
Aptos Airbnb Booking Patterns (2026): Available vs. Booked Days
Available Days Distribution
Booked Days Distribution
Booking Pattern Insights for Aptos
- The most common availability pattern in Aptos falls within the 271-366 days range, representing 42.9% of listings. This suggests many properties have significant open periods on their calendars.
- Approximately 83.4% of listings show high availability (181+ days open annually), indicating potential for increased bookings or specific owner usage patterns.
- For booked days, the 91-180 days range is most frequent in Aptos (42.9%), reflecting common guest stay durations or potential owner blocking patterns.
- A notable 16.7% of properties secure long booking periods (181+ days booked per year), highlighting successful long-term rental strategies or significant owner usage.
Aptos Airbnb Minimum Stay Requirements Analysis
Distribution of Listings by Minimum Night Requirement
1 Night
2 listings
4.8% of total
2 Nights
8 listings
19% of total
3 Nights
2 listings
4.8% of total
4-6 Nights
2 listings
4.8% of total
7-29 Nights
3 listings
7.1% of total
30+ Nights
25 listings
59.5% of total
Key Insights
- The most prevalent minimum stay requirement in Aptos is 30+ Nights, adopted by 59.5% of listings. This highlights the market's preference for longer commitments.
- A significant segment (59.5%) caters to monthly stays (30+ nights) in Aptos, pointing to opportunities in the extended-stay market.
Recommendations
- Align with the market by considering a 30+ Nights minimum stay, as 59.5% of Aptos hosts use this setting.
- If feasible, allowing 1-night stays, especially midweek or during low season, could capture last-minute bookings, as only 4.8% currently do.
- Explore offering discounts for stays of 30+ nights to attract the 59.5% of the market seeking extended stays.
- Adjust minimum nights based on seasonality – potentially shorter during low season and longer during peak demand periods in Aptos.
Aptos Airbnb Cancellation Policy Trends Analysis (2026)
Super Strict 30 Days
4 listings
9.5% of total
Limited
1 listings
2.4% of total
Flexible
5 listings
11.9% of total
Moderate
8 listings
19% of total
Firm
21 listings
50% of total
Strict
3 listings
7.1% of total
Cancellation Policy Insights for Aptos
- The prevailing Airbnb cancellation policy trend in Aptos is Firm, used by 50% of listings.
- A majority (57.1%) of hosts in Aptos utilize Firm or Strict policies, indicating a market where hosts prioritize booking security.
- Strict cancellation policies are quite rare (7.1%), potentially making listings with this policy less competitive unless justified by high demand or property type.
Recommendations for Hosts
- Consider adopting a Firm policy to align with the 50% market standard in Aptos.
- Using a Strict policy might deter some guests, as only 7.1% of listings use it. Evaluate if potential revenue protection outweighs possible lower booking rates.
- Regularly review your cancellation policy against competitors and market demand shifts in Aptos.
Aptos STR Booking Lead Time Analysis (2026)
Average Booking Lead Time by Month
Booking Lead Time Insights for Aptos
- The overall average booking lead time for vacation rentals in Aptos is 37 days.
- Guests book furthest in advance for stays during December (average 55 days), likely coinciding with peak travel demand or local events.
- The shortest booking windows occur for stays in May (average 17 days), indicating more last-minute travel plans during this time.
- Seasonally, Fall (44 days avg.) sees the longest lead times, while Spring (26 days avg.) has the shortest, reflecting typical travel planning cycles.
Recommendations for Hosts
- Use the overall average lead time (37 days) as a baseline for your pricing and availability strategy in Aptos.
- For December stays, consider implementing length-of-stay discounts or slightly higher rates for bookings made less than 55 days out to capitalize on advance planning.
- Target marketing efforts for the Fall season well in advance (at least 44 days) to capture early planners.
- Monitor your own booking lead times against these Aptos averages to identify opportunities for dynamic pricing adjustments.
Popular & Essential Airbnb Amenities in Aptos (2026)
Amenity Prevalence
Amenity Insights for Aptos
- Essential amenities in Aptos that guests expect include: Wifi, Smoke alarm, Carbon monoxide alarm, Heating, TV. Lacking these (any) could significantly impact bookings.
- Popular amenities like Hot water, Dishes and silverware, Kitchen are common but not universal. Offering these can provide a competitive edge.
Recommendations for Hosts
- Ensure your listing includes all essential amenities for Aptos: Wifi, Smoke alarm, Carbon monoxide alarm, Heating, TV.
- Prioritize adding missing essentials: Smoke alarm, Carbon monoxide alarm, Heating, TV.
- Consider adding popular differentiators like Hot water or Dishes and silverware to increase appeal.
- Highlight unique or less common amenities you offer (e.g., hot tub, dedicated workspace, EV charger) in your listing description and photos.
- Regularly check competitor amenities in Aptos to stay competitive.
Aptos Airbnb Guest Demographics & Profile Analysis (2026)
Guest Profile Summary for Aptos
- The typical guest profile for Airbnb in Aptos consists of primarily domestic travelers (97%), often arriving from nearby San Francisco, typically belonging to the Post-2000s (Gen Z/Alpha) group (50%), primarily speaking English or Spanish.
- Domestic travelers account for 96.8% of guests.
- Key international markets include United States (96.8%) and Germany (0.7%).
- Top languages spoken are English (68.9%) followed by Spanish (14.6%).
- A significant demographic segment is the Post-2000s (Gen Z/Alpha) group, representing 50% of guests.
Recommendations for Hosts
- Target domestic marketing efforts towards travelers from San Francisco and Los Angeles.
- Tailor amenities and listing descriptions to appeal to the dominant Post-2000s (Gen Z/Alpha) demographic (e.g., highlight fast WiFi, smart home features, local guides).
- Highlight unique local experiences or amenities relevant to the primary guest profile.
- Consider seasonal promotions aligned with peak travel times for key origin markets.
Nearby Short-Term Rental Market Comparison
How does the Aptos Airbnb market stack up against its neighbors? Compare key performance metrics like average monthly revenue, ADR, and occupancy rates in surrounding areas to understand the broader regional STR landscape.
| Market | Active Properties | Monthly Revenue | Daily Rate | Avg. Occupancy |
|---|---|---|---|---|
| Carmel Point | 15 | $14,483 | $1046.17 | 54% |
| Del Monte Forest | 105 | $10,280 | $964.89 | 47% |
| Moss Beach | 34 | $10,092 | $676.91 | 53% |
| Carmel-by-the-Sea | 305 | $8,657 | $680.02 | 49% |
| Pleasure Point | 90 | $7,920 | $525.95 | 52% |
| Carmel | 29 | $7,901 | $597.00 | 49% |
| Castroville | 16 | $7,830 | $558.55 | 50% |
| Stinson Beach | 106 | $7,814 | $812.15 | 43% |
| Sand City | 10 | $7,391 | $497.43 | 60% |
| Del Rey Oaks | 33 | $7,281 | $474.67 | 54% |