Arroyo Grande Airbnb Market Analysis 2026: Short Term Rental Data & Vacation Rental Statistics in California, United States
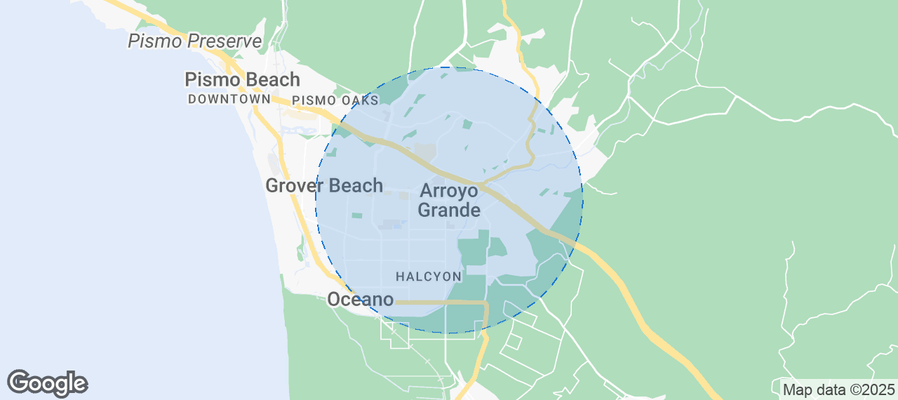
Is Airbnb profitable in Arroyo Grande in 2026? Explore comprehensive Airbnb analytics for Arroyo Grande, California, United States to uncover income potential. This 2026 STR market report for Arroyo Grande, based on AirROI data from February 2025 to January 2026, reveals key trends in the market of 219 active listings.
Whether you're considering an Airbnb investment in Arroyo Grande, optimizing your existing vacation rental, or exploring rental arbitrage opportunities, understanding the Arroyo Grande Airbnb data is crucial. Leveraging the low regulation environment is key to maximizing your short term rental income potential. Let's dive into the specifics.
Key Arroyo Grande Airbnb Performance Metrics Overview
Monthly Airbnb Revenue Variations & Income Potential in Arroyo Grande (2026)
Understanding the monthly revenue variations for Airbnb listings in Arroyo Grande is key to maximizing your short term rental income potential. Seasonality significantly impacts earnings. Our analysis, based on data from the past 12 months, shows that the peak revenue month for STRs in Arroyo Grande is typically July, while February often presents the lowest earnings, highlighting opportunities for strategic pricing adjustments during shoulder and low seasons. Explore the typical Airbnb income in Arroyo Grande across different performance tiers:
- Best-in-class properties (Top 10%) achieve $10,857+ monthly, often utilizing dynamic pricing and superior guest experiences.
- Strong performing properties (Top 25%) earn $6,361 or more, indicating effective management and desirable locations/amenities.
- Typical properties (Median) generate around $3,364 per month, representing the average market performance.
- Entry-level properties (Bottom 25%) see earnings around $1,735, often with potential for optimization.
Average Monthly Airbnb Earnings Trend in Arroyo Grande
Arroyo Grande Airbnb Occupancy Rate Trends (2026)
Maximize your bookings by understanding the Arroyo Grande STR occupancy trends. Seasonal demand shifts significantly influence how often properties are booked. Typically, Julysees the highest demand (peak season occupancy), while January experiences the lowest (low season). Effective strategies, like adjusting minimum stays or offering promotions, can boost occupancy during slower periods. Here's how different property tiers perform in Arroyo Grande:
- Best-in-class properties (Top 10%) achieve 79%+ occupancy, indicating high desirability and potentially optimized availability.
- Strong performing properties (Top 25%) maintain 63% or higher occupancy, suggesting good market fit and guest satisfaction.
- Typical properties (Median) have an occupancy rate around 44%.
- Entry-level properties (Bottom 25%) average 25% occupancy, potentially facing higher vacancy.
Average Monthly Occupancy Rate Trend in Arroyo Grande
Average Daily Rate (ADR) Airbnb Trends in Arroyo Grande (2026)
Effective short term rental pricing strategy in Arroyo Grande involves understanding monthly ADR fluctuations. The Average Daily Rate (ADR) for Airbnb in Arroyo Grande typically peaks in June and dips lowest during February. Leveraging Airbnb dynamic pricing tools or strategies based on this seasonality can significantly boost revenue. Here's a look at the typical nightly rates achieved:
- Best-in-class properties (Top 10%) command rates of $797+ per night, often due to premium features or locations.
- Strong performing properties (Top 25%) achieve nightly rates of $428 or more.
- Typical properties (Median) charge around $244 per night.
- Entry-level properties (Bottom 25%) earn around $154 per night.
Average Daily Rate (ADR) Trend by Month in Arroyo Grande
Get Live Arroyo Grande Market Intelligence 👇
Explore Real-time Analytics
Airbnb Seasonality Analysis & Trends in Arroyo Grande (2026)
Peak Season (July, June, August)
- Revenue averages $7,604 per month
- Occupancy rates average 54.3%
- Daily rates average $384
Shoulder Season
- Revenue averages $5,426 per month
- Occupancy maintains around 43.8%
- Daily rates hold near $361
Low Season (January, February, September)
- Revenue drops to average $4,229 per month
- Occupancy decreases to average 38.1%
- Daily rates adjust to average $345
Seasonality Insights for Arroyo Grande
- The Airbnb seasonality in Arroyo Grande shows highly seasonal trends requiring careful strategy. While the sections above show seasonal averages, it's also insightful to look at the extremes:
- During the high season, the absolute peak month showcases Arroyo Grande's highest earning potential, with monthly revenues capable of climbing to $8,433, occupancy reaching a high of 59.2%, and ADRs peaking at $397.
- Conversely, the slowest single month of the year, typically falling within the low season, marks the market's lowest point. In this month, revenue might dip to $3,646, occupancy could drop to 34.3%, and ADRs may adjust down to $325.
- Understanding both the seasonal averages and these monthly peaks and troughs in revenue, occupancy, and ADR is crucial for maximizing your Airbnb profit potential in Arroyo Grande.
Seasonal Strategies for Maximizing Profit
- Peak Season: Maximize revenue through premium pricing and potentially longer minimum stays. Ensure high availability.
- Low Season: Offer competitive pricing, special promotions (e.g., extended stay discounts), and flexible cancellation policies. Target off-season travelers like remote workers or budget-conscious guests.
- Shoulder Seasons: Implement dynamic pricing that balances peak and low rates. Target weekend travelers or specific events. Offer slightly more flexible terms than peak season.
- Regularly analyze your own performance against these Arroyo Grande seasonality benchmarks and adjust your pricing and availability strategy accordingly.
Best Areas for Airbnb Investment in Arroyo Grande (2026)
Exploring the top neighborhoods for short-term rentals in Arroyo Grande? This section highlights key areas, outlining why they are attractive for hosts and guests, along with notable local attractions. Consider these locations based on your target guest profile and investment strategy.
| Neighborhood / Area | Why Host Here? (Target Guests & Appeal) | Key Attractions & Landmarks |
|---|---|---|
| Downtown Arroyo Grande | The heart of Arroyo Grande, known for its charming village atmosphere, historic buildings, and local shops. It's a great spot for visitors wanting to experience the town's local flavor and culture. | Arroyo Grande Village, Historic Heritage House, The Arroyo Grande Farmers Market, The Arroyo Grande Dinner Theater, Local Cafes and Restaurants |
| Pismo Beach | Just a short drive from Arroyo Grande, Pismo Beach is famous for its stunning coastline and beach activities. It's an attractive destination for water lovers and families looking for beach fun. | Pismo Beach Pier, Oceano Dunes, Pismo Preserve, Dinosaur Caves Park, Pismo Beach Premium Outlets |
| Grover Beach | Adjacent to Pismo Beach, Grover Beach offers a more relaxed beach vibe. It's a great spot for visitors who want to enjoy the surf while being close to Arroyo Grande. | Grover Beach Pier, Grover Beach Sand Dune, Narrow Gauge Railroad Trail, Paddleboarding, Local Beachside Cafes |
| Avila Beach | This picturesque beach community is known for its calm waters and charming beachfront. It's perfect for relaxation and attracts couples and families. | Avila Beach Promenade, Avila Valley Barn, Morro Bay and the scenic views, Wine Tasting near Avila, Avila Hot Springs |
| Oceano | Oceano is known for its expansive beach and dunes which provide unique outdoor experiences, making it a popular choice for those looking for adventure. | Oceano Dunes State Vehicular Recreation Area, Oceano Lagoon, Paddleboarding and Kayaking, Riding ATVs on the beach, Local Seafood Restaurants |
| Santa Maria | A bit further inland, Santa Maria is known for its wine country and agricultural heritage. It's ideal for visitors wanting to explore vineyards and local cuisine. | Sunken Gardens, Santa Maria Valley wineries, Santa Maria Style Barbecue, Local Festivals, Dunes Center |
| Shell Beach | A beautiful coastal area that offers a quieter beach experience compared to neighboring beaches. Perfect for romantic getaways and scenic walks. | Dramatic cliffs and views, Shell Beach Tide Pools, Pismo Beach Golf Course, Local Restaurants, Beachfront Parks |
| Five Cities Plaza | An important commercial area which provides easy access to various amenities and services. Ideal for travelers looking for shopping and dining options. | Five Cities Plaza Shopping, Restaurants and Cafes, Fitness Centers and Spas, Cinema, Grocery Stores |
Understanding Airbnb License Requirements & STR Laws in Arroyo Grande (2026)
While Arroyo Grande, California, United States currently shows low STR regulations, specific Airbnb license requirements might still exist or change. Always verify the latest short term rental regulations and Airbnb license requirements directly with local government authorities for Arroyo Grande to ensure full compliance before hosting.
(Source: AirROI data, 2026, finding no licensed listings among those analyzed)
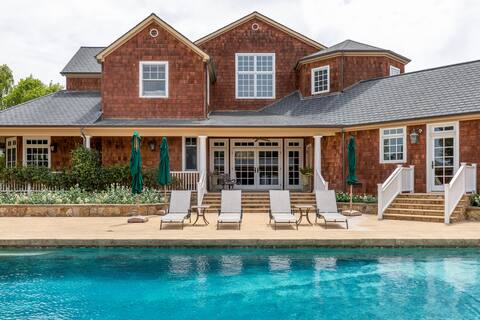
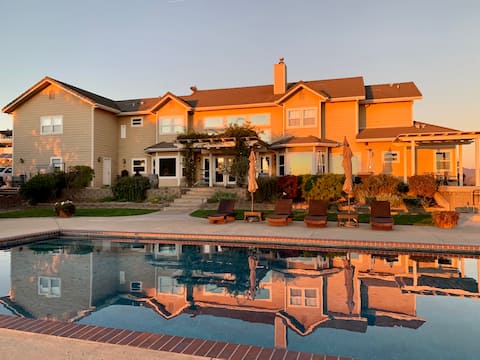
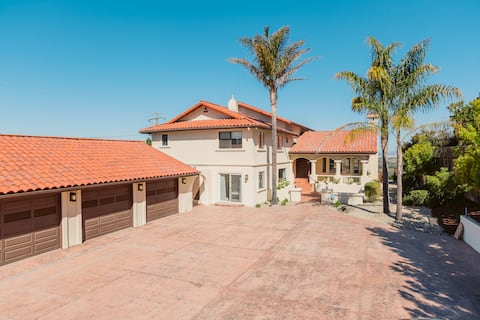
Top Performing Airbnb Properties in Arroyo Grande (2026)
Benchmark your potential! Explore examples of top-performing Airbnb properties in Arroyo Grandebased on Trailing Twelve Month (TTM) revenue. Analyze their characteristics, revenue, occupancy rate, and ADR to understand what drives success in this market.
Luxury Coastal Wine Country Hilltop Estate
Entire Place • 8 bedrooms

Retro English Mansion Sleeps 35 Gardens
Entire Place • 10 bedrooms
California Central Coast Oasis
Entire Place • 5 bedrooms

Retro English Mansion Sleeps 18 Gardens
Entire Place • 6 bedrooms
Stunning 8 Bedroom Oceanview Villa with Pool & Spa
Entire Place • 8 bedrooms
Hillside View Times Two
Entire Place • 7 bedrooms
Note: Performance varies based on location, size, amenities, seasonality, and management quality. Data reflects the past 12 months.
Top Performing Airbnb Hosts in Arroyo Grande (2026)
Learn from the best! This table showcases top-performing Airbnb hosts in Arroyo Grande based on the number of properties managed and estimated total revenue over the past year. Analyze their scale and performance metrics.
| Host Name | Properties | Grossing Revenue | Stay Reviews | Avg Rating |
|---|---|---|---|---|
| Stephanie | 1 | $906,598 | 131 | 4.98/5.0 |
| John | 2 | $886,665 | 46 | 5.00/5.0 |
| John | 5 | $725,235 | 337 | 5.00/5.0 |
| Patricia | 1 | $493,653 | 72 | 5.00/5.0 |
| Jacalyn | 1 | $253,404 | 91 | 4.96/5.0 |
| David | 1 | $221,377 | 93 | 4.94/5.0 |
| Susie & Tim | 3 | $214,816 | 603 | 4.99/5.0 |
| Rammy | 1 | $204,214 | 155 | 4.99/5.0 |
| Melissa | 1 | $200,561 | 65 | 4.95/5.0 |
| David | 1 | $193,625 | 24 | 5.00/5.0 |
Analyzing the strategies of top hosts, such as their property selection, pricing, and guest communication, can offer valuable lessons for optimizing your own Airbnb operations in Arroyo Grande.
Dive Deeper: Advanced Arroyo Grande STR Market Data (2026)
Ready to unlock more insights? AirROI provides access to advanced metrics and comprehensive Airbnb data for Arroyo Grande. Explore detailed analytics beyond this report to refine your investment strategy, optimize pricing, and maximize your vacation rental profits.
Explore Advanced MetricsArroyo Grande Short-Term Rental Market Composition (2026): Property & Room Types
Room Type Distribution
Property Type Distribution
Market Composition Insights for Arroyo Grande
- The Arroyo Grande Airbnb market composition is heavily skewed towards Entire Home/Apt listings, which make up 92.2% of the 219 active rentals. This indicates strong guest preference for privacy and space.
- Looking at the property type distribution in Arroyo Grande, House properties are the most common (53.4%), reflecting the local real estate landscape.
- Houses represent a significant 53.4% portion, catering likely to families or larger groups.
- The presence of 19.6% Hotel/Boutique listings indicates integration with traditional hospitality.
- Smaller segments like unique stays (combined 1.4%) offer potential for unique stay experiences.
Arroyo Grande Airbnb Room Capacity Analysis (2026): Bedroom Distribution
Distribution of Listings by Number of Bedrooms
Room Capacity Insights for Arroyo Grande
- The dominant room capacity in Arroyo Grande is 1 bedroom listings, making up 36.5% of the market. This suggests a strong demand for properties suitable for couples or solo travelers.
- Together, 1 bedroom and 3 bedrooms properties represent 56.6% of the active Airbnb listings in Arroyo Grande, indicating a high concentration in these sizes.
- A significant 37.9% of listings offer 3+ bedrooms, catering to larger groups and families seeking more space in Arroyo Grande.
Arroyo Grande Vacation Rental Guest Capacity Trends (2026)
Distribution of Listings by Guest Capacity
Guest Capacity Insights for Arroyo Grande
- The most common guest capacity trend in Arroyo Grande vacation rentals is listings accommodating 8+ guests (28.8%). This suggests the primary traveler segment is likely larger groups.
- Properties designed for 8+ guests and 2 guests dominate the Arroyo Grande STR market, accounting for 55.7% of listings.
- 46.1% of properties accommodate 6+ guests, serving the market segment for larger families or group travel in Arroyo Grande.
- On average, properties in Arroyo Grande are equipped to host 4.7 guests.
Arroyo Grande Airbnb Booking Patterns (2026): Available vs. Booked Days
Available Days Distribution
Booked Days Distribution
Booking Pattern Insights for Arroyo Grande
- The most common availability pattern in Arroyo Grande falls within the 181-270 days range, representing 38.8% of listings. This suggests many properties have significant open periods on their calendars.
- Approximately 72.1% of listings show high availability (181+ days open annually), indicating potential for increased bookings or specific owner usage patterns.
- For booked days, the 91-180 days range is most frequent in Arroyo Grande (37.9%), reflecting common guest stay durations or potential owner blocking patterns.
- A notable 29.7% of properties secure long booking periods (181+ days booked per year), highlighting successful long-term rental strategies or significant owner usage.
Arroyo Grande Airbnb Minimum Stay Requirements Analysis
Distribution of Listings by Minimum Night Requirement
1 Night
45 listings
20.5% of total
2 Nights
87 listings
39.7% of total
3 Nights
8 listings
3.7% of total
4-6 Nights
5 listings
2.3% of total
7-29 Nights
6 listings
2.7% of total
30+ Nights
68 listings
31.1% of total
Key Insights
- The most prevalent minimum stay requirement in Arroyo Grande is 2 Nights, adopted by 39.7% of listings. This highlights the market's preference for shorter, flexible bookings.
- A strong majority (60.2%) of the Arroyo Grande Airbnb data shows acceptance of very short stays (1-2 nights), indicating a dynamic, high-turnover market.
- A significant segment (31.1%) caters to monthly stays (30+ nights) in Arroyo Grande, pointing to opportunities in the extended-stay market.
Recommendations
- Align with the market by considering a 2 Nights minimum stay, as 39.7% of Arroyo Grande hosts use this setting.
- If feasible, allowing 1-night stays, especially midweek or during low season, could capture last-minute bookings, as only 20.5% currently do.
- Explore offering discounts for stays of 30+ nights to attract the 31.1% of the market seeking extended stays.
- Adjust minimum nights based on seasonality – potentially shorter during low season and longer during peak demand periods in Arroyo Grande.
Arroyo Grande Airbnb Cancellation Policy Trends Analysis (2026)
Super Strict 30 Days
3 listings
1.4% of total
Limited
4 listings
1.8% of total
Flexible
39 listings
18% of total
Moderate
71 listings
32.7% of total
Firm
79 listings
36.4% of total
Strict
21 listings
9.7% of total
Cancellation Policy Insights for Arroyo Grande
- The prevailing Airbnb cancellation policy trend in Arroyo Grande is Firm, used by 36.4% of listings.
- There's a relatively balanced mix between guest-friendly (50.7%) and stricter (46.1%) policies, offering choices for different guest needs.
- Strict cancellation policies are quite rare (9.7%), potentially making listings with this policy less competitive unless justified by high demand or property type.
Recommendations for Hosts
- Consider adopting a Firm policy to align with the 36.4% market standard in Arroyo Grande.
- Using a Strict policy might deter some guests, as only 9.7% of listings use it. Evaluate if potential revenue protection outweighs possible lower booking rates.
- Regularly review your cancellation policy against competitors and market demand shifts in Arroyo Grande.
Arroyo Grande STR Booking Lead Time Analysis (2026)
Average Booking Lead Time by Month
Booking Lead Time Insights for Arroyo Grande
- The overall average booking lead time for vacation rentals in Arroyo Grande is 52 days.
- Guests book furthest in advance for stays during June (average 81 days), likely coinciding with peak travel demand or local events.
- The shortest booking windows occur for stays in February (average 32 days), indicating more last-minute travel plans during this time.
- Seasonally, Summer (65 days avg.) sees the longest lead times, while Spring (40 days avg.) has the shortest, reflecting typical travel planning cycles.
Recommendations for Hosts
- Use the overall average lead time (52 days) as a baseline for your pricing and availability strategy in Arroyo Grande.
- For June stays, consider implementing length-of-stay discounts or slightly higher rates for bookings made less than 81 days out to capitalize on advance planning.
- Target marketing efforts for the Summer season well in advance (at least 65 days) to capture early planners.
- Monitor your own booking lead times against these Arroyo Grande averages to identify opportunities for dynamic pricing adjustments.
Popular & Essential Airbnb Amenities in Arroyo Grande (2026)
Amenity Prevalence
Amenity Insights for Arroyo Grande
- Essential amenities in Arroyo Grande that guests expect include: Wifi, Smoke alarm, Coffee maker, Free parking on premises. Lacking these (any) could significantly impact bookings.
- Popular amenities like Heating, Hot water, TV are common but not universal. Offering these can provide a competitive edge.
Recommendations for Hosts
- Ensure your listing includes all essential amenities for Arroyo Grande: Wifi, Smoke alarm, Coffee maker, Free parking on premises.
- Prioritize adding missing essentials: Wifi, Smoke alarm, Coffee maker, Free parking on premises.
- Consider adding popular differentiators like Heating or Hot water to increase appeal.
- Highlight unique or less common amenities you offer (e.g., hot tub, dedicated workspace, EV charger) in your listing description and photos.
- Regularly check competitor amenities in Arroyo Grande to stay competitive.
Arroyo Grande Airbnb Guest Demographics & Profile Analysis (2026)
Guest Profile Summary for Arroyo Grande
- The typical guest profile for Airbnb in Arroyo Grande consists of primarily domestic travelers (95%), often arriving from nearby Los Angeles, typically belonging to the Post-2000s (Gen Z/Alpha) group (50%), primarily speaking English or Spanish.
- Domestic travelers account for 94.8% of guests.
- Key international markets include United States (94.8%) and United Kingdom (1.1%).
- Top languages spoken are English (62.4%) followed by Spanish (16.8%).
- A significant demographic segment is the Post-2000s (Gen Z/Alpha) group, representing 50% of guests.
Recommendations for Hosts
- Target domestic marketing efforts towards travelers from Los Angeles and San Francisco.
- Tailor amenities and listing descriptions to appeal to the dominant Post-2000s (Gen Z/Alpha) demographic (e.g., highlight fast WiFi, smart home features, local guides).
- Highlight unique local experiences or amenities relevant to the primary guest profile.
- Consider seasonal promotions aligned with peak travel times for key origin markets.
Nearby Short-Term Rental Market Comparison
How does the Arroyo Grande Airbnb market stack up against its neighbors? Compare key performance metrics like average monthly revenue, ADR, and occupancy rates in surrounding areas to understand the broader regional STR landscape.
| Market | Active Properties | Monthly Revenue | Daily Rate | Avg. Occupancy |
|---|---|---|---|---|
| Carmel Point | 15 | $14,483 | $1046.17 | 54% |
| Montecito | 127 | $10,744 | $950.35 | 51% |
| Del Monte Forest | 105 | $10,280 | $964.89 | 47% |
| Carmel-by-the-Sea | 305 | $8,657 | $680.02 | 49% |
| Pleasure Point | 90 | $7,920 | $525.95 | 52% |
| Carmel | 29 | $7,901 | $597.00 | 49% |
| Castroville | 16 | $7,830 | $558.55 | 50% |
| Sand City | 10 | $7,391 | $497.43 | 60% |
| Del Rey Oaks | 33 | $7,281 | $474.67 | 54% |
| Los Olivos | 30 | $7,240 | $705.20 | 43% |