Banning Airbnb Market Analysis 2025: Short Term Rental Data & Vacation Rental Statistics in California, United States
Is Airbnb profitable in Banning in 2025? Explore comprehensive Airbnb analytics for Banning, California, United States to uncover income potential. This 2025 STR market report for Banning, based on AirROI data from November 2024 to October 2025, reveals key trends in the niche market of 20 active listings.
Whether you're considering an Airbnb investment in Banning, optimizing your existing vacation rental, or exploring rental arbitrage opportunities, understanding the Banning Airbnb data is crucial. Leveraging the low regulation environment is key to maximizing your short term rental income potential. Let's dive into the specifics.
Key Banning Airbnb Performance Metrics Overview
Monthly Airbnb Revenue Variations & Income Potential in Banning (2025)
Understanding the monthly revenue variations for Airbnb listings in Banning is key to maximizing your short term rental income potential. Seasonality significantly impacts earnings. Our analysis, based on data from the past 12 months, shows that the peak revenue month for STRs in Banning is typically June, while February often presents the lowest earnings, highlighting opportunities for strategic pricing adjustments during shoulder and low seasons. Explore the typical Airbnb income in Banning across different performance tiers:
- Best-in-class properties (Top 10%) achieve $7,937+ monthly, often utilizing dynamic pricing and superior guest experiences.
- Strong performing properties (Top 25%) earn $4,474 or more, indicating effective management and desirable locations/amenities.
- Typical properties (Median) generate around $1,771 per month, representing the average market performance.
- Entry-level properties (Bottom 25%) see earnings around $888, often with potential for optimization.
Average Monthly Airbnb Earnings Trend in Banning
Banning Airbnb Occupancy Rate Trends (2025)
Maximize your bookings by understanding the Banning STR occupancy trends. Seasonal demand shifts significantly influence how often properties are booked. Typically, Junesees the highest demand (peak season occupancy), while February experiences the lowest (low season). Effective strategies, like adjusting minimum stays or offering promotions, can boost occupancy during slower periods. Here's how different property tiers perform in Banning:
- Best-in-class properties (Top 10%) achieve 65%+ occupancy, indicating high desirability and potentially optimized availability.
- Strong performing properties (Top 25%) maintain 54% or higher occupancy, suggesting good market fit and guest satisfaction.
- Typical properties (Median) have an occupancy rate around 37%.
- Entry-level properties (Bottom 25%) average 21% occupancy, potentially facing higher vacancy.
Average Monthly Occupancy Rate Trend in Banning
Average Daily Rate (ADR) Airbnb Trends in Banning (2025)
Effective short term rental pricing strategy in Banning involves understanding monthly ADR fluctuations. The Average Daily Rate (ADR) for Airbnb in Banning typically peaks in June and dips lowest during January. Leveraging Airbnb dynamic pricing tools or strategies based on this seasonality can significantly boost revenue. Here's a look at the typical nightly rates achieved:
- Best-in-class properties (Top 10%) command rates of $436+ per night, often due to premium features or locations.
- Strong performing properties (Top 25%) achieve nightly rates of $327 or more.
- Typical properties (Median) charge around $128 per night.
- Entry-level properties (Bottom 25%) earn around $92 per night.
Average Daily Rate (ADR) Trend by Month in Banning
Get Live Banning Market Intelligence 👇
Explore Real-time Analytics
Airbnb Seasonality Analysis & Trends in Banning (2025)
Peak Season (June, July, August)
- Revenue averages $4,688 per month
- Occupancy rates average 46.7%
- Daily rates average $228
Shoulder Season
- Revenue averages $2,813 per month
- Occupancy maintains around 37.6%
- Daily rates hold near $210
Low Season (February, March, November)
- Revenue drops to average $2,207 per month
- Occupancy decreases to average 32.7%
- Daily rates adjust to average $192
Seasonality Insights for Banning
- The Airbnb seasonality in Banning shows highly seasonal trends requiring careful strategy. While the sections above show seasonal averages, it's also insightful to look at the extremes:
- During the high season, the absolute peak month showcases Banning's highest earning potential, with monthly revenues capable of climbing to $5,818, occupancy reaching a high of 56.1%, and ADRs peaking at $234.
- Conversely, the slowest single month of the year, typically falling within the low season, marks the market's lowest point. In this month, revenue might dip to $2,077, occupancy could drop to 30.0%, and ADRs may adjust down to $185.
- Understanding both the seasonal averages and these monthly peaks and troughs in revenue, occupancy, and ADR is crucial for maximizing your Airbnb profit potential in Banning.
Seasonal Strategies for Maximizing Profit
- Peak Season: Maximize revenue through premium pricing and potentially longer minimum stays. Ensure high availability.
- Low Season: Offer competitive pricing, special promotions (e.g., extended stay discounts), and flexible cancellation policies. Target off-season travelers like remote workers or budget-conscious guests.
- Shoulder Seasons: Implement dynamic pricing that balances peak and low rates. Target weekend travelers or specific events. Offer slightly more flexible terms than peak season.
- Regularly analyze your own performance against these Banning seasonality benchmarks and adjust your pricing and availability strategy accordingly.
Best Areas for Airbnb Investment in Banning (2025)
Exploring the top neighborhoods for short-term rentals in Banning? This section highlights key areas, outlining why they are attractive for hosts and guests, along with notable local attractions. Consider these locations based on your target guest profile and investment strategy.
| Neighborhood / Area | Why Host Here? (Target Guests & Appeal) | Key Attractions & Landmarks |
|---|---|---|
| Banning Heights | A serene neighborhood with stunning views of the San Jacinto Mountains. Ideal for those looking to escape the hustle and bustle, surrounded by nature and hiking trails. | Banning Municipal Airport, San Jacinto Mountains, Banning City Park, Malki Museum |
| Downtown Banning | The heart of Banning featuring charming local shops and eateries. A prime spot for visitors wanting to explore the local culture and community events. | Banning Historical Museum, Local shops and cafes, Banning Art Gallery, San Gorgonio Pass Water Agency |
| Sun Lakes Country Club | An active adult community with plenty of amenities and activities, perfect for retirees looking for a longer-term stay. | Golf courses, Community pools, Fitness centers, Social clubs |
| Twin Pines | A quiet residential area that offers a peaceful environment, making it an attractive weekend getaway for families looking for a tranquil retreat. | Twin Pines Park, Local hiking trails, Proximity to Palm Springs |
| Highland Springs | Known for its golf courses and natural beauty. This area draws golf enthusiasts and nature lovers looking for a relaxing vacation. | Highland Springs Golf Club, Banning Golf Course, Nature trails |
| Cabazon | Located near the Cabazon Outlets, making it a popular shopping destination for visitors. Great for those looking for a blend of retail therapy and outdoor activities. | Cabazon Outlets, Morongo Casino Resort & Spa, Cabazon Dinosaur Park |
| Beaumont | Just a short drive away, Beaumont offers family-friendly activities and is close to many regional attractions, making it a great spot for family vacations. | Beaumont Civic Center, Beaumont Parks, Gambling casinos nearby |
| I-10 Corridor | A key transportation route that makes it easy for travelers to access many Southern California attractions, from Los Angeles to Palm Springs, making it a strategic Airbnb location. | Easy access to highways, Close to regional attractions, Various dining options along the route |
Understanding Airbnb License Requirements & STR Laws in Banning (2025)
While Banning, California, United States currently shows low STR regulations, specific Airbnb license requirements might still exist or change. Always verify the latest short term rental regulations and Airbnb license requirements directly with local government authorities for Banning to ensure full compliance before hosting.
(Source: AirROI data, 2025, finding no licensed listings among those analyzed)
Top Performing Airbnb Properties in Banning (2025)
Benchmark your potential! Explore examples of top-performing Airbnb properties in Banningbased on Trailing Twelve Month (TTM) revenue. Analyze their characteristics, revenue, occupancy rate, and ADR to understand what drives success in this market.
Casa Oasis in Banning:Near Morongo & Palms Springs
Entire Place • 4 bedrooms

Boulderland A-frame on 8 acres / 4 miles from Town
Entire Place • 3 bedrooms
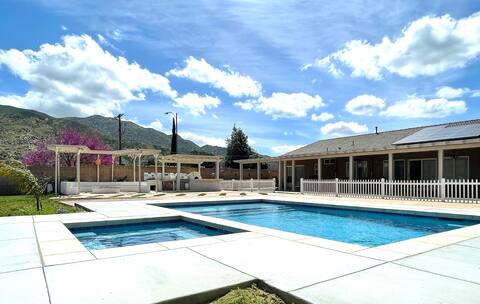
Large Home w/ Spacious Backyard and Pool
Entire Place • 4 bedrooms

Casa Blanca- Arcade, Theatre, GameRoom, RV Parking
Entire Place • 4 bedrooms

Comfortable and Enjoyable place to relax!
Entire Place • 3 bedrooms

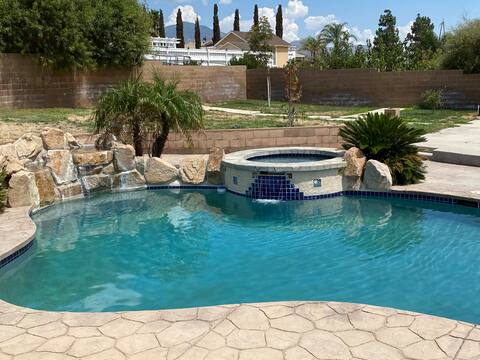
The Banning pool house
Entire Place • 4 bedrooms
Note: Performance varies based on location, size, amenities, seasonality, and management quality. Data reflects the past 12 months.
Top Performing Airbnb Hosts in Banning (2025)
Learn from the best! This table showcases top-performing Airbnb hosts in Banning based on the number of properties managed and estimated total revenue over the past year. Analyze their scale and performance metrics.
| Host Name | Properties | Grossing Revenue | Stay Reviews | Avg Rating |
|---|---|---|---|---|
| Brandon | 1 | $101,535 | 47 | 4.98/5.0 |
| Minna | 1 | $82,404 | 137 | 5.00/5.0 |
| Rigoberto | 1 | $54,591 | 23 | 4.83/5.0 |
| Casa Mia Ventures | 1 | $49,186 | 153 | 4.92/5.0 |
| Arturo | 1 | $47,785 | 51 | 4.98/5.0 |
| Catalina | 1 | $36,378 | 44 | 4.73/5.0 |
| Erika | 2 | $32,492 | 266 | 4.85/5.0 |
| Jeanne | 1 | $17,918 | 117 | 4.94/5.0 |
| Deisy | 1 | $14,493 | 156 | 4.91/5.0 |
| Steven | 1 | $14,219 | 8 | 5.00/5.0 |
Analyzing the strategies of top hosts, such as their property selection, pricing, and guest communication, can offer valuable lessons for optimizing your own Airbnb operations in Banning.
Dive Deeper: Advanced Banning STR Market Data (2025)
Ready to unlock more insights? AirROI provides access to advanced metrics and comprehensive Airbnb data for Banning. Explore detailed analytics beyond this report to refine your investment strategy, optimize pricing, and maximize your vacation rental profits.
Explore Advanced MetricsBanning Short-Term Rental Market Composition (2025): Property & Room Types
Room Type Distribution
Property Type Distribution
Market Composition Insights for Banning
- The Banning Airbnb market composition is heavily skewed towards Entire Home/Apt listings, which make up 80% of the 20 active rentals. This indicates strong guest preference for privacy and space.
- Looking at the property type distribution in Banning, House properties are the most common (65%), reflecting the local real estate landscape.
- Houses represent a significant 65% portion, catering likely to families or larger groups.
- The presence of 10% Hotel/Boutique listings indicates integration with traditional hospitality.
Banning Airbnb Room Capacity Analysis (2025): Bedroom Distribution
Distribution of Listings by Number of Bedrooms
Room Capacity Insights for Banning
- The dominant room capacity in Banning is 2 bedrooms listings, making up 30% of the market. This suggests a strong demand for properties suitable for couples or solo travelers.
- Together, 2 bedrooms and 1 bedroom properties represent 50.0% of the active Airbnb listings in Banning, indicating a high concentration in these sizes.
- A significant 30.0% of listings offer 3+ bedrooms, catering to larger groups and families seeking more space in Banning.
Banning Vacation Rental Guest Capacity Trends (2025)
Distribution of Listings by Guest Capacity
Guest Capacity Insights for Banning
- The most common guest capacity trend in Banning vacation rentals is listings accommodating 8+ guests (30%). This suggests the primary traveler segment is likely larger groups.
- Properties designed for 8+ guests and 2 guests dominate the Banning STR market, accounting for 50.0% of listings.
- 40.0% of properties accommodate 6+ guests, serving the market segment for larger families or group travel in Banning.
- On average, properties in Banning are equipped to host 4.2 guests.
Banning Airbnb Booking Patterns (2025): Available vs. Booked Days
Available Days Distribution
Booked Days Distribution
Booking Pattern Insights for Banning
- The most common availability pattern in Banning falls within the 181-270 days range, representing 45% of listings. This suggests many properties have significant open periods on their calendars.
- Approximately 90.0% of listings show high availability (181+ days open annually), indicating potential for increased bookings or specific owner usage patterns.
- For booked days, the 91-180 days range is most frequent in Banning (40%), reflecting common guest stay durations or potential owner blocking patterns.
- A notable 15.0% of properties secure long booking periods (181+ days booked per year), highlighting successful long-term rental strategies or significant owner usage.
Banning Airbnb Minimum Stay Requirements Analysis
Distribution of Listings by Minimum Night Requirement
1 Night
11 listings
55% of total
2 Nights
5 listings
25% of total
4-6 Nights
2 listings
10% of total
30+ Nights
2 listings
10% of total
Key Insights
- The most prevalent minimum stay requirement in Banning is 1 Night, adopted by 55% of listings. This highlights the market's preference for shorter, flexible bookings.
- A strong majority (80.0%) of the Banning Airbnb data shows acceptance of very short stays (1-2 nights), indicating a dynamic, high-turnover market.
Recommendations
- Align with the market by considering a 1 Night minimum stay, as 55% of Banning hosts use this setting.
- Explore offering discounts for stays of 30+ nights to attract the 10% of the market seeking extended stays.
- Adjust minimum nights based on seasonality – potentially shorter during low season and longer during peak demand periods in Banning.
Banning Airbnb Cancellation Policy Trends Analysis (2025)
Flexible
3 listings
15% of total
Moderate
9 listings
45% of total
Firm
7 listings
35% of total
Strict
1 listings
5% of total
Cancellation Policy Insights for Banning
- The prevailing Airbnb cancellation policy trend in Banning is Moderate, used by 45% of listings.
- There's a relatively balanced mix between guest-friendly (60.0%) and stricter (40.0%) policies, offering choices for different guest needs.
- Strict cancellation policies are quite rare (5%), potentially making listings with this policy less competitive unless justified by high demand or property type.
Recommendations for Hosts
- Consider adopting a Moderate policy to align with the 45% market standard in Banning.
- Using a Strict policy might deter some guests, as only 5% of listings use it. Evaluate if potential revenue protection outweighs possible lower booking rates.
- Regularly review your cancellation policy against competitors and market demand shifts in Banning.
Banning STR Booking Lead Time Analysis (2025)
Average Booking Lead Time by Month
Booking Lead Time Insights for Banning
- The overall average booking lead time for vacation rentals in Banning is 33 days.
- Guests book furthest in advance for stays during April (average 82 days), likely coinciding with peak travel demand or local events.
- The shortest booking windows occur for stays in January (average 14 days), indicating more last-minute travel plans during this time.
- Seasonally, Spring (50 days avg.) sees the longest lead times, while Winter (23 days avg.) has the shortest, reflecting typical travel planning cycles.
Recommendations for Hosts
- Use the overall average lead time (33 days) as a baseline for your pricing and availability strategy in Banning.
- For April stays, consider implementing length-of-stay discounts or slightly higher rates for bookings made less than 82 days out to capitalize on advance planning.
- During January, focus on last-minute booking availability and promotions, as guests book with very short notice (14 days avg.).
- Target marketing efforts for the Spring season well in advance (at least 50 days) to capture early planners.
- Monitor your own booking lead times against these Banning averages to identify opportunities for dynamic pricing adjustments.
Popular & Essential Airbnb Amenities in Banning (2025)
Amenity Prevalence
Amenity Insights for Banning
- Essential amenities in Banning that guests expect include: Air conditioning, Wifi, TV, Free parking on premises. Lacking these (any) could significantly impact bookings.
- Popular amenities like Smoke alarm, Kitchen, Hot water are common but not universal. Offering these can provide a competitive edge.
Recommendations for Hosts
- Ensure your listing includes all essential amenities for Banning: Air conditioning, Wifi, TV, Free parking on premises.
- Prioritize adding missing essentials: TV, Free parking on premises.
- Consider adding popular differentiators like Smoke alarm or Kitchen to increase appeal.
- Highlight unique or less common amenities you offer (e.g., hot tub, dedicated workspace, EV charger) in your listing description and photos.
- Regularly check competitor amenities in Banning to stay competitive.
Banning Airbnb Guest Demographics & Profile Analysis (2025)
Guest Profile Summary for Banning
- The typical guest profile for Airbnb in Banning consists of primarily domestic travelers (90%), often arriving from nearby Los Angeles, typically belonging to the Post-2000s (Gen Z/Alpha) group (50%), primarily speaking English or Spanish.
- Domestic travelers account for 89.8% of guests.
- Key international markets include United States (89.8%) and Mexico (2.4%).
- Top languages spoken are English (66.4%) followed by Spanish (20.9%).
- A significant demographic segment is the Post-2000s (Gen Z/Alpha) group, representing 50% of guests.
Recommendations for Hosts
- Target domestic marketing efforts towards travelers from Los Angeles and San Diego.
- Tailor amenities and listing descriptions to appeal to the dominant Post-2000s (Gen Z/Alpha) demographic (e.g., highlight fast WiFi, smart home features, local guides).
- Highlight unique local experiences or amenities relevant to the primary guest profile.
- Consider seasonal promotions aligned with peak travel times for key origin markets.
Nearby Short-Term Rental Market Comparison
How does the Banning Airbnb market stack up against its neighbors? Compare key performance metrics like average monthly revenue, ADR, and occupancy rates in surrounding areas to understand the broader regional STR landscape.
| Market | Active Properties | Monthly Revenue | Daily Rate | Avg. Occupancy |
|---|---|---|---|---|
| Rancho San Diego | 26 | $9,412 | $606.80 | 50% |
| Thousand Palms | 32 | $9,261 | $807.36 | 39% |
| Newport Beach | 1,204 | $9,007 | $746.06 | 46% |
| GlenOak Hills | 40 | $7,676 | $677.36 | 40% |
| Bermuda Dunes | 138 | $7,652 | $675.77 | 40% |
| Del Mar | 113 | $7,530 | $642.40 | 46% |
| Lakeside | 33 | $7,280 | $617.49 | 41% |
| Mount Helix | 35 | $7,053 | $596.55 | 50% |
| Santa Margarita Ranchos | 18 | $6,329 | $523.88 | 36% |
| Encinitas | 557 | $6,175 | $558.86 | 50% |