Bear Valley Airbnb Market Analysis 2026: Short Term Rental Data & Vacation Rental Statistics in California, United States
Is Airbnb profitable in Bear Valley in 2026? Explore comprehensive Airbnb analytics for Bear Valley, California, United States to uncover income potential. This 2026 STR market report for Bear Valley, based on AirROI data from February 2025 to January 2026, reveals key trends in the niche market of 48 active listings.
Whether you're considering an Airbnb investment in Bear Valley, optimizing your existing vacation rental, or exploring rental arbitrage opportunities, understanding the Bear Valley Airbnb data is crucial. Leveraging the low regulation environment is key to maximizing your short term rental income potential. Let's dive into the specifics.
Key Bear Valley Airbnb Performance Metrics Overview
Monthly Airbnb Revenue Variations & Income Potential in Bear Valley (2026)
Understanding the monthly revenue variations for Airbnb listings in Bear Valley is key to maximizing your short term rental income potential. Seasonality significantly impacts earnings. Our analysis, based on data from the past 12 months, shows that the peak revenue month for STRs in Bear Valley is typically February, while November often presents the lowest earnings, highlighting opportunities for strategic pricing adjustments during shoulder and low seasons. Explore the typical Airbnb income in Bear Valley across different performance tiers:
- Best-in-class properties (Top 10%) achieve $6,187+ monthly, often utilizing dynamic pricing and superior guest experiences.
- Strong performing properties (Top 25%) earn $4,117 or more, indicating effective management and desirable locations/amenities.
- Typical properties (Median) generate around $2,600 per month, representing the average market performance.
- Entry-level properties (Bottom 25%) see earnings around $1,585, often with potential for optimization.
Average Monthly Airbnb Earnings Trend in Bear Valley
Bear Valley Airbnb Occupancy Rate Trends (2026)
Maximize your bookings by understanding the Bear Valley STR occupancy trends. Seasonal demand shifts significantly influence how often properties are booked. Typically, Februarysees the highest demand (peak season occupancy), while September experiences the lowest (low season). Effective strategies, like adjusting minimum stays or offering promotions, can boost occupancy during slower periods. Here's how different property tiers perform in Bear Valley:
- Best-in-class properties (Top 10%) achieve 52%+ occupancy, indicating high desirability and potentially optimized availability.
- Strong performing properties (Top 25%) maintain 37% or higher occupancy, suggesting good market fit and guest satisfaction.
- Typical properties (Median) have an occupancy rate around 24%.
- Entry-level properties (Bottom 25%) average 14% occupancy, potentially facing higher vacancy.
Average Monthly Occupancy Rate Trend in Bear Valley
Average Daily Rate (ADR) Airbnb Trends in Bear Valley (2026)
Effective short term rental pricing strategy in Bear Valley involves understanding monthly ADR fluctuations. The Average Daily Rate (ADR) for Airbnb in Bear Valley typically peaks in January and dips lowest during February. Leveraging Airbnb dynamic pricing tools or strategies based on this seasonality can significantly boost revenue. Here's a look at the typical nightly rates achieved:
- Best-in-class properties (Top 10%) command rates of $644+ per night, often due to premium features or locations.
- Strong performing properties (Top 25%) achieve nightly rates of $469 or more.
- Typical properties (Median) charge around $354 per night.
- Entry-level properties (Bottom 25%) earn around $281 per night.
Average Daily Rate (ADR) Trend by Month in Bear Valley
Get Live Bear Valley Market Intelligence 👇

Explore Real-time Analytics
Airbnb Seasonality Analysis & Trends in Bear Valley (2026)
Peak Season (February, July, December)
- Revenue averages $4,721 per month
- Occupancy rates average 38.5%
- Daily rates average $405
Shoulder Season
- Revenue averages $3,123 per month
- Occupancy maintains around 27.1%
- Daily rates hold near $403
Low Season (September, October, November)
- Revenue drops to average $1,925 per month
- Occupancy decreases to average 18.2%
- Daily rates adjust to average $394
Seasonality Insights for Bear Valley
- The Airbnb seasonality in Bear Valley shows highly seasonal trends requiring careful strategy. While the sections above show seasonal averages, it's also insightful to look at the extremes:
- During the high season, the absolute peak month showcases Bear Valley's highest earning potential, with monthly revenues capable of climbing to $4,841, occupancy reaching a high of 49.8%, and ADRs peaking at $471.
- Conversely, the slowest single month of the year, typically falling within the low season, marks the market's lowest point. In this month, revenue might dip to $1,808, occupancy could drop to 17.5%, and ADRs may adjust down to $367.
- Understanding both the seasonal averages and these monthly peaks and troughs in revenue, occupancy, and ADR is crucial for maximizing your Airbnb profit potential in Bear Valley.
Seasonal Strategies for Maximizing Profit
- Peak Season: Maximize revenue through premium pricing and potentially longer minimum stays. Ensure high availability.
- Low Season: Offer competitive pricing, special promotions (e.g., extended stay discounts), and flexible cancellation policies. Target off-season travelers like remote workers or budget-conscious guests.
- Shoulder Seasons: Implement dynamic pricing that balances peak and low rates. Target weekend travelers or specific events. Offer slightly more flexible terms than peak season.
- Regularly analyze your own performance against these Bear Valley seasonality benchmarks and adjust your pricing and availability strategy accordingly.
Best Areas for Airbnb Investment in Bear Valley (2026)
Exploring the top neighborhoods for short-term rentals in Bear Valley? This section highlights key areas, outlining why they are attractive for hosts and guests, along with notable local attractions. Consider these locations based on your target guest profile and investment strategy.
| Neighborhood / Area | Why Host Here? (Target Guests & Appeal) | Key Attractions & Landmarks |
|---|---|---|
| Bear Valley Village | The central hub of Bear Valley, offering charming lodgings and key amenities. A popular spot year-round for skiing in winter and hiking in summer, making it attractive for vacation travelers. | Bear Valley Ski Resort, Bear Valley Lake, Big Trees State Park, Eagle Lakes, Camps at Lake Alpine, Summit Creek |
| Lake Alpine | A beautiful alpine lake surrounded by scenic mountains, ideal for outdoor enthusiasts. Perfect for visitors looking to relax by the water or engage in activities like kayaking and fishing. | Lake Alpine, Alpine Meadows, Hiking Trails, Fishing Spots, Picnic Areas, Camping Sites |
| Silver Creek | Known for its stunning landscapes and proximity to outdoor activities, this area is ideal for those looking to connect with nature. It's perfect for vacation homes and retreats. | Silver Creek Falls, Hiking Trails, Wildlife Watching, Nature Photography Spots, Snowshoeing in winter, Biking Trails |
| Mount Reba | A prime location for avid hikers and mountain enthusiasts, known for its incredible views and trails. Ideal for those who want to explore the great outdoors. | Mount Reba Trail, Panther Gap, Scenic Overlooks, Wildflower Viewing, Mountain Climbing, Star Gazing |
| Bear Valley Ski Resort Area | A top destination for skiing and winter sports, attracting a large number of tourists seeking adventure. Excellent for winter rentals and lodges. | Ski Slopes, Ski Rentals, Snowboarding Lessons, Snowshoeing Trails, Winter Festivals, Ski Competitions |
| Alpine Meads | Serene rural area with stunning views, perfect for relaxation and quiet getaways. A great choice for those looking to escape the city hustle. | Rural Countryside, Nature Trails, Wildflower Fields, Starry Nights, Local Farms, Historic Sites |
| Chainsaw Ridge | A unique spot for thrill-seekers and outdoor adventurers, popular for mountain biking and hiking enthusiasts. Great for active vacationers. | Biking Trails, Hiking Paths, Scenic Views, Adventure Challenges, Wildlife Trails, Photography Opportunities |
| Spicer Reservoir | A stunning reservoir area that offers boating and fishing opportunities, making it attractive for families and groups looking for a fun day outdoors. | Spicer Reservoir, Boating Activities, Fishing Docks, Picnic Areas, Wildlife Viewing, Scenic Drives |
Understanding Airbnb License Requirements & STR Laws in Bear Valley (2026)
While Bear Valley, California, United States currently shows low STR regulations, specific Airbnb license requirements might still exist or change. Always verify the latest short term rental regulations and Airbnb license requirements directly with local government authorities for Bear Valley to ensure full compliance before hosting.
(Source: AirROI data, 2026, finding no licensed listings among those analyzed)
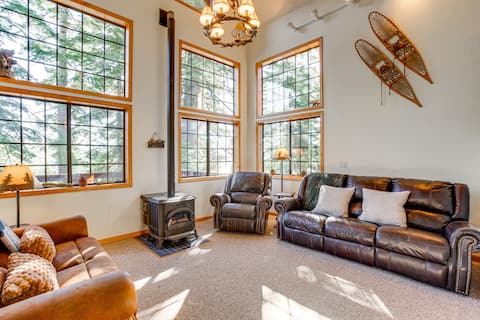
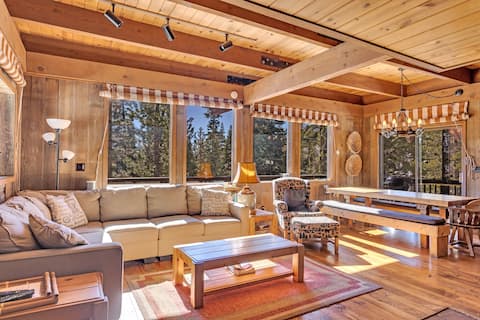
Top Performing Airbnb Properties in Bear Valley (2026)
Benchmark your potential! Explore examples of top-performing Airbnb properties in Bear Valleybased on Trailing Twelve Month (TTM) revenue. Analyze their characteristics, revenue, occupancy rate, and ADR to understand what drives success in this market.

Awesome House Above the Lake/pets Welcome
Entire Place • 3 bedrooms
Deck w/ Mountain Views: Cabin in Bear Valley!
Entire Place • 3 bedrooms
Bear Valley Cabin Close to Village
Entire Place • 3 bedrooms
Overlooking Beautiful Bear Lake Vh#318
Entire Place • 6 bedrooms

Vacation Home 216
Entire Place • 3 bedrooms

Sunny, Spacious & Pet Friendly - Creekside #39
Entire Place • 2 bedrooms
Note: Performance varies based on location, size, amenities, seasonality, and management quality. Data reflects the past 12 months.
Top Performing Airbnb Hosts in Bear Valley (2026)
Learn from the best! This table showcases top-performing Airbnb hosts in Bear Valley based on the number of properties managed and estimated total revenue over the past year. Analyze their scale and performance metrics.
| Host Name | Properties | Grossing Revenue | Stay Reviews | Avg Rating |
|---|---|---|---|---|
| Bear Valley Vacation Rentals | 23 | $583,203 | 193 | 4.34/5.0 |
| Evolve | 2 | $71,009 | 43 | 4.60/5.0 |
| Katia | 1 | $52,461 | 49 | 4.98/5.0 |
| Molly | 1 | $48,752 | 23 | 4.74/5.0 |
| Jess | 1 | $34,083 | 22 | 4.91/5.0 |
| Heather | 1 | $34,047 | 18 | 4.94/5.0 |
| Elevated Property Care | 1 | $33,429 | 16 | 4.94/5.0 |
| Jim | 1 | $32,529 | 142 | 4.78/5.0 |
| Dane | 1 | $32,305 | 159 | 4.94/5.0 |
| Kayla | 1 | $31,956 | 95 | 4.77/5.0 |
Analyzing the strategies of top hosts, such as their property selection, pricing, and guest communication, can offer valuable lessons for optimizing your own Airbnb operations in Bear Valley.
Dive Deeper: Advanced Bear Valley STR Market Data (2026)
Ready to unlock more insights? AirROI provides access to advanced metrics and comprehensive Airbnb data for Bear Valley. Explore detailed analytics beyond this report to refine your investment strategy, optimize pricing, and maximize your vacation rental profits.
Explore Advanced MetricsBear Valley Short-Term Rental Market Composition (2026): Property & Room Types
Room Type Distribution
Property Type Distribution
Market Composition Insights for Bear Valley
- The Bear Valley Airbnb market composition is heavily skewed towards Entire Home/Apt listings, which make up 100% of the 48 active rentals. This indicates strong guest preference for privacy and space.
- Looking at the property type distribution in Bear Valley, Apartment/Condo properties are the most common (54.2%), reflecting the local real estate landscape.
- Houses represent a significant 25% portion, catering likely to families or larger groups.
Bear Valley Airbnb Room Capacity Analysis (2026): Bedroom Distribution
Distribution of Listings by Number of Bedrooms
Room Capacity Insights for Bear Valley
- The dominant room capacity in Bear Valley is 3 bedrooms listings, making up 33.3% of the market. This suggests a strong demand for properties suitable for families or small groups.
- Together, 3 bedrooms and 2 bedrooms properties represent 62.5% of the active Airbnb listings in Bear Valley, indicating a high concentration in these sizes.
- A significant 43.8% of listings offer 3+ bedrooms, catering to larger groups and families seeking more space in Bear Valley.
Bear Valley Vacation Rental Guest Capacity Trends (2026)
Distribution of Listings by Guest Capacity
Guest Capacity Insights for Bear Valley
- The most common guest capacity trend in Bear Valley vacation rentals is listings accommodating 8+ guests (52.1%). This suggests the primary traveler segment is likely larger groups.
- Properties designed for 8+ guests and 4 guests dominate the Bear Valley STR market, accounting for 75.0% of listings.
- 70.8% of properties accommodate 6+ guests, serving the market segment for larger families or group travel in Bear Valley.
- On average, properties in Bear Valley are equipped to host 6.6 guests.
Bear Valley Airbnb Booking Patterns (2026): Available vs. Booked Days
Available Days Distribution
Booked Days Distribution
Booking Pattern Insights for Bear Valley
- The most common availability pattern in Bear Valley falls within the 271-366 days range, representing 79.2% of listings. This suggests many properties have significant open periods on their calendars.
- Approximately 100.0% of listings show high availability (181+ days open annually), indicating potential for increased bookings or specific owner usage patterns.
- For booked days, the 31-90 days range is most frequent in Bear Valley (54.2%), reflecting common guest stay durations or potential owner blocking patterns.
Bear Valley Airbnb Minimum Stay Requirements Analysis
Distribution of Listings by Minimum Night Requirement
1 Night
2 listings
4.2% of total
2 Nights
16 listings
33.3% of total
3 Nights
1 listings
2.1% of total
30+ Nights
29 listings
60.4% of total
Key Insights
- The most prevalent minimum stay requirement in Bear Valley is 30+ Nights, adopted by 60.4% of listings. This highlights the market's preference for longer commitments.
- A significant segment (60.4%) caters to monthly stays (30+ nights) in Bear Valley, pointing to opportunities in the extended-stay market.
Recommendations
- Align with the market by considering a 30+ Nights minimum stay, as 60.4% of Bear Valley hosts use this setting.
- If feasible, allowing 1-night stays, especially midweek or during low season, could capture last-minute bookings, as only 4.2% currently do.
- A 2-night minimum appears standard (33.3%). Consider this for weekends or peak periods.
- Explore offering discounts for stays of 30+ nights to attract the 60.4% of the market seeking extended stays.
- Adjust minimum nights based on seasonality – potentially shorter during low season and longer during peak demand periods in Bear Valley.
Bear Valley Airbnb Cancellation Policy Trends Analysis (2026)
Limited
2 listings
4.2% of total
Flexible
1 listings
2.1% of total
Moderate
7 listings
14.6% of total
Firm
32 listings
66.7% of total
Strict
6 listings
12.5% of total
Cancellation Policy Insights for Bear Valley
- The prevailing Airbnb cancellation policy trend in Bear Valley is Firm, used by 66.7% of listings.
- A majority (79.2%) of hosts in Bear Valley utilize Firm or Strict policies, indicating a market where hosts prioritize booking security.
Recommendations for Hosts
- Consider adopting a Firm policy to align with the 66.7% market standard in Bear Valley.
- Using a Strict policy might deter some guests, as only 12.5% of listings use it. Evaluate if potential revenue protection outweighs possible lower booking rates.
- Regularly review your cancellation policy against competitors and market demand shifts in Bear Valley.
Bear Valley STR Booking Lead Time Analysis (2026)
Average Booking Lead Time by Month
Booking Lead Time Insights for Bear Valley
- The overall average booking lead time for vacation rentals in Bear Valley is 53 days.
- Guests book furthest in advance for stays during December (average 81 days), likely coinciding with peak travel demand or local events.
- The shortest booking windows occur for stays in September (average 17 days), indicating more last-minute travel plans during this time.
- Seasonally, Winter (73 days avg.) sees the longest lead times, while Fall (38 days avg.) has the shortest, reflecting typical travel planning cycles.
Recommendations for Hosts
- Use the overall average lead time (53 days) as a baseline for your pricing and availability strategy in Bear Valley.
- For December stays, consider implementing length-of-stay discounts or slightly higher rates for bookings made less than 81 days out to capitalize on advance planning.
- Target marketing efforts for the Winter season well in advance (at least 73 days) to capture early planners.
- Monitor your own booking lead times against these Bear Valley averages to identify opportunities for dynamic pricing adjustments.
Popular & Essential Airbnb Amenities in Bear Valley (2026)
Amenity Prevalence
Amenity Insights for Bear Valley
- Essential amenities in Bear Valley that guests expect include: TV, Smoke alarm, Wifi, Carbon monoxide alarm, Free parking on premises, Kitchen, Coffee maker, Heating. Lacking these (any) could significantly impact bookings.
- Popular amenities like Microwave, Dishes and silverware are common but not universal. Offering these can provide a competitive edge.
Recommendations for Hosts
- Ensure your listing includes all essential amenities for Bear Valley: TV, Smoke alarm, Wifi, Carbon monoxide alarm, Free parking on premises, Kitchen, Coffee maker, Heating.
- Prioritize adding missing essentials: Carbon monoxide alarm, Free parking on premises, Kitchen, Coffee maker, Heating.
- Consider adding popular differentiators like Microwave or Dishes and silverware to increase appeal.
- Highlight unique or less common amenities you offer (e.g., hot tub, dedicated workspace, EV charger) in your listing description and photos.
- Regularly check competitor amenities in Bear Valley to stay competitive.
Bear Valley Airbnb Guest Demographics & Profile Analysis (2026)
Guest Profile Summary for Bear Valley
- The typical guest profile for Airbnb in Bear Valley consists of primarily domestic travelers (98%), often arriving from nearby San Francisco, typically belonging to the Post-2000s (Gen Z/Alpha) group (50%), primarily speaking English or Spanish.
- Domestic travelers account for 97.8% of guests.
- Key international markets include United States (97.8%) and France (0.7%).
- Top languages spoken are English (54.1%) followed by Spanish (10.8%).
- A significant demographic segment is the Post-2000s (Gen Z/Alpha) group, representing 50% of guests.
Recommendations for Hosts
- Target domestic marketing efforts towards travelers from San Francisco and Oakland.
- Tailor amenities and listing descriptions to appeal to the dominant Post-2000s (Gen Z/Alpha) demographic (e.g., highlight fast WiFi, smart home features, local guides).
- Highlight unique local experiences or amenities relevant to the primary guest profile.
- Consider seasonal promotions aligned with peak travel times for key origin markets.
Nearby Short-Term Rental Market Comparison
How does the Bear Valley Airbnb market stack up against its neighbors? Compare key performance metrics like average monthly revenue, ADR, and occupancy rates in surrounding areas to understand the broader regional STR landscape.
| Market | Active Properties | Monthly Revenue | Daily Rate | Avg. Occupancy |
|---|---|---|---|---|
| Wawona | 66 | $7,186 | $548.44 | 45% |
| Yosemite National Park | 227 | $6,835 | $511.03 | 44% |
| Zephyr Cove | 192 | $6,404 | $642.42 | 37% |
| Homewood | 150 | $5,842 | $595.57 | 40% |
| Meyers | 177 | $5,840 | $500.97 | 43% |
| Glenbrook | 32 | $5,788 | $841.74 | 35% |
| Yosemite West | 29 | $5,597 | $423.79 | 49% |
| Carnelian Bay | 349 | $5,362 | $561.69 | 39% |
| Incline Village-Crystal Bay | 204 | $5,197 | $589.54 | 35% |
| Tahoma | 199 | $5,011 | $605.47 | 36% |