Bermuda Dunes Airbnb Market Analysis 2026: Short Term Rental Data & Vacation Rental Statistics in California, United States
Is Airbnb profitable in Bermuda Dunes in 2026? Explore comprehensive Airbnb analytics for Bermuda Dunes, California, United States to uncover income potential. This 2026 STR market report for Bermuda Dunes, based on AirROI data from February 2025 to January 2026, reveals key trends in the niche market of 143 active listings.
Whether you're considering an Airbnb investment in Bermuda Dunes, optimizing your existing vacation rental, or exploring rental arbitrage opportunities, understanding the Bermuda Dunes Airbnb data is crucial. Leveraging the low regulation environment is key to maximizing your short term rental income potential. Let's dive into the specifics.
Key Bermuda Dunes Airbnb Performance Metrics Overview
Monthly Airbnb Revenue Variations & Income Potential in Bermuda Dunes (2026)
Understanding the monthly revenue variations for Airbnb listings in Bermuda Dunes is key to maximizing your short term rental income potential. Seasonality significantly impacts earnings. Our analysis, based on data from the past 12 months, shows that the peak revenue month for STRs in Bermuda Dunes is typically March, while September often presents the lowest earnings, highlighting opportunities for strategic pricing adjustments during shoulder and low seasons. Explore the typical Airbnb income in Bermuda Dunes across different performance tiers:
- Best-in-class properties (Top 10%) achieve $24,854+ monthly, often utilizing dynamic pricing and superior guest experiences.
- Strong performing properties (Top 25%) earn $10,949 or more, indicating effective management and desirable locations/amenities.
- Typical properties (Median) generate around $6,225 per month, representing the average market performance.
- Entry-level properties (Bottom 25%) see earnings around $2,880, often with potential for optimization.
Average Monthly Airbnb Earnings Trend in Bermuda Dunes
Bermuda Dunes Airbnb Occupancy Rate Trends (2026)
Maximize your bookings by understanding the Bermuda Dunes STR occupancy trends. Seasonal demand shifts significantly influence how often properties are booked. Typically, Marchsees the highest demand (peak season occupancy), while September experiences the lowest (low season). Effective strategies, like adjusting minimum stays or offering promotions, can boost occupancy during slower periods. Here's how different property tiers perform in Bermuda Dunes:
- Best-in-class properties (Top 10%) achieve 75%+ occupancy, indicating high desirability and potentially optimized availability.
- Strong performing properties (Top 25%) maintain 58% or higher occupancy, suggesting good market fit and guest satisfaction.
- Typical properties (Median) have an occupancy rate around 39%.
- Entry-level properties (Bottom 25%) average 21% occupancy, potentially facing higher vacancy.
Average Monthly Occupancy Rate Trend in Bermuda Dunes
Average Daily Rate (ADR) Airbnb Trends in Bermuda Dunes (2026)
Effective short term rental pricing strategy in Bermuda Dunes involves understanding monthly ADR fluctuations. The Average Daily Rate (ADR) for Airbnb in Bermuda Dunes typically peaks in April and dips lowest during September. Leveraging Airbnb dynamic pricing tools or strategies based on this seasonality can significantly boost revenue. Here's a look at the typical nightly rates achieved:
- Best-in-class properties (Top 10%) command rates of $1,537+ per night, often due to premium features or locations.
- Strong performing properties (Top 25%) achieve nightly rates of $673 or more.
- Typical properties (Median) charge around $459 per night.
- Entry-level properties (Bottom 25%) earn around $285 per night.
Average Daily Rate (ADR) Trend by Month in Bermuda Dunes
Get Live Bermuda Dunes Market Intelligence 👇

Explore Real-time Analytics
Airbnb Seasonality Analysis & Trends in Bermuda Dunes (2026)
Peak Season (March, April, February)
- Revenue averages $13,537 per month
- Occupancy rates average 53.5%
- Daily rates average $777
Shoulder Season
- Revenue averages $9,276 per month
- Occupancy maintains around 38.0%
- Daily rates hold near $655
Low Season (August, September, October)
- Revenue drops to average $7,612 per month
- Occupancy decreases to average 34.3%
- Daily rates adjust to average $580
Seasonality Insights for Bermuda Dunes
- The Airbnb seasonality in Bermuda Dunes shows highly seasonal trends requiring careful strategy. While the sections above show seasonal averages, it's also insightful to look at the extremes:
- During the high season, the absolute peak month showcases Bermuda Dunes's highest earning potential, with monthly revenues capable of climbing to $15,008, occupancy reaching a high of 58.6%, and ADRs peaking at $899.
- Conversely, the slowest single month of the year, typically falling within the low season, marks the market's lowest point. In this month, revenue might dip to $7,237, occupancy could drop to 29.6%, and ADRs may adjust down to $559.
- Understanding both the seasonal averages and these monthly peaks and troughs in revenue, occupancy, and ADR is crucial for maximizing your Airbnb profit potential in Bermuda Dunes.
Seasonal Strategies for Maximizing Profit
- Peak Season: Maximize revenue through premium pricing and potentially longer minimum stays. Ensure high availability.
- Low Season: Offer competitive pricing, special promotions (e.g., extended stay discounts), and flexible cancellation policies. Target off-season travelers like remote workers or budget-conscious guests.
- Shoulder Seasons: Implement dynamic pricing that balances peak and low rates. Target weekend travelers or specific events. Offer slightly more flexible terms than peak season.
- Regularly analyze your own performance against these Bermuda Dunes seasonality benchmarks and adjust your pricing and availability strategy accordingly.
Best Areas for Airbnb Investment in Bermuda Dunes (2026)
Exploring the top neighborhoods for short-term rentals in Bermuda Dunes? This section highlights key areas, outlining why they are attractive for hosts and guests, along with notable local attractions. Consider these locations based on your target guest profile and investment strategy.
| Neighborhood / Area | Why Host Here? (Target Guests & Appeal) | Key Attractions & Landmarks |
|---|---|---|
| Bermuda Dunes Country Club | A serene and upscale golf community that attracts golf lovers and vacationers seeking relaxation. Close proximity to major golf courses and luxury amenities makes it a prime location for Airbnb hosts. | Bermuda Dunes Country Club, Palm Desert Country Club, golf courses, peaceful living |
| Palm Desert | Located near Bermuda Dunes, Palm Desert offers shopping, dining, and cultural attractions. It draws tourists looking for desert experiences and luxurious accommodations. | El Paseo Shopping District, Living Desert Zoo and Gardens, Palm Desert Aquatic Center, Parker Palm Springs |
| La Quinta | Famous for its beautiful resorts and annual golf tournaments, La Quinta is a desirable location for visitors seeking leisure and outdoor activities, providing ideal Airbnb opportunities. | La Quinta Resort & Club, Old Town La Quinta, golf courses, Coachella Valley Arts Festival |
| Indio | Known for its festivals like Coachella and Stagecoach, Indio attracts a large number of visitors throughout the year. Strong demand for short-term rentals during events makes it an excellent investment area. | Coachella Valley Music and Arts Festival, Indian Wells Tennis Garden, Indio Grand Marketplace, Empire Polo Club |
| Rancho Mirage | An affluent community with high-end resorts and golf courses. Attracts visitors seeking luxury experiences and relaxation in the beautiful desert landscapes. | The River at Rancho Mirage, Rancho Mirage Library, Mission Hills Country Club, Aqua Caliente Casino |
| Indian Wells | Known for its beautiful resorts and spas, as well as the Indian Wells Tennis Garden. Attracts both leisure travelers and tennis enthusiasts. | Indian Wells Tennis Garden, Indian Wells Golf Resort, Eisenhower Mountain, La Quinta Cove |
| Coachella | Rich in cultural festivals and events, Coachella is popular among young tourists for its vibrant nightlife and music scene, especially during festival seasons. | Coachella Music Festival, The Salton Sea, Coachella Valley History Museum, local food and music events |
| Cathedral City | Located near Palm Springs, Cathedral City offers affordable lodging options and a diverse range of attractions, making it appealing for budget-conscious travelers. | Cathedral Canyon Country Club, Desert Cinemas Cathedral City, CV Skatepark, The LGBT Community Center |
Understanding Airbnb License Requirements & STR Laws in Bermuda Dunes (2026)
While Bermuda Dunes, California, United States currently shows low STR regulations, specific Airbnb license requirements might still exist or change. Always verify the latest short term rental regulations and Airbnb license requirements directly with local government authorities for Bermuda Dunes to ensure full compliance before hosting.
(Source: AirROI data, 2026, based on 1% licensed listings)
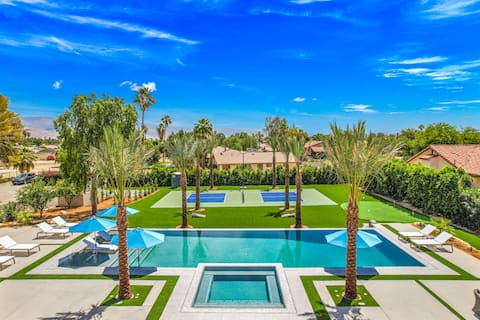
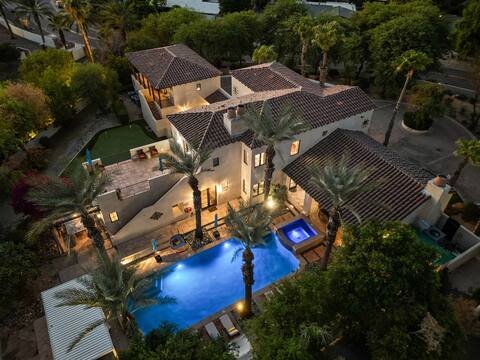
Top Performing Airbnb Properties in Bermuda Dunes (2026)
Benchmark your potential! Explore examples of top-performing Airbnb properties in Bermuda Dunesbased on Trailing Twelve Month (TTM) revenue. Analyze their characteristics, revenue, occupancy rate, and ADR to understand what drives success in this market.

Lazy River Oasis, Pickleball and more
Entire Place • 10 bedrooms

Palm Villa Luxury- 8BD, Pickleball,Volleyball,Golf
Entire Place • 8 bedrooms
Cinema + Golf S'm + P P'g + Volley + Basket + Pickle + G'room
Entire Place • 5 bedrooms

Riviera – Lazy River Pool, Pickleball, Game Room!
Entire Place • 8 bedrooms

Luxury Estate 9 Bedroom /9 Ensuite Bathroom
Entire Place • 9 bedrooms
Luxe 7BDR Oasis w/ Putting Green | Villa Del Gallo
Entire Place • 7 bedrooms
Note: Performance varies based on location, size, amenities, seasonality, and management quality. Data reflects the past 12 months.
Top Performing Airbnb Hosts in Bermuda Dunes (2026)
Learn from the best! This table showcases top-performing Airbnb hosts in Bermuda Dunes based on the number of properties managed and estimated total revenue over the past year. Analyze their scale and performance metrics.
| Host Name | Properties | Grossing Revenue | Stay Reviews | Avg Rating |
|---|---|---|---|---|
| Anna | 7 | $1,518,637 | 839 | 4.91/5.0 |
| Drew | 2 | $1,410,237 | 62 | 5.00/5.0 |
| AvantStay Palm Springs | 6 | $1,278,556 | 176 | 4.86/5.0 |
| Steve | 2 | $605,521 | 330 | 4.99/5.0 |
| Jen | 1 | $475,100 | 21 | 4.95/5.0 |
| Ruchi | 2 | $443,549 | 168 | 4.84/5.0 |
| Tommy- House Of Lux Management | 2 | $357,666 | 16 | 4.95/5.0 |
| Vacanza Stays By Alicia | 3 | $345,308 | 116 | 4.92/5.0 |
| Dimitry | 1 | $337,884 | 63 | 5.00/5.0 |
| Everyday Luxury Inc. | 2 | $306,768 | 163 | 4.76/5.0 |
Analyzing the strategies of top hosts, such as their property selection, pricing, and guest communication, can offer valuable lessons for optimizing your own Airbnb operations in Bermuda Dunes.
Dive Deeper: Advanced Bermuda Dunes STR Market Data (2026)
Ready to unlock more insights? AirROI provides access to advanced metrics and comprehensive Airbnb data for Bermuda Dunes. Explore detailed analytics beyond this report to refine your investment strategy, optimize pricing, and maximize your vacation rental profits.
Explore Advanced MetricsBermuda Dunes Short-Term Rental Market Composition (2026): Property & Room Types
Room Type Distribution
Property Type Distribution
Market Composition Insights for Bermuda Dunes
- The Bermuda Dunes Airbnb market composition is heavily skewed towards Entire Home/Apt listings, which make up 88.1% of the 143 active rentals. This indicates strong guest preference for privacy and space.
- Looking at the property type distribution in Bermuda Dunes, House properties are the most common (92.3%), reflecting the local real estate landscape.
- Houses represent a significant 92.3% portion, catering likely to families or larger groups.
- Smaller segments like hotel/boutique, others, unique stays, apartment/condo (combined 7.7%) offer potential for unique stay experiences.
Bermuda Dunes Airbnb Room Capacity Analysis (2026): Bedroom Distribution
Distribution of Listings by Number of Bedrooms
Room Capacity Insights for Bermuda Dunes
- The dominant room capacity in Bermuda Dunes is 3 bedrooms listings, making up 30.8% of the market. This suggests a strong demand for properties suitable for families or small groups.
- Together, 3 bedrooms and 4 bedrooms properties represent 57.4% of the active Airbnb listings in Bermuda Dunes, indicating a high concentration in these sizes.
- A significant 79.8% of listings offer 3+ bedrooms, catering to larger groups and families seeking more space in Bermuda Dunes.
Bermuda Dunes Vacation Rental Guest Capacity Trends (2026)
Distribution of Listings by Guest Capacity
Guest Capacity Insights for Bermuda Dunes
- The most common guest capacity trend in Bermuda Dunes vacation rentals is listings accommodating 8+ guests (74.1%). This suggests the primary traveler segment is likely larger groups.
- Properties designed for 8+ guests and 6 guests dominate the Bermuda Dunes STR market, accounting for 81.1% of listings.
- 81.8% of properties accommodate 6+ guests, serving the market segment for larger families or group travel in Bermuda Dunes.
- On average, properties in Bermuda Dunes are equipped to host 6.7 guests.
Bermuda Dunes Airbnb Booking Patterns (2026): Available vs. Booked Days
Available Days Distribution
Booked Days Distribution
Booking Pattern Insights for Bermuda Dunes
- The most common availability pattern in Bermuda Dunes falls within the 271-366 days range, representing 46.9% of listings. This suggests many properties have significant open periods on their calendars.
- Approximately 81.2% of listings show high availability (181+ days open annually), indicating potential for increased bookings or specific owner usage patterns.
- For booked days, the 91-180 days range is most frequent in Bermuda Dunes (32.9%), reflecting common guest stay durations or potential owner blocking patterns.
- A notable 21.7% of properties secure long booking periods (181+ days booked per year), highlighting successful long-term rental strategies or significant owner usage.
Bermuda Dunes Airbnb Minimum Stay Requirements Analysis
Distribution of Listings by Minimum Night Requirement
1 Night
9 listings
6.3% of total
2 Nights
30 listings
21% of total
3 Nights
11 listings
7.7% of total
4-6 Nights
2 listings
1.4% of total
7-29 Nights
11 listings
7.7% of total
30+ Nights
80 listings
55.9% of total
Key Insights
- The most prevalent minimum stay requirement in Bermuda Dunes is 30+ Nights, adopted by 55.9% of listings. This highlights the market's preference for longer commitments.
- A significant segment (55.9%) caters to monthly stays (30+ nights) in Bermuda Dunes, pointing to opportunities in the extended-stay market.
Recommendations
- Align with the market by considering a 30+ Nights minimum stay, as 55.9% of Bermuda Dunes hosts use this setting.
- If feasible, allowing 1-night stays, especially midweek or during low season, could capture last-minute bookings, as only 6.3% currently do.
- Explore offering discounts for stays of 30+ nights to attract the 55.9% of the market seeking extended stays.
- Adjust minimum nights based on seasonality – potentially shorter during low season and longer during peak demand periods in Bermuda Dunes.
Bermuda Dunes Airbnb Cancellation Policy Trends Analysis (2026)
Super Strict 30 Days
13 listings
9.2% of total
Super Strict 60 Days
2 listings
1.4% of total
Limited
4 listings
2.8% of total
Flexible
8 listings
5.6% of total
Moderate
18 listings
12.7% of total
Firm
66 listings
46.5% of total
Strict
31 listings
21.8% of total
Cancellation Policy Insights for Bermuda Dunes
- The prevailing Airbnb cancellation policy trend in Bermuda Dunes is Firm, used by 46.5% of listings.
- A majority (68.3%) of hosts in Bermuda Dunes utilize Firm or Strict policies, indicating a market where hosts prioritize booking security.
Recommendations for Hosts
- Consider adopting a Firm policy to align with the 46.5% market standard in Bermuda Dunes.
- Regularly review your cancellation policy against competitors and market demand shifts in Bermuda Dunes.
Bermuda Dunes STR Booking Lead Time Analysis (2026)
Average Booking Lead Time by Month
Booking Lead Time Insights for Bermuda Dunes
- The overall average booking lead time for vacation rentals in Bermuda Dunes is 59 days.
- Guests book furthest in advance for stays during April (average 98 days), likely coinciding with peak travel demand or local events.
- The shortest booking windows occur for stays in August (average 31 days), indicating more last-minute travel plans during this time.
- Seasonally, Spring (81 days avg.) sees the longest lead times, while Summer (34 days avg.) has the shortest, reflecting typical travel planning cycles.
Recommendations for Hosts
- Use the overall average lead time (59 days) as a baseline for your pricing and availability strategy in Bermuda Dunes.
- For April stays, consider implementing length-of-stay discounts or slightly higher rates for bookings made less than 98 days out to capitalize on advance planning.
- Target marketing efforts for the Spring season well in advance (at least 81 days) to capture early planners.
- Monitor your own booking lead times against these Bermuda Dunes averages to identify opportunities for dynamic pricing adjustments.
Popular & Essential Airbnb Amenities in Bermuda Dunes (2026)
Amenity Prevalence
Amenity Insights for Bermuda Dunes
- Essential amenities in Bermuda Dunes that guests expect include: Air conditioning, Wifi, Smoke alarm, Carbon monoxide alarm, Heating, Free parking on premises, TV, Hot water, Hangers, Essentials. Lacking these (any) could significantly impact bookings.
Recommendations for Hosts
- Ensure your listing includes all essential amenities for Bermuda Dunes: Air conditioning, Wifi, Smoke alarm, Carbon monoxide alarm, Heating, Free parking on premises, TV, Hot water, Hangers, Essentials.
- Prioritize adding missing essentials: Carbon monoxide alarm, Heating, Free parking on premises, TV, Hot water, Hangers, Essentials.
- Highlight unique or less common amenities you offer (e.g., hot tub, dedicated workspace, EV charger) in your listing description and photos.
- Regularly check competitor amenities in Bermuda Dunes to stay competitive.
Bermuda Dunes Airbnb Guest Demographics & Profile Analysis (2026)
Guest Profile Summary for Bermuda Dunes
- The typical guest profile for Airbnb in Bermuda Dunes consists of primarily domestic travelers (94%), often arriving from nearby Los Angeles, typically belonging to the Post-2000s (Gen Z/Alpha) group (50%), primarily speaking English or Spanish.
- Domestic travelers account for 93.7% of guests.
- Key international markets include United States (93.7%) and Canada (4.1%).
- Top languages spoken are English (64%) followed by Spanish (20.1%).
- A significant demographic segment is the Post-2000s (Gen Z/Alpha) group, representing 50% of guests.
Recommendations for Hosts
- Target domestic marketing efforts towards travelers from Los Angeles and San Diego.
- Tailor amenities and listing descriptions to appeal to the dominant Post-2000s (Gen Z/Alpha) demographic (e.g., highlight fast WiFi, smart home features, local guides).
- Highlight unique local experiences or amenities relevant to the primary guest profile.
- Consider seasonal promotions aligned with peak travel times for key origin markets.
Nearby Short-Term Rental Market Comparison
How does the Bermuda Dunes Airbnb market stack up against its neighbors? Compare key performance metrics like average monthly revenue, ADR, and occupancy rates in surrounding areas to understand the broader regional STR landscape.
| Market | Active Properties | Monthly Revenue | Daily Rate | Avg. Occupancy |
|---|---|---|---|---|
| Newport Beach | 1,273 | $8,950 | $744.06 | 47% |
| Rancho San Diego | 25 | $8,649 | $568.72 | 48% |
| Thousand Palms | 33 | $8,119 | $725.48 | 36% |
| Lakeside | 33 | $7,537 | $604.33 | 44% |
| GlenOak Hills | 41 | $7,394 | $648.65 | 41% |
| Mount Helix | 33 | $7,163 | $594.94 | 50% |
| Del Mar | 128 | $7,011 | $671.56 | 45% |
| Rancho Santa Fe | 34 | $6,074 | $913.16 | 35% |
| Encinitas | 559 | $5,940 | $543.93 | 49% |
| Santa Margarita Ranchos | 18 | $5,614 | $506.60 | 36% |