Beverly Hills Airbnb Market Analysis 2026: Short Term Rental Data & Vacation Rental Statistics in California, United States
Is Airbnb profitable in Beverly Hills in 2026? Explore comprehensive Airbnb analytics for Beverly Hills, California, United States to uncover income potential. This 2026 STR market report for Beverly Hills, based on AirROI data from February 2025 to January 2026, reveals key trends in the market of 576 active listings.
Whether you're considering an Airbnb investment in Beverly Hills, optimizing your existing vacation rental, or exploring rental arbitrage opportunities, understanding the Beverly Hills Airbnb data is crucial. Leveraging the low regulation environment is key to maximizing your short term rental income potential. Let's dive into the specifics.
Key Beverly Hills Airbnb Performance Metrics Overview
Monthly Airbnb Revenue Variations & Income Potential in Beverly Hills (2026)
Understanding the monthly revenue variations for Airbnb listings in Beverly Hills is key to maximizing your short term rental income potential. Seasonality significantly impacts earnings. Our analysis, based on data from the past 12 months, shows that the peak revenue month for STRs in Beverly Hills is typically April, while January often presents the lowest earnings, highlighting opportunities for strategic pricing adjustments during shoulder and low seasons. Explore the typical Airbnb income in Beverly Hills across different performance tiers:
- Best-in-class properties (Top 10%) achieve $9,707+ monthly, often utilizing dynamic pricing and superior guest experiences.
- Strong performing properties (Top 25%) earn $6,198 or more, indicating effective management and desirable locations/amenities.
- Typical properties (Median) generate around $3,516 per month, representing the average market performance.
- Entry-level properties (Bottom 25%) see earnings around $1,706, often with potential for optimization.
Average Monthly Airbnb Earnings Trend in Beverly Hills
Beverly Hills Airbnb Occupancy Rate Trends (2026)
Maximize your bookings by understanding the Beverly Hills STR occupancy trends. Seasonal demand shifts significantly influence how often properties are booked. Typically, Julysees the highest demand (peak season occupancy), while January experiences the lowest (low season). Effective strategies, like adjusting minimum stays or offering promotions, can boost occupancy during slower periods. Here's how different property tiers perform in Beverly Hills:
- Best-in-class properties (Top 10%) achieve 86%+ occupancy, indicating high desirability and potentially optimized availability.
- Strong performing properties (Top 25%) maintain 72% or higher occupancy, suggesting good market fit and guest satisfaction.
- Typical properties (Median) have an occupancy rate around 46%.
- Entry-level properties (Bottom 25%) average 22% occupancy, potentially facing higher vacancy.
Average Monthly Occupancy Rate Trend in Beverly Hills
Average Daily Rate (ADR) Airbnb Trends in Beverly Hills (2026)
Effective short term rental pricing strategy in Beverly Hills involves understanding monthly ADR fluctuations. The Average Daily Rate (ADR) for Airbnb in Beverly Hills typically peaks in September and dips lowest during February. Leveraging Airbnb dynamic pricing tools or strategies based on this seasonality can significantly boost revenue. Here's a look at the typical nightly rates achieved:
- Best-in-class properties (Top 10%) command rates of $844+ per night, often due to premium features or locations.
- Strong performing properties (Top 25%) achieve nightly rates of $380 or more.
- Typical properties (Median) charge around $255 per night.
- Entry-level properties (Bottom 25%) earn around $177 per night.
Average Daily Rate (ADR) Trend by Month in Beverly Hills
Get Live Beverly Hills Market Intelligence 👇

Explore Real-time Analytics
Airbnb Seasonality Analysis & Trends in Beverly Hills (2026)
Peak Season (April, July, March)
- Revenue averages $5,531 per month
- Occupancy rates average 50.6%
- Daily rates average $440
Shoulder Season
- Revenue averages $5,180 per month
- Occupancy maintains around 47.9%
- Daily rates hold near $448
Low Season (January, February, May)
- Revenue drops to average $4,285 per month
- Occupancy decreases to average 41.3%
- Daily rates adjust to average $434
Seasonality Insights for Beverly Hills
- The Airbnb seasonality in Beverly Hills shows moderate seasonality with distinct peak and low periods. While the sections above show seasonal averages, it's also insightful to look at the extremes:
- During the high season, the absolute peak month showcases Beverly Hills's highest earning potential, with monthly revenues capable of climbing to $5,649, occupancy reaching a high of 52.3%, and ADRs peaking at $465.
- Conversely, the slowest single month of the year, typically falling within the low season, marks the market's lowest point. In this month, revenue might dip to $3,735, occupancy could drop to 36.9%, and ADRs may adjust down to $414.
- Understanding both the seasonal averages and these monthly peaks and troughs in revenue, occupancy, and ADR is crucial for maximizing your Airbnb profit potential in Beverly Hills.
Seasonal Strategies for Maximizing Profit
- Peak Season: Maximize revenue through premium pricing and potentially longer minimum stays. Ensure high availability.
- Low Season: Offer competitive pricing, special promotions (e.g., extended stay discounts), and flexible cancellation policies. Target off-season travelers like remote workers or budget-conscious guests.
- Shoulder Seasons: Implement dynamic pricing that balances peak and low rates. Target weekend travelers or specific events. Offer slightly more flexible terms than peak season.
- Regularly analyze your own performance against these Beverly Hills seasonality benchmarks and adjust your pricing and availability strategy accordingly.
Best Areas for Airbnb Investment in Beverly Hills (2026)
Exploring the top neighborhoods for short-term rentals in Beverly Hills? This section highlights key areas, outlining why they are attractive for hosts and guests, along with notable local attractions. Consider these locations based on your target guest profile and investment strategy.
| Neighborhood / Area | Why Host Here? (Target Guests & Appeal) | Key Attractions & Landmarks |
|---|---|---|
| Beverly Hills Flats | Luxurious residential area known for its beautiful homes and proximity to high-end shopping and dining. Ideal for travelers looking for a glamorous experience in the heart of Beverly Hills. | Rodeo Drive, Beverly Gardens Park, Greystone Mansion and Park, Los Angeles County Museum of Art (LACMA), The Getty Center |
| Rodeo Drive | World-renowned shopping destination famous for its luxury boutiques and designer stores. Perfect for affluent visitors seeking high-end shopping and celebrity sightings. | Rodeo Drive Shopping, Beverly Hills Sign, Beverly Hills Trolley Tour, Spadena House (The 'Pretty Woman' House) |
| Beverly Hills Hotel | Iconic hotel known as 'The Pink Palace', a favorite among celebrities. Offers a taste of classic Hollywood glamour and luxury. | The Beverly Hills Hotel, Spadena House, Caf�é Royale, Beverly Hills Bike Tours |
| Canyon Drive | Sleek and modern area offering privacy and tranquility surrounded by nature, popular among those who prefer a quieter stay close to nature. | Franklin Canyon Park, Beverly Hills Treetops, Trailheads to hiking paths |
| Sunset Boulevard | Famous for its vibrant nightlife, dining, and entertainment scene. Attracts visitors looking for lively activities and cultural experiences. | Sunset Strip, The Comedy Store, Whisky a Go Go, House of Blues, Sunset Plaza |
| Beverly Park | Exclusive gated community known for luxury estates and privacy, attracting high-profile guests who desire an upscale and secure experience. | Private estates, Beverly Park Mansion Tours, Luxury shopping nearby |
| Crescent Drive | Popular residential area with beautiful architecture and close proximity to upscale shopping and restaurants, appealing to visitors seeking convenience and luxury. | Rodeo Drive, The Museum of Television and Radio, Upscale dining |
| Greystone Mansion Surroundings | Scenic area featuring Greystone Mansion, known for its stunning architecture and gardens, attracting tourists interested in history and culture. | Greystone Mansion, Beverly Gardens Park, Historic tours, Photography opportunities |
Understanding Airbnb License Requirements & STR Laws in Beverly Hills (2026)
While Beverly Hills, California, United States currently shows low STR regulations, specific Airbnb license requirements might still exist or change. Always verify the latest short term rental regulations and Airbnb license requirements directly with local government authorities for Beverly Hills to ensure full compliance before hosting.
(Source: AirROI data, 2026, based on 4% licensed listings)
Top Performing Airbnb Properties in Beverly Hills (2026)
Benchmark your potential! Explore examples of top-performing Airbnb properties in Beverly Hillsbased on Trailing Twelve Month (TTM) revenue. Analyze their characteristics, revenue, occupancy rate, and ADR to understand what drives success in this market.

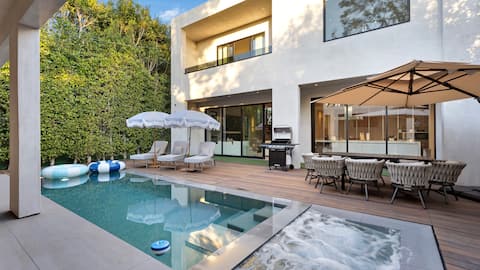
Hollywood Hills Luxe Retreat with Designer Style
Entire Place • 3 bedrooms

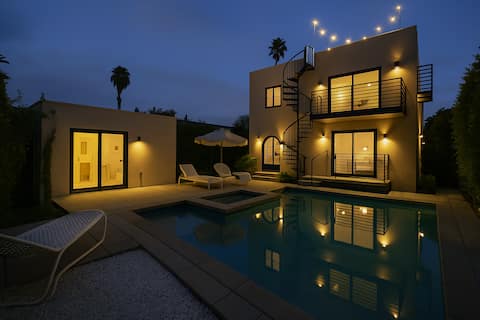
Amara by Stay Awhile Villas
Entire Place • 5 bedrooms

Trousdale Grand
Entire Place • 8 bedrooms
The Beverly Hills Modern Villa
Entire Place • 4 bedrooms
Elegant & Luxe Estate w/ Pool,Fire-Pit & Lounge
Entire Place • 5 bedrooms

Aman Oasis in Beverly Hills
Entire Place • 5 bedrooms
Note: Performance varies based on location, size, amenities, seasonality, and management quality. Data reflects the past 12 months.
Top Performing Airbnb Hosts in Beverly Hills (2026)
Learn from the best! This table showcases top-performing Airbnb hosts in Beverly Hills based on the number of properties managed and estimated total revenue over the past year. Analyze their scale and performance metrics.
| Host Name | Properties | Grossing Revenue | Stay Reviews | Avg Rating |
|---|---|---|---|---|
| Million Dollar Luxe | 7 | $952,132 | 48 | 4.91/5.0 |
| Cozy Homes | 32 | $941,083 | 292 | 4.64/5.0 |
| AboutAway | 4 | $799,542 | 58 | 4.86/5.0 |
| Mary | 15 | $603,357 | 366 | 4.84/5.0 |
| The Maimon Group | 3 | $596,753 | 18 | 5.00/5.0 |
| Chloe | 14 | $519,310 | 507 | 4.51/5.0 |
| Isabell | 3 | $476,645 | 207 | 4.91/5.0 |
| Akaisha | 12 | $456,763 | 234 | 4.81/5.0 |
| Sean | 4 | $435,070 | 274 | 4.67/5.0 |
| Lucy | 3 | $431,528 | 64 | 4.71/5.0 |
Analyzing the strategies of top hosts, such as their property selection, pricing, and guest communication, can offer valuable lessons for optimizing your own Airbnb operations in Beverly Hills.
Dive Deeper: Advanced Beverly Hills STR Market Data (2026)
Ready to unlock more insights? AirROI provides access to advanced metrics and comprehensive Airbnb data for Beverly Hills. Explore detailed analytics beyond this report to refine your investment strategy, optimize pricing, and maximize your vacation rental profits.
Explore Advanced MetricsBeverly Hills Short-Term Rental Market Composition (2026): Property & Room Types
Room Type Distribution
Property Type Distribution
Market Composition Insights for Beverly Hills
- The Beverly Hills Airbnb market composition is heavily skewed towards Entire Home/Apt listings, which make up 88% of the 576 active rentals. This indicates strong guest preference for privacy and space.
- Looking at the property type distribution in Beverly Hills, Apartment/Condo properties are the most common (67.2%), reflecting the local real estate landscape.
- Houses represent a significant 25.3% portion, catering likely to families or larger groups.
- The presence of 6.6% Hotel/Boutique listings indicates integration with traditional hospitality.
- Smaller segments like others, outdoor/unique (combined 0.9%) offer potential for unique stay experiences.
Beverly Hills Airbnb Room Capacity Analysis (2026): Bedroom Distribution
Distribution of Listings by Number of Bedrooms
Room Capacity Insights for Beverly Hills
- The dominant room capacity in Beverly Hills is 1 bedroom listings, making up 33.9% of the market. This suggests a strong demand for properties suitable for couples or solo travelers.
- Together, 1 bedroom and 2 bedrooms properties represent 62.5% of the active Airbnb listings in Beverly Hills, indicating a high concentration in these sizes.
- A significant 23.3% of listings offer 3+ bedrooms, catering to larger groups and families seeking more space in Beverly Hills.
Beverly Hills Vacation Rental Guest Capacity Trends (2026)
Distribution of Listings by Guest Capacity
Guest Capacity Insights for Beverly Hills
- The most common guest capacity trend in Beverly Hills vacation rentals is listings accommodating 4 guests (21.9%). This suggests the primary traveler segment is likely small families or groups.
- Properties designed for 4 guests and 2 guests dominate the Beverly Hills STR market, accounting for 41.7% of listings.
- 32.7% of properties accommodate 6+ guests, serving the market segment for larger families or group travel in Beverly Hills.
- On average, properties in Beverly Hills are equipped to host 4.3 guests.
Beverly Hills Airbnb Booking Patterns (2026): Available vs. Booked Days
Available Days Distribution
Booked Days Distribution
Booking Pattern Insights for Beverly Hills
- The most common availability pattern in Beverly Hills falls within the 271-366 days range, representing 52.8% of listings. This suggests many properties have significant open periods on their calendars.
- Approximately 83.0% of listings show high availability (181+ days open annually), indicating potential for increased bookings or specific owner usage patterns.
- For booked days, the 91-180 days range is most frequent in Beverly Hills (31.1%), reflecting common guest stay durations or potential owner blocking patterns.
- A notable 18.4% of properties secure long booking periods (181+ days booked per year), highlighting successful long-term rental strategies or significant owner usage.
Beverly Hills Airbnb Minimum Stay Requirements Analysis
Distribution of Listings by Minimum Night Requirement
1 Night
111 listings
19.3% of total
2 Nights
129 listings
22.4% of total
3 Nights
23 listings
4% of total
4-6 Nights
40 listings
6.9% of total
7-29 Nights
64 listings
11.1% of total
30+ Nights
209 listings
36.3% of total
Key Insights
- The most prevalent minimum stay requirement in Beverly Hills is 30+ Nights, adopted by 36.3% of listings. This highlights the market's preference for longer commitments.
- A significant segment (36.3%) caters to monthly stays (30+ nights) in Beverly Hills, pointing to opportunities in the extended-stay market.
Recommendations
- Align with the market by considering a 30+ Nights minimum stay, as 36.3% of Beverly Hills hosts use this setting.
- If feasible, allowing 1-night stays, especially midweek or during low season, could capture last-minute bookings, as only 19.3% currently do.
- Explore offering discounts for stays of 30+ nights to attract the 36.3% of the market seeking extended stays.
- Adjust minimum nights based on seasonality – potentially shorter during low season and longer during peak demand periods in Beverly Hills.
Beverly Hills Airbnb Cancellation Policy Trends Analysis (2026)
Limited
4 listings
0.7% of total
Super Strict 30 Days
8 listings
1.4% of total
Non-refundable
4 listings
0.7% of total
Refundable
1 listings
0.2% of total
Flexible
78 listings
13.6% of total
Moderate
142 listings
24.8% of total
Firm
186 listings
32.5% of total
Strict
149 listings
26% of total
Cancellation Policy Insights for Beverly Hills
- The prevailing Airbnb cancellation policy trend in Beverly Hills is Firm, used by 32.5% of listings.
- A majority (58.5%) of hosts in Beverly Hills utilize Firm or Strict policies, indicating a market where hosts prioritize booking security.
Recommendations for Hosts
- Consider adopting a Firm policy to align with the 32.5% market standard in Beverly Hills.
- Regularly review your cancellation policy against competitors and market demand shifts in Beverly Hills.
Beverly Hills STR Booking Lead Time Analysis (2026)
Average Booking Lead Time by Month
Booking Lead Time Insights for Beverly Hills
- The overall average booking lead time for vacation rentals in Beverly Hills is 30 days.
- Guests book furthest in advance for stays during July (average 40 days), likely coinciding with peak travel demand or local events.
- The shortest booking windows occur for stays in February (average 23 days), indicating more last-minute travel plans during this time.
- Seasonally, Summer (39 days avg.) sees the longest lead times, while Winter (30 days avg.) has the shortest, reflecting typical travel planning cycles.
Recommendations for Hosts
- Use the overall average lead time (30 days) as a baseline for your pricing and availability strategy in Beverly Hills.
- Target marketing efforts for the Summer season well in advance (at least 39 days) to capture early planners.
- Monitor your own booking lead times against these Beverly Hills averages to identify opportunities for dynamic pricing adjustments.
Popular & Essential Airbnb Amenities in Beverly Hills (2026)
Amenity Prevalence
Amenity Insights for Beverly Hills
- Essential amenities in Beverly Hills that guests expect include: Wifi, TV, Air conditioning, Smoke alarm. Lacking these (any) could significantly impact bookings.
- Popular amenities like Kitchen, Hot water, Heating are common but not universal. Offering these can provide a competitive edge.
Recommendations for Hosts
- Ensure your listing includes all essential amenities for Beverly Hills: Wifi, TV, Air conditioning, Smoke alarm.
- Prioritize adding missing essentials: Wifi, TV, Air conditioning, Smoke alarm.
- Consider adding popular differentiators like Kitchen or Hot water to increase appeal.
- Highlight unique or less common amenities you offer (e.g., hot tub, dedicated workspace, EV charger) in your listing description and photos.
- Regularly check competitor amenities in Beverly Hills to stay competitive.
Beverly Hills Airbnb Guest Demographics & Profile Analysis (2026)
Guest Profile Summary for Beverly Hills
- The typical guest profile for Airbnb in Beverly Hills consists of primarily domestic travelers (66%), often arriving from nearby Los Angeles, typically belonging to the Post-2000s (Gen Z/Alpha) group (50%), primarily speaking English or Spanish.
- Domestic travelers account for 65.8% of guests.
- Key international markets include United States (65.8%) and Canada (4%).
- Top languages spoken are English (53.8%) followed by Spanish (14.1%).
- A significant demographic segment is the Post-2000s (Gen Z/Alpha) group, representing 50% of guests.
Recommendations for Hosts
- Target domestic marketing efforts towards travelers from Los Angeles and New York.
- Tailor amenities and listing descriptions to appeal to the dominant Post-2000s (Gen Z/Alpha) demographic (e.g., highlight fast WiFi, smart home features, local guides).
- Highlight unique local experiences or amenities relevant to the primary guest profile.
- Consider seasonal promotions aligned with peak travel times for key origin markets.
Nearby Short-Term Rental Market Comparison
How does the Beverly Hills Airbnb market stack up against its neighbors? Compare key performance metrics like average monthly revenue, ADR, and occupancy rates in surrounding areas to understand the broader regional STR landscape.
| Market | Active Properties | Monthly Revenue | Daily Rate | Avg. Occupancy |
|---|---|---|---|---|
| Montecito | 127 | $10,744 | $950.35 | 51% |
| Newport Beach | 1,273 | $8,950 | $744.06 | 47% |
| Malibu | 251 | $8,293 | $1263.89 | 35% |
| Manhattan Beach | 267 | $7,875 | $585.30 | 53% |
| Toro Canyon | 33 | $6,935 | $717.58 | 42% |
| Avalon | 249 | $6,705 | $696.60 | 38% |
| Summerland | 88 | $6,323 | $494.72 | 49% |
| Rancho Santa Fe | 34 | $6,074 | $913.16 | 35% |
| Unincorporated Santa Monica Mountains | 119 | $6,008 | $699.60 | 38% |
| Encinitas | 559 | $5,940 | $543.93 | 49% |