Big Bear Airbnb Market Analysis 2026: Short Term Rental Data & Vacation Rental Statistics in California, United States
Is Airbnb profitable in Big Bear in 2026? Explore comprehensive Airbnb analytics for Big Bear, California, United States to uncover income potential. This 2026 STR market report for Big Bear, based on AirROI data from February 2025 to January 2026, reveals key trends in the niche market of 188 active listings.
Whether you're considering an Airbnb investment in Big Bear, optimizing your existing vacation rental, or exploring rental arbitrage opportunities, understanding the Big Bear Airbnb data is crucial. Navigating the high regulation landscape is key to maximizing your short term rental income potential. Let's dive into the specifics.
Key Big Bear Airbnb Performance Metrics Overview
Monthly Airbnb Revenue Variations & Income Potential in Big Bear (2026)
Understanding the monthly revenue variations for Airbnb listings in Big Bear is key to maximizing your short term rental income potential. Seasonality significantly impacts earnings. Our analysis, based on data from the past 12 months, shows that the peak revenue month for STRs in Big Bear is typically December, while May often presents the lowest earnings, highlighting opportunities for strategic pricing adjustments during shoulder and low seasons. Explore the typical Airbnb income in Big Bear across different performance tiers:
- Best-in-class properties (Top 10%) achieve $6,255+ monthly, often utilizing dynamic pricing and superior guest experiences.
- Strong performing properties (Top 25%) earn $3,994 or more, indicating effective management and desirable locations/amenities.
- Typical properties (Median) generate around $2,330 per month, representing the average market performance.
- Entry-level properties (Bottom 25%) see earnings around $1,248, often with potential for optimization.
Average Monthly Airbnb Earnings Trend in Big Bear
Big Bear Airbnb Occupancy Rate Trends (2026)
Maximize your bookings by understanding the Big Bear STR occupancy trends. Seasonal demand shifts significantly influence how often properties are booked. Typically, Decembersees the highest demand (peak season occupancy), while May experiences the lowest (low season). Effective strategies, like adjusting minimum stays or offering promotions, can boost occupancy during slower periods. Here's how different property tiers perform in Big Bear:
- Best-in-class properties (Top 10%) achieve 64%+ occupancy, indicating high desirability and potentially optimized availability.
- Strong performing properties (Top 25%) maintain 41% or higher occupancy, suggesting good market fit and guest satisfaction.
- Typical properties (Median) have an occupancy rate around 27%.
- Entry-level properties (Bottom 25%) average 14% occupancy, potentially facing higher vacancy.
Average Monthly Occupancy Rate Trend in Big Bear
Average Daily Rate (ADR) Airbnb Trends in Big Bear (2026)
Effective short term rental pricing strategy in Big Bear involves understanding monthly ADR fluctuations. The Average Daily Rate (ADR) for Airbnb in Big Bear typically peaks in December and dips lowest during August. Leveraging Airbnb dynamic pricing tools or strategies based on this seasonality can significantly boost revenue. Here's a look at the typical nightly rates achieved:
- Best-in-class properties (Top 10%) command rates of $564+ per night, often due to premium features or locations.
- Strong performing properties (Top 25%) achieve nightly rates of $395 or more.
- Typical properties (Median) charge around $274 per night.
- Entry-level properties (Bottom 25%) earn around $205 per night.
Average Daily Rate (ADR) Trend by Month in Big Bear
Get Live Big Bear Market Intelligence 👇

Explore Real-time Analytics
Airbnb Seasonality Analysis & Trends in Big Bear (2026)
Peak Season (December, January, February)
- Revenue averages $5,150 per month
- Occupancy rates average 38.9%
- Daily rates average $413
Shoulder Season
- Revenue averages $2,760 per month
- Occupancy maintains around 30.2%
- Daily rates hold near $311
Low Season (April, May, September)
- Revenue drops to average $2,084 per month
- Occupancy decreases to average 23.7%
- Daily rates adjust to average $305
Seasonality Insights for Big Bear
- The Airbnb seasonality in Big Bear shows highly seasonal trends requiring careful strategy. While the sections above show seasonal averages, it's also insightful to look at the extremes:
- During the high season, the absolute peak month showcases Big Bear's highest earning potential, with monthly revenues capable of climbing to $6,786, occupancy reaching a high of 44.1%, and ADRs peaking at $470.
- Conversely, the slowest single month of the year, typically falling within the low season, marks the market's lowest point. In this month, revenue might dip to $1,841, occupancy could drop to 18.8%, and ADRs may adjust down to $283.
- Understanding both the seasonal averages and these monthly peaks and troughs in revenue, occupancy, and ADR is crucial for maximizing your Airbnb profit potential in Big Bear.
Seasonal Strategies for Maximizing Profit
- Peak Season: Maximize revenue through premium pricing and potentially longer minimum stays. Ensure high availability.
- Low Season: Offer competitive pricing, special promotions (e.g., extended stay discounts), and flexible cancellation policies. Target off-season travelers like remote workers or budget-conscious guests.
- Shoulder Seasons: Implement dynamic pricing that balances peak and low rates. Target weekend travelers or specific events. Offer slightly more flexible terms than peak season.
- Regularly analyze your own performance against these Big Bear seasonality benchmarks and adjust your pricing and availability strategy accordingly.
Best Areas for Airbnb Investment in Big Bear (2026)
Exploring the top neighborhoods for short-term rentals in Big Bear? This section highlights key areas, outlining why they are attractive for hosts and guests, along with notable local attractions. Consider these locations based on your target guest profile and investment strategy.
| Neighborhood / Area | Why Host Here? (Target Guests & Appeal) | Key Attractions & Landmarks |
|---|---|---|
| Big Bear Lake | The centerpiece of the area, known for its beautiful lake and numerous outdoor activities. Ideal for families and those seeking recreation, relaxation, and stunning views. | Big Bear Lake, Alpine Slide at Magic Mountain, Big Bear Discovery Center, Snow Summit, Bear Mountain Ski Resort |
| Big Bear Village | The charming downtown area features shops, restaurants, and entertainment, making it a hub for visitors. Great for those who want to experience the local lifestyle and nightlife. | Big Bear Village, The Village Drive, Big Bear Lake Brewing Company, Mountain Moonshine, Pine Knot Marina |
| Snow Summit | A popular skiing and snowboarding destination that attracts winter sports enthusiasts. Great for year-round investment due to seasonal sports and summer activities. | Snow Summit Ski Resort, Mountain Biking Trails, Chairlift Rides, Winter Snow Play |
| Bear Mountain | Another premier skiing area, known for its terrain parks and downhill skiing. Attracts serious skiers and snowboarders, especially during winter. | Bear Mountain Ski Resort, The Zoo at Bear Mountain, Snowboarding Terrain Parks |
| Moonridge | A residential area providing a quieter experience, yet close to the action. Ideal for families and those looking for a peaceful retreat in nature. | Moonridge Zoo, Bear Mountain Golf Course, Hiking Trails, Beautiful Scenic Views |
| Fawnskin | A quaint community located on the north shore of Big Bear Lake. Offers a quieter retreat with stunning views, perfect for cabin rentals and nature lovers. | Fawnskin Village, Big Bear Discovery Center, Kayaking on Big Bear Lake, Scenic Hiking Trails |
| Crestline | A serene mountain town just outside of Big Bear, offering alternative vacation options. Draws visitors looking for a tranquil getaway amidst nature. | Lake Gregory, Crestline Village, Hiking Trails, Fishing |
| Sugarloaf | A peaceful area with a local vibe, less touristy than other parts of Big Bear, making it attractive for those looking for a more authentic experience. | Local Shops, Hiking Trails, Nearby Nature |
Understanding Airbnb License Requirements & STR Laws in Big Bear (2026)
Yes, Big Bear, California, United States enforces high STR regulations. Obtaining a license and ensuring compliance is almost certainly required according to current 2026 STR laws. Always verify the latest short term rental regulations and Airbnb license requirements directly with local government authorities for Big Bear to ensure full compliance before hosting.
(Source: AirROI data, 2026, based on 95% licensed listings)
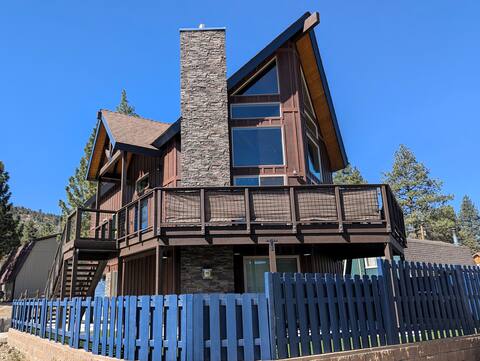
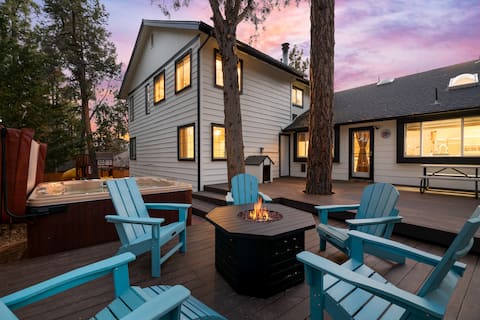
Top Performing Airbnb Properties in Big Bear (2026)
Benchmark your potential! Explore examples of top-performing Airbnb properties in Big Bearbased on Trailing Twelve Month (TTM) revenue. Analyze their characteristics, revenue, occupancy rate, and ADR to understand what drives success in this market.
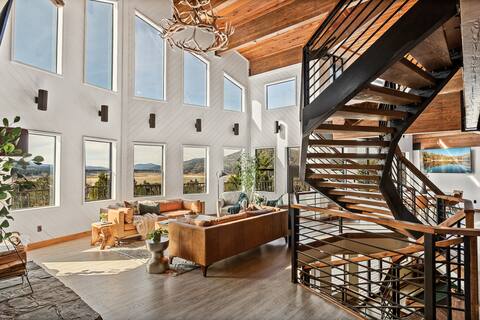
Steel Pine Lodge: As Seen On TV & Winter Views
Entire Place • 5 bedrooms

Brand New, Game Room, Luxury!
Entire Place • 4 bedrooms

New! Bearadise ~ Stylish Mountain Retreat
Entire Place • 4 bedrooms

Recovery Getaway | Sauna, Hot Tub, Arcade & Bocce!
Entire Place • 2 bedrooms
Big Bear's Best: Cozy Cabin for Families & Writers
Entire Place • 5 bedrooms
Family Oasis: quiet, 10 min to slopes! GameDen+Spa
Entire Place • 5 bedrooms
Note: Performance varies based on location, size, amenities, seasonality, and management quality. Data reflects the past 12 months.
Top Performing Airbnb Hosts in Big Bear (2026)
Learn from the best! This table showcases top-performing Airbnb hosts in Big Bear based on the number of properties managed and estimated total revenue over the past year. Analyze their scale and performance metrics.
| Host Name | Properties | Grossing Revenue | Stay Reviews | Avg Rating |
|---|---|---|---|---|
| Destination Big Bear Vacation | 8 | $244,279 | 159 | 4.85/5.0 |
| Leanne | 1 | $229,284 | 46 | 5.00/5.0 |
| Wander | 1 | $222,331 | 91 | 4.98/5.0 |
| Bryan | 7 | $215,299 | 161 | 4.78/5.0 |
| Leanne | 6 | $181,575 | 149 | 4.93/5.0 |
| Cool Cabins | 14 | $166,585 | 58 | 4.41/5.0 |
| Bearadise | 4 | $158,215 | 99 | 4.56/5.0 |
| Robinhood Management | 7 | $131,439 | 56 | 4.65/5.0 |
| Shawn And Amanda | 3 | $92,091 | 157 | 4.93/5.0 |
| Gannon | 1 | $84,563 | 296 | 4.89/5.0 |
Analyzing the strategies of top hosts, such as their property selection, pricing, and guest communication, can offer valuable lessons for optimizing your own Airbnb operations in Big Bear.
Dive Deeper: Advanced Big Bear STR Market Data (2026)
Ready to unlock more insights? AirROI provides access to advanced metrics and comprehensive Airbnb data for Big Bear. Explore detailed analytics beyond this report to refine your investment strategy, optimize pricing, and maximize your vacation rental profits.
Explore Advanced MetricsBig Bear Short-Term Rental Market Composition (2026): Property & Room Types
Room Type Distribution
Property Type Distribution
Market Composition Insights for Big Bear
- The Big Bear Airbnb market composition is heavily skewed towards Entire Home/Apt listings, which make up 96.8% of the 188 active rentals. This indicates strong guest preference for privacy and space.
- Looking at the property type distribution in Big Bear, Outdoor/Unique properties are the most common (60.1%), reflecting the local real estate landscape.
- Houses represent a significant 38.8% portion, catering likely to families or larger groups.
- Smaller segments like apartment/condo, hotel/boutique (combined 1.0%) offer potential for unique stay experiences.
Big Bear Airbnb Room Capacity Analysis (2026): Bedroom Distribution
Distribution of Listings by Number of Bedrooms
Room Capacity Insights for Big Bear
- The dominant room capacity in Big Bear is 2 bedrooms listings, making up 38.3% of the market. This suggests a strong demand for properties suitable for couples or solo travelers.
- Together, 2 bedrooms and 3 bedrooms properties represent 73.4% of the active Airbnb listings in Big Bear, indicating a high concentration in these sizes.
- A significant 55.4% of listings offer 3+ bedrooms, catering to larger groups and families seeking more space in Big Bear.
Big Bear Vacation Rental Guest Capacity Trends (2026)
Distribution of Listings by Guest Capacity
Guest Capacity Insights for Big Bear
- The most common guest capacity trend in Big Bear vacation rentals is listings accommodating 8+ guests (49.5%). This suggests the primary traveler segment is likely larger groups.
- Properties designed for 8+ guests and 6 guests dominate the Big Bear STR market, accounting for 76.1% of listings.
- 78.8% of properties accommodate 6+ guests, serving the market segment for larger families or group travel in Big Bear.
- On average, properties in Big Bear are equipped to host 6.5 guests.
Big Bear Airbnb Booking Patterns (2026): Available vs. Booked Days
Available Days Distribution
Booked Days Distribution
Booking Pattern Insights for Big Bear
- The most common availability pattern in Big Bear falls within the 271-366 days range, representing 71.3% of listings. This suggests many properties have significant open periods on their calendars.
- Approximately 94.2% of listings show high availability (181+ days open annually), indicating potential for increased bookings or specific owner usage patterns.
- For booked days, the 31-90 days range is most frequent in Big Bear (42.6%), reflecting common guest stay durations or potential owner blocking patterns.
- A notable 6.4% of properties secure long booking periods (181+ days booked per year), highlighting successful long-term rental strategies or significant owner usage.
Big Bear Airbnb Minimum Stay Requirements Analysis
Distribution of Listings by Minimum Night Requirement
1 Night
56 listings
29.8% of total
2 Nights
65 listings
34.6% of total
30+ Nights
67 listings
35.6% of total
Key Insights
- The most prevalent minimum stay requirement in Big Bear is 30+ Nights, adopted by 35.6% of listings. This highlights the market's preference for longer commitments.
- A strong majority (64.4%) of the Big Bear Airbnb data shows acceptance of very short stays (1-2 nights), indicating a dynamic, high-turnover market.
- A significant segment (35.6%) caters to monthly stays (30+ nights) in Big Bear, pointing to opportunities in the extended-stay market.
Recommendations
- Align with the market by considering a 30+ Nights minimum stay, as 35.6% of Big Bear hosts use this setting.
- If feasible, allowing 1-night stays, especially midweek or during low season, could capture last-minute bookings, as only 29.8% currently do.
- Explore offering discounts for stays of 30+ nights to attract the 35.6% of the market seeking extended stays.
- Adjust minimum nights based on seasonality – potentially shorter during low season and longer during peak demand periods in Big Bear.
Big Bear Airbnb Cancellation Policy Trends Analysis (2026)
Super Strict 30 Days
8 listings
4.3% of total
Limited
16 listings
8.5% of total
Flexible
13 listings
6.9% of total
Moderate
64 listings
34% of total
Firm
56 listings
29.8% of total
Strict
31 listings
16.5% of total
Cancellation Policy Insights for Big Bear
- The prevailing Airbnb cancellation policy trend in Big Bear is Moderate, used by 34% of listings.
- There's a relatively balanced mix between guest-friendly (40.9%) and stricter (46.3%) policies, offering choices for different guest needs.
Recommendations for Hosts
- Consider adopting a Moderate policy to align with the 34% market standard in Big Bear.
- Regularly review your cancellation policy against competitors and market demand shifts in Big Bear.
Big Bear STR Booking Lead Time Analysis (2026)
Average Booking Lead Time by Month
Booking Lead Time Insights for Big Bear
- The overall average booking lead time for vacation rentals in Big Bear is 27 days.
- Guests book furthest in advance for stays during December (average 49 days), likely coinciding with peak travel demand or local events.
- The shortest booking windows occur for stays in May (average 16 days), indicating more last-minute travel plans during this time.
- Seasonally, Winter (38 days avg.) sees the longest lead times, while Spring (18 days avg.) has the shortest, reflecting typical travel planning cycles.
Recommendations for Hosts
- Use the overall average lead time (27 days) as a baseline for your pricing and availability strategy in Big Bear.
- For December stays, consider implementing length-of-stay discounts or slightly higher rates for bookings made less than 49 days out to capitalize on advance planning.
- Target marketing efforts for the Winter season well in advance (at least 38 days) to capture early planners.
- Monitor your own booking lead times against these Big Bear averages to identify opportunities for dynamic pricing adjustments.
Popular & Essential Airbnb Amenities in Big Bear (2026)
Amenity Prevalence
Amenity Insights for Big Bear
- Essential amenities in Big Bear that guests expect include: Carbon monoxide alarm, Smoke alarm, Wifi, Kitchen, Refrigerator, TV, Fire extinguisher, Heating, Microwave, Dishes and silverware. Lacking these (any) could significantly impact bookings.
Recommendations for Hosts
- Ensure your listing includes all essential amenities for Big Bear: Carbon monoxide alarm, Smoke alarm, Wifi, Kitchen, Refrigerator, TV, Fire extinguisher, Heating, Microwave, Dishes and silverware.
- Prioritize adding missing essentials: Carbon monoxide alarm, Smoke alarm, Wifi, Kitchen, Refrigerator, TV, Fire extinguisher, Heating, Microwave, Dishes and silverware.
- Highlight unique or less common amenities you offer (e.g., hot tub, dedicated workspace, EV charger) in your listing description and photos.
- Regularly check competitor amenities in Big Bear to stay competitive.
Big Bear Airbnb Guest Demographics & Profile Analysis (2026)
Guest Profile Summary for Big Bear
- The typical guest profile for Airbnb in Big Bear consists of primarily domestic travelers (96%), often arriving from nearby Los Angeles, typically belonging to the Post-2000s (Gen Z/Alpha) group (50%), primarily speaking English or Spanish.
- Domestic travelers account for 95.5% of guests.
- Key international markets include United States (95.5%) and Mexico (1.6%).
- Top languages spoken are English (59.7%) followed by Spanish (27%).
- A significant demographic segment is the Post-2000s (Gen Z/Alpha) group, representing 50% of guests.
Recommendations for Hosts
- Target domestic marketing efforts towards travelers from Los Angeles and San Diego.
- Tailor amenities and listing descriptions to appeal to the dominant Post-2000s (Gen Z/Alpha) demographic (e.g., highlight fast WiFi, smart home features, local guides).
- Highlight unique local experiences or amenities relevant to the primary guest profile.
- Consider seasonal promotions aligned with peak travel times for key origin markets.
Nearby Short-Term Rental Market Comparison
How does the Big Bear Airbnb market stack up against its neighbors? Compare key performance metrics like average monthly revenue, ADR, and occupancy rates in surrounding areas to understand the broader regional STR landscape.
| Market | Active Properties | Monthly Revenue | Daily Rate | Avg. Occupancy |
|---|---|---|---|---|
| Newport Beach | 1,273 | $8,950 | $744.06 | 47% |
| Thousand Palms | 33 | $8,119 | $725.48 | 36% |
| GlenOak Hills | 41 | $7,394 | $648.65 | 41% |
| Bermuda Dunes | 143 | $7,324 | $664.90 | 39% |
| Rancho Santa Fe | 34 | $6,074 | $913.16 | 35% |
| Encinitas | 559 | $5,940 | $543.93 | 49% |
| Santa Margarita Ranchos | 18 | $5,614 | $506.60 | 36% |
| Indio | 1,427 | $5,394 | $584.45 | 37% |
| Coachella | 367 | $5,300 | $649.22 | 38% |
| Pioneertown | 98 | $5,283 | $475.08 | 41% |