Bolinas Airbnb Market Analysis 2026: Short Term Rental Data & Vacation Rental Statistics in California, United States
Is Airbnb profitable in Bolinas in 2026? Explore comprehensive Airbnb analytics for Bolinas, California, United States to uncover income potential. This 2026 STR market report for Bolinas, based on AirROI data from February 2025 to January 2026, reveals key trends in the niche market of 49 active listings.
Whether you're considering an Airbnb investment in Bolinas, optimizing your existing vacation rental, or exploring rental arbitrage opportunities, understanding the Bolinas Airbnb data is crucial. Leveraging the low regulation environment is key to maximizing your short term rental income potential. Let's dive into the specifics.
Key Bolinas Airbnb Performance Metrics Overview
Monthly Airbnb Revenue Variations & Income Potential in Bolinas (2026)
Understanding the monthly revenue variations for Airbnb listings in Bolinas is key to maximizing your short term rental income potential. Seasonality significantly impacts earnings. Our analysis, based on data from the past 12 months, shows that the peak revenue month for STRs in Bolinas is typically August, while February often presents the lowest earnings, highlighting opportunities for strategic pricing adjustments during shoulder and low seasons. Explore the typical Airbnb income in Bolinas across different performance tiers:
- Best-in-class properties (Top 10%) achieve $16,865+ monthly, often utilizing dynamic pricing and superior guest experiences.
- Strong performing properties (Top 25%) earn $9,178 or more, indicating effective management and desirable locations/amenities.
- Typical properties (Median) generate around $5,305 per month, representing the average market performance.
- Entry-level properties (Bottom 25%) see earnings around $3,116, often with potential for optimization.
Average Monthly Airbnb Earnings Trend in Bolinas
Bolinas Airbnb Occupancy Rate Trends (2026)
Maximize your bookings by understanding the Bolinas STR occupancy trends. Seasonal demand shifts significantly influence how often properties are booked. Typically, Augustsees the highest demand (peak season occupancy), while January experiences the lowest (low season). Effective strategies, like adjusting minimum stays or offering promotions, can boost occupancy during slower periods. Here's how different property tiers perform in Bolinas:
- Best-in-class properties (Top 10%) achieve 79%+ occupancy, indicating high desirability and potentially optimized availability.
- Strong performing properties (Top 25%) maintain 67% or higher occupancy, suggesting good market fit and guest satisfaction.
- Typical properties (Median) have an occupancy rate around 46%.
- Entry-level properties (Bottom 25%) average 29% occupancy, potentially facing higher vacancy.
Average Monthly Occupancy Rate Trend in Bolinas
Average Daily Rate (ADR) Airbnb Trends in Bolinas (2026)
Effective short term rental pricing strategy in Bolinas involves understanding monthly ADR fluctuations. The Average Daily Rate (ADR) for Airbnb in Bolinas typically peaks in May and dips lowest during February. Leveraging Airbnb dynamic pricing tools or strategies based on this seasonality can significantly boost revenue. Here's a look at the typical nightly rates achieved:
- Best-in-class properties (Top 10%) command rates of $894+ per night, often due to premium features or locations.
- Strong performing properties (Top 25%) achieve nightly rates of $636 or more.
- Typical properties (Median) charge around $361 per night.
- Entry-level properties (Bottom 25%) earn around $265 per night.
Average Daily Rate (ADR) Trend by Month in Bolinas
Get Live Bolinas Market Intelligence 👇

Explore Real-time Analytics
Airbnb Seasonality Analysis & Trends in Bolinas (2026)
Peak Season (August, July, December)
- Revenue averages $9,300 per month
- Occupancy rates average 57.1%
- Daily rates average $503
Shoulder Season
- Revenue averages $6,963 per month
- Occupancy maintains around 47.2%
- Daily rates hold near $511
Low Season (January, February, March)
- Revenue drops to average $5,467 per month
- Occupancy decreases to average 40.6%
- Daily rates adjust to average $477
Seasonality Insights for Bolinas
- The Airbnb seasonality in Bolinas shows highly seasonal trends requiring careful strategy. While the sections above show seasonal averages, it's also insightful to look at the extremes:
- During the high season, the absolute peak month showcases Bolinas's highest earning potential, with monthly revenues capable of climbing to $10,762, occupancy reaching a high of 62.8%, and ADRs peaking at $533.
- Conversely, the slowest single month of the year, typically falling within the low season, marks the market's lowest point. In this month, revenue might dip to $4,574, occupancy could drop to 37.1%, and ADRs may adjust down to $458.
- Understanding both the seasonal averages and these monthly peaks and troughs in revenue, occupancy, and ADR is crucial for maximizing your Airbnb profit potential in Bolinas.
Seasonal Strategies for Maximizing Profit
- Peak Season: Maximize revenue through premium pricing and potentially longer minimum stays. Ensure high availability.
- Low Season: Offer competitive pricing, special promotions (e.g., extended stay discounts), and flexible cancellation policies. Target off-season travelers like remote workers or budget-conscious guests.
- Shoulder Seasons: Implement dynamic pricing that balances peak and low rates. Target weekend travelers or specific events. Offer slightly more flexible terms than peak season.
- Regularly analyze your own performance against these Bolinas seasonality benchmarks and adjust your pricing and availability strategy accordingly.
Best Areas for Airbnb Investment in Bolinas (2026)
Exploring the top neighborhoods for short-term rentals in Bolinas? This section highlights key areas, outlining why they are attractive for hosts and guests, along with notable local attractions. Consider these locations based on your target guest profile and investment strategy.
| Neighborhood / Area | Why Host Here? (Target Guests & Appeal) | Key Attractions & Landmarks |
|---|---|---|
| Bolinas Beach | Beautiful coastal area known for its stunning beach and relaxed vibe. Attracts visitors looking for a tranquil escape by the ocean, perfect for water sports and relaxation. | Bolinas Beach, Agate Beach, Bolinas Lagoon, Muir Woods National Monument, Point Reyes National Seashore |
| Downtown Bolinas | The heart of the small town featuring local shops and eateries. A great spot for those who want to experience the local culture and community. | Bolinas Museum, Local Cafes, Shopping at the Market, Bolinas Park, Community Events |
| Stinson Beach | Nearby Stinson Beach offers a picturesque beach setting with dining options and access to hiking trails. It's a popular spot for day-trippers and outdoor enthusiasts. | Stinson Beach, Dipsea Trail, Marine Mammal Center, Stinson Beach Park, Coastal Trail |
| Point Reyes | A short drive from Bolinas, this area is famous for its natural beauty and wildlife. It's frequented by nature lovers and photographers. | Point Reyes Lighthouse, Tule Elk Reserve, Chimney Rock, Tomales Bay, Drakes Beach |
| Marin Headlands | Offers breathtaking views of the Golden Gate and the Bay Area. Ideal for outdoor activities and photography, attracting nature lovers and hikers. | Marin Headlands Trail, Battery Spencer, Point Bonita Lighthouse, Views of San Francisco, Beach access |
| Muir Woods | Famous for its ancient coastal redwood trees, this national monument attracts visitors seeking adventure and nature. Perfect for eco-tourism. | Muir Woods National Monument, Hiking trails, Historical tour, Nature photography, Visitor center |
| Tomales Bay | Known for its scenic beauty and outdoor activities, including kayaking and oyster tasting. A favorite for culinary tourism and adventure seekers. | Tomales Bay State Park, Oyster Farms, Kayaking, Scenic drives, Wildlife watching |
| Drakes Beach | A beautiful beach known for its calm waters and stunning cliffs. Ideal for families and those looking to enjoy beach activities. | Drakes Beach, Tide pools, Point Reyes National Seashore, Historic sites, Scenic views |
Understanding Airbnb License Requirements & STR Laws in Bolinas (2026)
While Bolinas, California, United States currently shows low STR regulations, specific Airbnb license requirements might still exist or change. Always verify the latest short term rental regulations and Airbnb license requirements directly with local government authorities for Bolinas to ensure full compliance before hosting.
(Source: AirROI data, 2026, finding no licensed listings among those analyzed)
Top Performing Airbnb Properties in Bolinas (2026)
Benchmark your potential! Explore examples of top-performing Airbnb properties in Bolinasbased on Trailing Twelve Month (TTM) revenue. Analyze their characteristics, revenue, occupancy rate, and ADR to understand what drives success in this market.
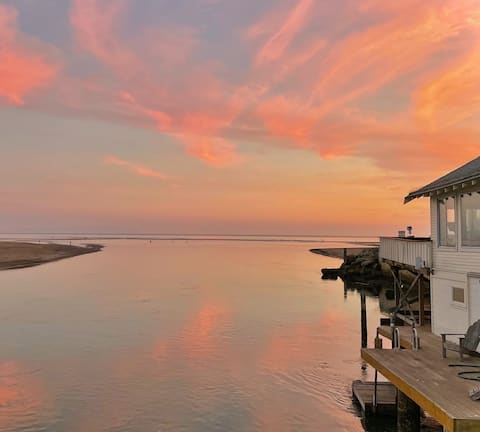
Oceanfront Bolinas hide-a-way
Entire Place • 4 bedrooms
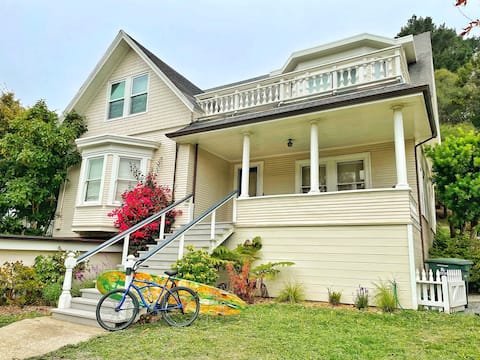
Stunning victorian farm house in heart of Bolinas
Entire Place • 4 bedrooms
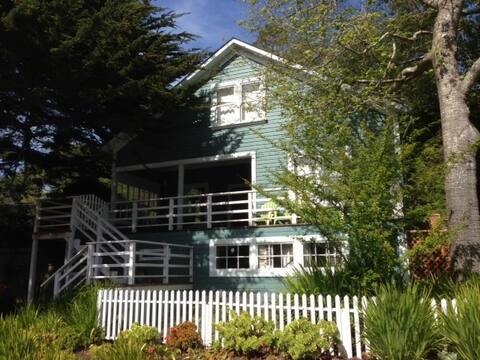
Bolinas Beach Home
Entire Place • 3 bedrooms
Al Capone's Beach House
Entire Place • 5 bedrooms

Beach House ~180° Views, Hot Tub, Curated Interior
Entire Place • 2 bedrooms

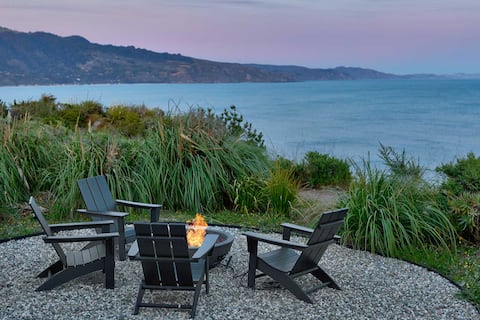
Views for miles of the Ocean and Bolinas Lagoon
Entire Place • 3 bedrooms
Note: Performance varies based on location, size, amenities, seasonality, and management quality. Data reflects the past 12 months.
Top Performing Airbnb Hosts in Bolinas (2026)
Learn from the best! This table showcases top-performing Airbnb hosts in Bolinas based on the number of properties managed and estimated total revenue over the past year. Analyze their scale and performance metrics.
| Host Name | Properties | Grossing Revenue | Stay Reviews | Avg Rating |
|---|---|---|---|---|
| Matthew | 2 | $464,028 | 369 | 4.93/5.0 |
| Alyssa | 1 | $218,689 | 62 | 4.97/5.0 |
| Highway One | 3 | $205,087 | 148 | 4.89/5.0 |
| Lisa | 1 | $197,865 | 222 | 4.79/5.0 |
| Erin | 1 | $185,567 | 118 | 5.00/5.0 |
| Drew | 1 | $135,559 | 9 | 4.78/5.0 |
| Linda | 1 | $134,489 | 90 | 4.97/5.0 |
| Smileys | 5 | $127,604 | 485 | 4.61/5.0 |
| Fred | 1 | $125,063 | 173 | 4.92/5.0 |
| Brody | 1 | $109,859 | 17 | 5.00/5.0 |
Analyzing the strategies of top hosts, such as their property selection, pricing, and guest communication, can offer valuable lessons for optimizing your own Airbnb operations in Bolinas.
Dive Deeper: Advanced Bolinas STR Market Data (2026)
Ready to unlock more insights? AirROI provides access to advanced metrics and comprehensive Airbnb data for Bolinas. Explore detailed analytics beyond this report to refine your investment strategy, optimize pricing, and maximize your vacation rental profits.
Explore Advanced MetricsBolinas Short-Term Rental Market Composition (2026): Property & Room Types
Room Type Distribution
Property Type Distribution
Market Composition Insights for Bolinas
- The Bolinas Airbnb market composition is heavily skewed towards Entire Home/Apt listings, which make up 87.8% of the 49 active rentals. This indicates strong guest preference for privacy and space.
- Looking at the property type distribution in Bolinas, House properties are the most common (65.3%), reflecting the local real estate landscape.
- Houses represent a significant 65.3% portion, catering likely to families or larger groups.
- The presence of 18.4% Hotel/Boutique listings indicates integration with traditional hospitality.
- Smaller segments like others, apartment/condo (combined 6.1%) offer potential for unique stay experiences.
Bolinas Airbnb Room Capacity Analysis (2026): Bedroom Distribution
Distribution of Listings by Number of Bedrooms
Room Capacity Insights for Bolinas
- The dominant room capacity in Bolinas is 1 bedroom listings, making up 38.8% of the market. This suggests a strong demand for properties suitable for couples or solo travelers.
- Together, 1 bedroom and 2 bedrooms properties represent 67.4% of the active Airbnb listings in Bolinas, indicating a high concentration in these sizes.
- A significant 26.5% of listings offer 3+ bedrooms, catering to larger groups and families seeking more space in Bolinas.
Bolinas Vacation Rental Guest Capacity Trends (2026)
Distribution of Listings by Guest Capacity
Guest Capacity Insights for Bolinas
- The most common guest capacity trend in Bolinas vacation rentals is listings accommodating 4 guests (34.7%). This suggests the primary traveler segment is likely small families or groups.
- Properties designed for 4 guests and 2 guests dominate the Bolinas STR market, accounting for 63.3% of listings.
- 30.5% of properties accommodate 6+ guests, serving the market segment for larger families or group travel in Bolinas.
- On average, properties in Bolinas are equipped to host 4.3 guests.
Bolinas Airbnb Booking Patterns (2026): Available vs. Booked Days
Available Days Distribution
Booked Days Distribution
Booking Pattern Insights for Bolinas
- The most common availability pattern in Bolinas falls within the 181-270 days range, representing 40.8% of listings. This suggests many properties have significant open periods on their calendars.
- Approximately 65.3% of listings show high availability (181+ days open annually), indicating potential for increased bookings or specific owner usage patterns.
- For booked days, the 91-180 days range is most frequent in Bolinas (42.9%), reflecting common guest stay durations or potential owner blocking patterns.
- A notable 34.7% of properties secure long booking periods (181+ days booked per year), highlighting successful long-term rental strategies or significant owner usage.
Bolinas Airbnb Minimum Stay Requirements Analysis
Distribution of Listings by Minimum Night Requirement
1 Night
12 listings
24.5% of total
2 Nights
15 listings
30.6% of total
3 Nights
5 listings
10.2% of total
7-29 Nights
3 listings
6.1% of total
30+ Nights
14 listings
28.6% of total
Key Insights
- The most prevalent minimum stay requirement in Bolinas is 2 Nights, adopted by 30.6% of listings. This highlights the market's preference for shorter, flexible bookings.
- A significant segment (28.6%) caters to monthly stays (30+ nights) in Bolinas, pointing to opportunities in the extended-stay market.
Recommendations
- Align with the market by considering a 2 Nights minimum stay, as 30.6% of Bolinas hosts use this setting.
- If feasible, allowing 1-night stays, especially midweek or during low season, could capture last-minute bookings, as only 24.5% currently do.
- Explore offering discounts for stays of 30+ nights to attract the 28.6% of the market seeking extended stays.
- Adjust minimum nights based on seasonality – potentially shorter during low season and longer during peak demand periods in Bolinas.
Bolinas Airbnb Cancellation Policy Trends Analysis (2026)
Super Strict 30 Days
2 listings
4.2% of total
Flexible
5 listings
10.4% of total
Moderate
8 listings
16.7% of total
Firm
26 listings
54.2% of total
Strict
7 listings
14.6% of total
Cancellation Policy Insights for Bolinas
- The prevailing Airbnb cancellation policy trend in Bolinas is Firm, used by 54.2% of listings.
- A majority (68.8%) of hosts in Bolinas utilize Firm or Strict policies, indicating a market where hosts prioritize booking security.
Recommendations for Hosts
- Consider adopting a Firm policy to align with the 54.2% market standard in Bolinas.
- Using a Strict policy might deter some guests, as only 14.6% of listings use it. Evaluate if potential revenue protection outweighs possible lower booking rates.
- Regularly review your cancellation policy against competitors and market demand shifts in Bolinas.
Bolinas STR Booking Lead Time Analysis (2026)
Average Booking Lead Time by Month
Booking Lead Time Insights for Bolinas
- The overall average booking lead time for vacation rentals in Bolinas is 45 days.
- Guests book furthest in advance for stays during August (average 71 days), likely coinciding with peak travel demand or local events.
- The shortest booking windows occur for stays in January (average 31 days), indicating more last-minute travel plans during this time.
- Seasonally, Summer (63 days avg.) sees the longest lead times, while Spring (38 days avg.) has the shortest, reflecting typical travel planning cycles.
Recommendations for Hosts
- Use the overall average lead time (45 days) as a baseline for your pricing and availability strategy in Bolinas.
- For August stays, consider implementing length-of-stay discounts or slightly higher rates for bookings made less than 71 days out to capitalize on advance planning.
- Target marketing efforts for the Summer season well in advance (at least 63 days) to capture early planners.
- Monitor your own booking lead times against these Bolinas averages to identify opportunities for dynamic pricing adjustments.
Popular & Essential Airbnb Amenities in Bolinas (2026)
Amenity Prevalence
Amenity Insights for Bolinas
- Essential amenities in Bolinas that guests expect include: Wifi, Smoke alarm. Lacking these (any) could significantly impact bookings.
- Popular amenities like Heating, Free parking on premises, Hot water are common but not universal. Offering these can provide a competitive edge.
Recommendations for Hosts
- Ensure your listing includes all essential amenities for Bolinas: Wifi, Smoke alarm.
- Prioritize adding missing essentials: Smoke alarm.
- Consider adding popular differentiators like Heating or Free parking on premises to increase appeal.
- Highlight unique or less common amenities you offer (e.g., hot tub, dedicated workspace, EV charger) in your listing description and photos.
- Regularly check competitor amenities in Bolinas to stay competitive.
Bolinas Airbnb Guest Demographics & Profile Analysis (2026)
Guest Profile Summary for Bolinas
- The typical guest profile for Airbnb in Bolinas consists of primarily domestic travelers (96%), often arriving from nearby San Francisco, typically belonging to the Post-2000s (Gen Z/Alpha) group (50%), primarily speaking English or Spanish.
- Domestic travelers account for 96.1% of guests.
- Key international markets include United States (96.1%) and United Kingdom (1.1%).
- Top languages spoken are English (55.9%) followed by Spanish (17.5%).
- A significant demographic segment is the Post-2000s (Gen Z/Alpha) group, representing 50% of guests.
Recommendations for Hosts
- Target domestic marketing efforts towards travelers from San Francisco and Oakland.
- Tailor amenities and listing descriptions to appeal to the dominant Post-2000s (Gen Z/Alpha) demographic (e.g., highlight fast WiFi, smart home features, local guides).
- Highlight unique local experiences or amenities relevant to the primary guest profile.
- Consider seasonal promotions aligned with peak travel times for key origin markets.
Nearby Short-Term Rental Market Comparison
How does the Bolinas Airbnb market stack up against its neighbors? Compare key performance metrics like average monthly revenue, ADR, and occupancy rates in surrounding areas to understand the broader regional STR landscape.
| Market | Active Properties | Monthly Revenue | Daily Rate | Avg. Occupancy |
|---|---|---|---|---|
| Carmel Point | 15 | $14,483 | $1046.17 | 54% |
| Del Monte Forest | 105 | $10,280 | $964.89 | 47% |
| Moss Beach | 34 | $10,092 | $676.91 | 53% |
| Sonoma | 228 | $9,647 | $819.87 | 43% |
| Marshall | 18 | $8,897 | $607.75 | 50% |
| St. Helena | 50 | $8,684 | $924.70 | 38% |
| Carmel-by-the-Sea | 305 | $8,657 | $680.02 | 49% |
| Kenwood | 60 | $8,643 | $810.83 | 41% |
| Glen Ellen | 85 | $8,482 | $799.53 | 43% |
| Eldridge | 21 | $8,410 | $930.61 | 41% |