Buellton Airbnb Market Analysis 2026: Short Term Rental Data & Vacation Rental Statistics in California, United States
Is Airbnb profitable in Buellton in 2026? Explore comprehensive Airbnb analytics for Buellton, California, United States to uncover income potential. This 2026 STR market report for Buellton, based on AirROI data from February 2025 to January 2026, reveals key trends in the niche market of 24 active listings.
Whether you're considering an Airbnb investment in Buellton, optimizing your existing vacation rental, or exploring rental arbitrage opportunities, understanding the Buellton Airbnb data is crucial. Leveraging the low regulation environment is key to maximizing your short term rental income potential. Let's dive into the specifics.
Key Buellton Airbnb Performance Metrics Overview
Monthly Airbnb Revenue Variations & Income Potential in Buellton (2026)
Understanding the monthly revenue variations for Airbnb listings in Buellton is key to maximizing your short term rental income potential. Seasonality significantly impacts earnings. Our analysis, based on data from the past 12 months, shows that the peak revenue month for STRs in Buellton is typically May, while September often presents the lowest earnings, highlighting opportunities for strategic pricing adjustments during shoulder and low seasons. Explore the typical Airbnb income in Buellton across different performance tiers:
- Best-in-class properties (Top 10%) achieve $10,429+ monthly, often utilizing dynamic pricing and superior guest experiences.
- Strong performing properties (Top 25%) earn $6,566 or more, indicating effective management and desirable locations/amenities.
- Typical properties (Median) generate around $3,680 per month, representing the average market performance.
- Entry-level properties (Bottom 25%) see earnings around $1,721, often with potential for optimization.
Average Monthly Airbnb Earnings Trend in Buellton
Buellton Airbnb Occupancy Rate Trends (2026)
Maximize your bookings by understanding the Buellton STR occupancy trends. Seasonal demand shifts significantly influence how often properties are booked. Typically, Decembersees the highest demand (peak season occupancy), while January experiences the lowest (low season). Effective strategies, like adjusting minimum stays or offering promotions, can boost occupancy during slower periods. Here's how different property tiers perform in Buellton:
- Best-in-class properties (Top 10%) achieve 70%+ occupancy, indicating high desirability and potentially optimized availability.
- Strong performing properties (Top 25%) maintain 55% or higher occupancy, suggesting good market fit and guest satisfaction.
- Typical properties (Median) have an occupancy rate around 36%.
- Entry-level properties (Bottom 25%) average 22% occupancy, potentially facing higher vacancy.
Average Monthly Occupancy Rate Trend in Buellton
Average Daily Rate (ADR) Airbnb Trends in Buellton (2026)
Effective short term rental pricing strategy in Buellton involves understanding monthly ADR fluctuations. The Average Daily Rate (ADR) for Airbnb in Buellton typically peaks in June and dips lowest during January. Leveraging Airbnb dynamic pricing tools or strategies based on this seasonality can significantly boost revenue. Here's a look at the typical nightly rates achieved:
- Best-in-class properties (Top 10%) command rates of $888+ per night, often due to premium features or locations.
- Strong performing properties (Top 25%) achieve nightly rates of $599 or more.
- Typical properties (Median) charge around $312 per night.
- Entry-level properties (Bottom 25%) earn around $196 per night.
Average Daily Rate (ADR) Trend by Month in Buellton
Get Live Buellton Market Intelligence 👇

Explore Real-time Analytics
Airbnb Seasonality Analysis & Trends in Buellton (2026)
Peak Season (May, August, November)
- Revenue averages $7,074 per month
- Occupancy rates average 42.2%
- Daily rates average $460
Shoulder Season
- Revenue averages $6,255 per month
- Occupancy maintains around 41.5%
- Daily rates hold near $463
Low Season (January, February, September)
- Revenue drops to average $4,870 per month
- Occupancy decreases to average 32.5%
- Daily rates adjust to average $439
Seasonality Insights for Buellton
- The Airbnb seasonality in Buellton shows moderate seasonality with distinct peak and low periods. While the sections above show seasonal averages, it's also insightful to look at the extremes:
- During the high season, the absolute peak month showcases Buellton's highest earning potential, with monthly revenues capable of climbing to $7,706, occupancy reaching a high of 46.3%, and ADRs peaking at $493.
- Conversely, the slowest single month of the year, typically falling within the low season, marks the market's lowest point. In this month, revenue might dip to $4,522, occupancy could drop to 24.5%, and ADRs may adjust down to $408.
- Understanding both the seasonal averages and these monthly peaks and troughs in revenue, occupancy, and ADR is crucial for maximizing your Airbnb profit potential in Buellton.
Seasonal Strategies for Maximizing Profit
- Peak Season: Maximize revenue through premium pricing and potentially longer minimum stays. Ensure high availability.
- Low Season: Offer competitive pricing, special promotions (e.g., extended stay discounts), and flexible cancellation policies. Target off-season travelers like remote workers or budget-conscious guests.
- Shoulder Seasons: Implement dynamic pricing that balances peak and low rates. Target weekend travelers or specific events. Offer slightly more flexible terms than peak season.
- Regularly analyze your own performance against these Buellton seasonality benchmarks and adjust your pricing and availability strategy accordingly.
Best Areas for Airbnb Investment in Buellton (2026)
Exploring the top neighborhoods for short-term rentals in Buellton? This section highlights key areas, outlining why they are attractive for hosts and guests, along with notable local attractions. Consider these locations based on your target guest profile and investment strategy.
| Neighborhood / Area | Why Host Here? (Target Guests & Appeal) | Key Attractions & Landmarks |
|---|---|---|
| Buellton City Center | Buellton's vibrant hub with restaurants and shops. Perfect for guests looking to explore local dining options and the nearby regions. | Buellton Park, The Hitching Post, Buellton Farmers Market, Fess Parker Winery, Mickey's New Zealand |
| Solvang | Charming Danish village close to Buellton, ideal for tourists seeking unique cultural experiences and picturesque scenery. | Solvang Windmill, Hans Christian Andersen Museum, Solvang Vintage Motorcycle Museum, Elverhoj Museum, Solvang Festival Theater |
| Los Olivos | A quaint town known for its wineries and art galleries, popular among wine enthusiasts and those looking for a serene getaway. | Los Olivos Tasting Room, Sunken Gardens, Fess Parker Winery & Vineyard, Wildling Museum, Jordan Winery |
| Santa Ynez | Close to Buellton, Santa Ynez offers a rustic charm with its wineries and rolling hills, ideal for those seeking a peaceful retreat. | Santa Ynez Valley Historical Museum, Fess Parker Winery, Sunken Gardens, Rideau Vineyard, Santa Ynez Valley Horseback |
| Ballard | A small community known for its beautiful landscapes and wine tasting, appealing to guests who appreciate quiet and nature. | Ballard Canyon, Ballard School, luxury wineries, Santa Ynez Valley., Ballard Art Gallery |
| Gaviota State Park | Natural beauty and outdoor activities attract travelers interested in hiking, camping, and enjoying the Pacific coastline. | Gaviota Beach, Hiking Trails, Fishing Spots, Picnic Areas, Scenic Views |
| Wine Country | The surrounding wine country is a major draw for tourists interested in wine tasting and vineyard experiences. | Numerous wineries, Wine tasting tours, Scenic vineyard views, Gourmet dining options, Culinary events |
| The Santa Barbara Coast | Just a short drive away, the scenic coastline is perfect for beachgoers and nature lovers, making it a desirable location for Airbnb. | Butterfly Beach, Santa Barbara Harbor, Stearns Wharf, Santa Barbara Mission, Montecito |
Understanding Airbnb License Requirements & STR Laws in Buellton (2026)
While Buellton, California, United States currently shows low STR regulations, specific Airbnb license requirements might still exist or change. Always verify the latest short term rental regulations and Airbnb license requirements directly with local government authorities for Buellton to ensure full compliance before hosting.
(Source: AirROI data, 2026, finding no licensed listings among those analyzed)
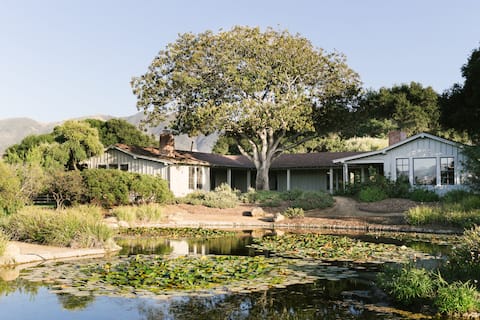
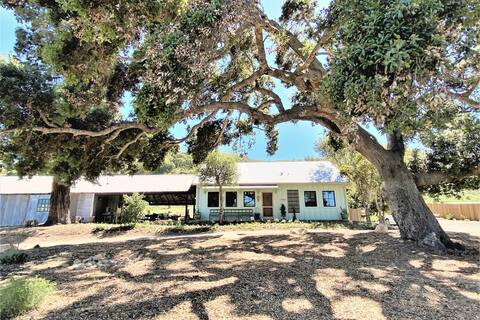
Top Performing Airbnb Properties in Buellton (2026)
Benchmark your potential! Explore examples of top-performing Airbnb properties in Buelltonbased on Trailing Twelve Month (TTM) revenue. Analyze their characteristics, revenue, occupancy rate, and ADR to understand what drives success in this market.
31 Day Classic California Ranch House Plus Cottage
Entire Place • 7 bedrooms

Highline Summit House
Entire Place • 4 bedrooms
The Ranch House In the Santa Ynez Valley
Entire Place • 3 bedrooms

Private pond & views of rolling green hills
Entire Place • 3 bedrooms
Three Dreamers Farm Stay Cottage
Entire Place • 3 bedrooms
Private Guest House on 10 Acres
Entire Place • 2 bedrooms
Note: Performance varies based on location, size, amenities, seasonality, and management quality. Data reflects the past 12 months.
Top Performing Airbnb Hosts in Buellton (2026)
Learn from the best! This table showcases top-performing Airbnb hosts in Buellton based on the number of properties managed and estimated total revenue over the past year. Analyze their scale and performance metrics.
| Host Name | Properties | Grossing Revenue | Stay Reviews | Avg Rating |
|---|---|---|---|---|
| Jordan | 3 | $464,036 | 188 | 4.94/5.0 |
| Jeff | 2 | $383,129 | 44 | 4.96/5.0 |
| Bobbie | 3 | $182,574 | 33 | 4.82/5.0 |
| Catherine | 3 | $159,203 | 353 | 4.96/5.0 |
| Jayla | 1 | $98,725 | 124 | 4.92/5.0 |
| Karen | 2 | $97,119 | 57 | 4.82/5.0 |
| Erin | 1 | $63,232 | 452 | 4.96/5.0 |
| Rick And Buffy | 1 | $56,530 | 101 | 5.00/5.0 |
| Hotel Hygge | 3 | $31,322 | 476 | 4.75/5.0 |
| Jacqui | 1 | $27,432 | 233 | 4.61/5.0 |
Analyzing the strategies of top hosts, such as their property selection, pricing, and guest communication, can offer valuable lessons for optimizing your own Airbnb operations in Buellton.
Dive Deeper: Advanced Buellton STR Market Data (2026)
Ready to unlock more insights? AirROI provides access to advanced metrics and comprehensive Airbnb data for Buellton. Explore detailed analytics beyond this report to refine your investment strategy, optimize pricing, and maximize your vacation rental profits.
Explore Advanced MetricsBuellton Short-Term Rental Market Composition (2026): Property & Room Types
Room Type Distribution
Property Type Distribution
Market Composition Insights for Buellton
- The Buellton Airbnb market composition is heavily skewed towards Entire Home/Apt listings, which make up 87.5% of the 24 active rentals. This indicates strong guest preference for privacy and space.
- Looking at the property type distribution in Buellton, House properties are the most common (50%), reflecting the local real estate landscape.
- Houses represent a significant 50% portion, catering likely to families or larger groups.
- The presence of 29.2% Hotel/Boutique listings indicates integration with traditional hospitality.
Buellton Airbnb Room Capacity Analysis (2026): Bedroom Distribution
Distribution of Listings by Number of Bedrooms
Room Capacity Insights for Buellton
- The dominant room capacity in Buellton is 2 bedrooms listings, making up 33.3% of the market. This suggests a strong demand for properties suitable for couples or solo travelers.
- Together, 2 bedrooms and 1 bedroom properties represent 62.5% of the active Airbnb listings in Buellton, indicating a high concentration in these sizes.
- A significant 33.3% of listings offer 3+ bedrooms, catering to larger groups and families seeking more space in Buellton.
Buellton Vacation Rental Guest Capacity Trends (2026)
Distribution of Listings by Guest Capacity
Guest Capacity Insights for Buellton
- The most common guest capacity trend in Buellton vacation rentals is listings accommodating 4 guests (29.2%). This suggests the primary traveler segment is likely small families or groups.
- Properties designed for 4 guests and 2 guests dominate the Buellton STR market, accounting for 54.2% of listings.
- 37.5% of properties accommodate 6+ guests, serving the market segment for larger families or group travel in Buellton.
- On average, properties in Buellton are equipped to host 4.5 guests.
Buellton Airbnb Booking Patterns (2026): Available vs. Booked Days
Available Days Distribution
Booked Days Distribution
Booking Pattern Insights for Buellton
- The most common availability pattern in Buellton falls within the 181-270 days range, representing 41.7% of listings. This suggests many properties have significant open periods on their calendars.
- Approximately 75.0% of listings show high availability (181+ days open annually), indicating potential for increased bookings or specific owner usage patterns.
- For booked days, the 91-180 days range is most frequent in Buellton (45.8%), reflecting common guest stay durations or potential owner blocking patterns.
- A notable 25.0% of properties secure long booking periods (181+ days booked per year), highlighting successful long-term rental strategies or significant owner usage.
Buellton Airbnb Minimum Stay Requirements Analysis
Distribution of Listings by Minimum Night Requirement
1 Night
4 listings
16.7% of total
2 Nights
16 listings
66.7% of total
7-29 Nights
2 listings
8.3% of total
30+ Nights
2 listings
8.3% of total
Key Insights
- The most prevalent minimum stay requirement in Buellton is 2 Nights, adopted by 66.7% of listings. This highlights the market's preference for shorter, flexible bookings.
- A strong majority (83.4%) of the Buellton Airbnb data shows acceptance of very short stays (1-2 nights), indicating a dynamic, high-turnover market.
Recommendations
- Align with the market by considering a 2 Nights minimum stay, as 66.7% of Buellton hosts use this setting.
- If feasible, allowing 1-night stays, especially midweek or during low season, could capture last-minute bookings, as only 16.7% currently do.
- A 2-night minimum appears standard (66.7%). Consider this for weekends or peak periods.
- Explore offering discounts for stays of 30+ nights to attract the 8.3% of the market seeking extended stays.
- Adjust minimum nights based on seasonality – potentially shorter during low season and longer during peak demand periods in Buellton.
Buellton Airbnb Cancellation Policy Trends Analysis (2026)
Flexible
5 listings
20.8% of total
Moderate
5 listings
20.8% of total
Firm
12 listings
50% of total
Strict
2 listings
8.3% of total
Cancellation Policy Insights for Buellton
- The prevailing Airbnb cancellation policy trend in Buellton is Firm, used by 50% of listings.
- A majority (58.3%) of hosts in Buellton utilize Firm or Strict policies, indicating a market where hosts prioritize booking security.
- Strict cancellation policies are quite rare (8.3%), potentially making listings with this policy less competitive unless justified by high demand or property type.
Recommendations for Hosts
- Consider adopting a Firm policy to align with the 50% market standard in Buellton.
- Using a Strict policy might deter some guests, as only 8.3% of listings use it. Evaluate if potential revenue protection outweighs possible lower booking rates.
- Regularly review your cancellation policy against competitors and market demand shifts in Buellton.
Buellton STR Booking Lead Time Analysis (2026)
Average Booking Lead Time by Month
Booking Lead Time Insights for Buellton
- The overall average booking lead time for vacation rentals in Buellton is 55 days.
- Guests book furthest in advance for stays during June (average 86 days), likely coinciding with peak travel demand or local events.
- The shortest booking windows occur for stays in January (average 23 days), indicating more last-minute travel plans during this time.
- Seasonally, Fall (66 days avg.) sees the longest lead times, while Winter (32 days avg.) has the shortest, reflecting typical travel planning cycles.
Recommendations for Hosts
- Use the overall average lead time (55 days) as a baseline for your pricing and availability strategy in Buellton.
- For June stays, consider implementing length-of-stay discounts or slightly higher rates for bookings made less than 86 days out to capitalize on advance planning.
- Target marketing efforts for the Fall season well in advance (at least 66 days) to capture early planners.
- Monitor your own booking lead times against these Buellton averages to identify opportunities for dynamic pricing adjustments.
Popular & Essential Airbnb Amenities in Buellton (2026)
Amenity Prevalence
Amenity Insights for Buellton
- Essential amenities in Buellton that guests expect include: Wifi, Free parking on premises, TV. Lacking these (any) could significantly impact bookings.
- Popular amenities like Hot water, Heating, Smoke alarm are common but not universal. Offering these can provide a competitive edge.
Recommendations for Hosts
- Ensure your listing includes all essential amenities for Buellton: Wifi, Free parking on premises, TV.
- Prioritize adding missing essentials: Free parking on premises, TV.
- Consider adding popular differentiators like Hot water or Heating to increase appeal.
- Highlight unique or less common amenities you offer (e.g., hot tub, dedicated workspace, EV charger) in your listing description and photos.
- Regularly check competitor amenities in Buellton to stay competitive.
Buellton Airbnb Guest Demographics & Profile Analysis (2026)
Guest Profile Summary for Buellton
- The typical guest profile for Airbnb in Buellton consists of primarily domestic travelers (94%), often arriving from nearby Los Angeles, typically belonging to the Post-2000s (Gen Z/Alpha) group (50%), primarily speaking English or Spanish.
- Domestic travelers account for 94.1% of guests.
- Key international markets include United States (94.1%) and Germany (2%).
- Top languages spoken are English (58.8%) followed by Spanish (16.5%).
- A significant demographic segment is the Post-2000s (Gen Z/Alpha) group, representing 50% of guests.
Recommendations for Hosts
- Target domestic marketing efforts towards travelers from Los Angeles and San Diego.
- Tailor amenities and listing descriptions to appeal to the dominant Post-2000s (Gen Z/Alpha) demographic (e.g., highlight fast WiFi, smart home features, local guides).
- Highlight unique local experiences or amenities relevant to the primary guest profile.
- Consider seasonal promotions aligned with peak travel times for key origin markets.
Nearby Short-Term Rental Market Comparison
How does the Buellton Airbnb market stack up against its neighbors? Compare key performance metrics like average monthly revenue, ADR, and occupancy rates in surrounding areas to understand the broader regional STR landscape.
| Market | Active Properties | Monthly Revenue | Daily Rate | Avg. Occupancy |
|---|---|---|---|---|
| Montecito | 127 | $10,744 | $950.35 | 51% |
| Los Olivos | 30 | $7,240 | $705.20 | 43% |
| Santa Ynez | 119 | $6,967 | $589.34 | 42% |
| Toro Canyon | 33 | $6,935 | $717.58 | 42% |
| Avila Beach | 94 | $6,770 | $582.34 | 41% |
| Summerland | 88 | $6,323 | $494.72 | 49% |
| Santa Paula | 17 | $5,685 | $502.58 | 47% |
| Santa Barbara | 1,001 | $5,642 | $447.90 | 49% |
| Mission Canyon | 34 | $5,270 | $385.19 | 57% |
| Carpinteria | 159 | $5,223 | $471.03 | 43% |