Carnelian Bay Airbnb Market Analysis 2026: Short Term Rental Data & Vacation Rental Statistics in California, United States
Is Airbnb profitable in Carnelian Bay in 2026? Explore comprehensive Airbnb analytics for Carnelian Bay, California, United States to uncover income potential. This 2026 STR market report for Carnelian Bay, based on AirROI data from February 2025 to January 2026, reveals key trends in the market of 349 active listings.
Whether you're considering an Airbnb investment in Carnelian Bay, optimizing your existing vacation rental, or exploring rental arbitrage opportunities, understanding the Carnelian Bay Airbnb data is crucial. Understanding the local regulations is key to maximizing your short term rental income potential. Let's dive into the specifics.
Key Carnelian Bay Airbnb Performance Metrics Overview
Monthly Airbnb Revenue Variations & Income Potential in Carnelian Bay (2026)
Understanding the monthly revenue variations for Airbnb listings in Carnelian Bay is key to maximizing your short term rental income potential. Seasonality significantly impacts earnings. Our analysis, based on data from the past 12 months, shows that the peak revenue month for STRs in Carnelian Bay is typically July, while November often presents the lowest earnings, highlighting opportunities for strategic pricing adjustments during shoulder and low seasons. Explore the typical Airbnb income in Carnelian Bay across different performance tiers:
- Best-in-class properties (Top 10%) achieve $13,217+ monthly, often utilizing dynamic pricing and superior guest experiences.
- Strong performing properties (Top 25%) earn $8,908 or more, indicating effective management and desirable locations/amenities.
- Typical properties (Median) generate around $5,377 per month, representing the average market performance.
- Entry-level properties (Bottom 25%) see earnings around $3,041, often with potential for optimization.
Average Monthly Airbnb Earnings Trend in Carnelian Bay
Carnelian Bay Airbnb Occupancy Rate Trends (2026)
Maximize your bookings by understanding the Carnelian Bay STR occupancy trends. Seasonal demand shifts significantly influence how often properties are booked. Typically, Julysees the highest demand (peak season occupancy), while November experiences the lowest (low season). Effective strategies, like adjusting minimum stays or offering promotions, can boost occupancy during slower periods. Here's how different property tiers perform in Carnelian Bay:
- Best-in-class properties (Top 10%) achieve 72%+ occupancy, indicating high desirability and potentially optimized availability.
- Strong performing properties (Top 25%) maintain 55% or higher occupancy, suggesting good market fit and guest satisfaction.
- Typical properties (Median) have an occupancy rate around 37%.
- Entry-level properties (Bottom 25%) average 21% occupancy, potentially facing higher vacancy.
Average Monthly Occupancy Rate Trend in Carnelian Bay
Average Daily Rate (ADR) Airbnb Trends in Carnelian Bay (2026)
Effective short term rental pricing strategy in Carnelian Bay involves understanding monthly ADR fluctuations. The Average Daily Rate (ADR) for Airbnb in Carnelian Bay typically peaks in December and dips lowest during April. Leveraging Airbnb dynamic pricing tools or strategies based on this seasonality can significantly boost revenue. Here's a look at the typical nightly rates achieved:
- Best-in-class properties (Top 10%) command rates of $852+ per night, often due to premium features or locations.
- Strong performing properties (Top 25%) achieve nightly rates of $595 or more.
- Typical properties (Median) charge around $455 per night.
- Entry-level properties (Bottom 25%) earn around $359 per night.
Average Daily Rate (ADR) Trend by Month in Carnelian Bay
Get Live Carnelian Bay Market Intelligence 👇

Explore Real-time Analytics
Airbnb Seasonality Analysis & Trends in Carnelian Bay (2026)
Peak Season (July, August, June)
- Revenue averages $10,543 per month
- Occupancy rates average 55.2%
- Daily rates average $589
Shoulder Season
- Revenue averages $6,482 per month
- Occupancy maintains around 36.4%
- Daily rates hold near $560
Low Season (April, October, November)
- Revenue drops to average $4,686 per month
- Occupancy decreases to average 29.9%
- Daily rates adjust to average $521
Seasonality Insights for Carnelian Bay
- The Airbnb seasonality in Carnelian Bay shows highly seasonal trends requiring careful strategy. While the sections above show seasonal averages, it's also insightful to look at the extremes:
- During the high season, the absolute peak month showcases Carnelian Bay's highest earning potential, with monthly revenues capable of climbing to $12,987, occupancy reaching a high of 65.5%, and ADRs peaking at $637.
- Conversely, the slowest single month of the year, typically falling within the low season, marks the market's lowest point. In this month, revenue might dip to $4,354, occupancy could drop to 27.0%, and ADRs may adjust down to $508.
- Understanding both the seasonal averages and these monthly peaks and troughs in revenue, occupancy, and ADR is crucial for maximizing your Airbnb profit potential in Carnelian Bay.
Seasonal Strategies for Maximizing Profit
- Peak Season: Maximize revenue through premium pricing and potentially longer minimum stays. Ensure high availability.
- Low Season: Offer competitive pricing, special promotions (e.g., extended stay discounts), and flexible cancellation policies. Target off-season travelers like remote workers or budget-conscious guests.
- Shoulder Seasons: Implement dynamic pricing that balances peak and low rates. Target weekend travelers or specific events. Offer slightly more flexible terms than peak season.
- Regularly analyze your own performance against these Carnelian Bay seasonality benchmarks and adjust your pricing and availability strategy accordingly.
Best Areas for Airbnb Investment in Carnelian Bay (2026)
Exploring the top neighborhoods for short-term rentals in Carnelian Bay? This section highlights key areas, outlining why they are attractive for hosts and guests, along with notable local attractions. Consider these locations based on your target guest profile and investment strategy.
| Neighborhood / Area | Why Host Here? (Target Guests & Appeal) | Key Attractions & Landmarks |
|---|---|---|
| North Lake Tahoe | Beautiful lake views and endless outdoor activities make this area popular among tourists year-round. Perfect for those who enjoy skiing in winter and water sports in summer. | Lake Tahoe, Northstar California Resort, Tahoe City, Kings Beach, Sand Harbor |
| Carnelian Bay | A charming community with great lake access and scenic views, ideal for those looking for a quiet retreat. Close to outdoor activities like hiking and biking. | Carnelian Bay Beach, Tahoe Rim Trail, Public Beaches, Water sports rentals, Scenic Boat Tours |
| Tahoe Vista | This area offers stunning views and close proximity to attractions, making it appealing for families and nature lovers. The peaceful atmosphere attracts a variety of guests. | North Tahoe Regional Park, Tahoe Vista Beach, Bike Trails, Fishing Adventures |
| Kings Beach | A vibrant beach community with a lively atmosphere, perfect for families and groups looking for fun in the sun. Hosts numerous events and festivals throughout the year. | Kings Beach State Recreation Area, North Shore Beaches, Local restaurants and shops, Summer Music Festival |
| Incline Village | This area is known for its upscale properties and amenities. Attracts couples and families looking for luxury accommodations and beautiful surroundings. | Diamond Peak Ski Resort, Crystal Bay Club Casino, Lake Tahoe Golf Course, Incline Beach |
| Truckee | A historic town with a charming downtown and access to outdoor recreation. Popular with tourists who want a mix of shopping, dining, and adventure. | Historic Downtown Truckee, Donner Memorial State Park, Lake Donner, Northstar California Resort |
| Stateline | Located near the Nevada border, this area offers a mix of outdoor and entertainment options, including casinos for those seeking nightlife. | Heavenly Mountain Resort, South Lake Tahoe, Casinos, Lake Tahoe Cruises |
| South Lake Tahoe | A bustling area with a variety of attractions, shopping, and dining. Ideal for tourists seeking both relaxation and adventure. | Heavenly Ski Resort, Lake Tahoe's Beaches, Shopping and Nightlife, Mount Tallac Trail |
Understanding Airbnb License Requirements & STR Laws in Carnelian Bay (2026)
With 15% of listings showing registration in 2026, understanding potential Airbnb license requirements is crucial in Carnelian Bay. Always verify the latest short term rental regulations and Airbnb license requirements directly with local government authorities for Carnelian Bay to ensure full compliance before hosting.
(Source: AirROI data, 2026, based on 15% licensed listings)
Top Performing Airbnb Properties in Carnelian Bay (2026)
Benchmark your potential! Explore examples of top-performing Airbnb properties in Carnelian Baybased on Trailing Twelve Month (TTM) revenue. Analyze their characteristics, revenue, occupancy rate, and ADR to understand what drives success in this market.
Villa Bella North Lake Tahoe Luxe02
Entire Place • 7 bedrooms
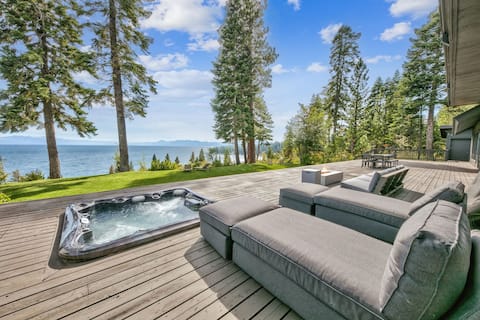
Pet Friendly | Hot Tub | Lake Tahoe | Game Room
Entire Place • 6 bedrooms
Gorgeous Luxury Home, Buoy, Hot Tub (Summerhouse)
Entire Place • 5 bedrooms
Timberline by AvantStay | 2min to Lake w/ Hot Tub
Entire Place • 5 bedrooms

Modern Mountain Luxury Retreat: Hot Tub & Grill
Entire Place • 5 bedrooms
Lakefront | Private Dock | Near Palisades Resort
Entire Place • 3 bedrooms
Note: Performance varies based on location, size, amenities, seasonality, and management quality. Data reflects the past 12 months.
Top Performing Airbnb Hosts in Carnelian Bay (2026)
Learn from the best! This table showcases top-performing Airbnb hosts in Carnelian Bay based on the number of properties managed and estimated total revenue over the past year. Analyze their scale and performance metrics.
| Host Name | Properties | Grossing Revenue | Stay Reviews | Avg Rating |
|---|---|---|---|---|
| Agate Bay Realty | 26 | $1,825,902 | 2416 | 4.70/5.0 |
| Tahoe Luxury Properties | 15 | $1,755,580 | 234 | 4.90/5.0 |
| LocalVR Tahoe | 23 | $1,636,934 | 1355 | 4.68/5.0 |
| Tahoe Getaways LLC | 23 | $1,615,021 | 627 | 4.70/5.0 |
| Agate Bay | 21 | $980,299 | 948 | 4.75/5.0 |
| Luxe | 1 | $970,571 | 34 | 4.85/5.0 |
| Tahoe Truckee Vacation | 11 | $687,239 | 153 | 4.60/5.0 |
| Tahoe Rental | 15 | $637,612 | 155 | 4.73/5.0 |
| First Accommodations | 25 | $592,096 | 1157 | 4.65/5.0 |
| Tahoe NORTH Rentals | 9 | $545,352 | 304 | 4.50/5.0 |
Analyzing the strategies of top hosts, such as their property selection, pricing, and guest communication, can offer valuable lessons for optimizing your own Airbnb operations in Carnelian Bay.
Dive Deeper: Advanced Carnelian Bay STR Market Data (2026)
Ready to unlock more insights? AirROI provides access to advanced metrics and comprehensive Airbnb data for Carnelian Bay. Explore detailed analytics beyond this report to refine your investment strategy, optimize pricing, and maximize your vacation rental profits.
Explore Advanced MetricsCarnelian Bay Short-Term Rental Market Composition (2026): Property & Room Types
Room Type Distribution
Property Type Distribution
Market Composition Insights for Carnelian Bay
- The Carnelian Bay Airbnb market composition is heavily skewed towards Entire Home/Apt listings, which make up 99.7% of the 349 active rentals. This indicates strong guest preference for privacy and space.
- Looking at the property type distribution in Carnelian Bay, House properties are the most common (67%), reflecting the local real estate landscape.
- Houses represent a significant 67% portion, catering likely to families or larger groups.
- Smaller segments like others, hotel/boutique (combined 2.2%) offer potential for unique stay experiences.
Carnelian Bay Airbnb Room Capacity Analysis (2026): Bedroom Distribution
Distribution of Listings by Number of Bedrooms
Room Capacity Insights for Carnelian Bay
- The dominant room capacity in Carnelian Bay is 3 bedrooms listings, making up 37% of the market. This suggests a strong demand for properties suitable for families or small groups.
- Together, 3 bedrooms and 4 bedrooms properties represent 69.1% of the active Airbnb listings in Carnelian Bay, indicating a high concentration in these sizes.
- A significant 78.6% of listings offer 3+ bedrooms, catering to larger groups and families seeking more space in Carnelian Bay.
Carnelian Bay Vacation Rental Guest Capacity Trends (2026)
Distribution of Listings by Guest Capacity
Guest Capacity Insights for Carnelian Bay
- The most common guest capacity trend in Carnelian Bay vacation rentals is listings accommodating 8+ guests (63.3%). This suggests the primary traveler segment is likely larger groups.
- Properties designed for 8+ guests and 6 guests dominate the Carnelian Bay STR market, accounting for 79.3% of listings.
- 85.6% of properties accommodate 6+ guests, serving the market segment for larger families or group travel in Carnelian Bay.
- On average, properties in Carnelian Bay are equipped to host 7.0 guests.
Carnelian Bay Airbnb Booking Patterns (2026): Available vs. Booked Days
Available Days Distribution
Booked Days Distribution
Booking Pattern Insights for Carnelian Bay
- The most common availability pattern in Carnelian Bay falls within the 271-366 days range, representing 43.3% of listings. This suggests many properties have significant open periods on their calendars.
- Approximately 86.0% of listings show high availability (181+ days open annually), indicating potential for increased bookings or specific owner usage patterns.
- For booked days, the 91-180 days range is most frequent in Carnelian Bay (43%), reflecting common guest stay durations or potential owner blocking patterns.
- A notable 14.9% of properties secure long booking periods (181+ days booked per year), highlighting successful long-term rental strategies or significant owner usage.
Carnelian Bay Airbnb Minimum Stay Requirements Analysis
Distribution of Listings by Minimum Night Requirement
1 Night
12 listings
3.4% of total
2 Nights
85 listings
24.4% of total
3 Nights
18 listings
5.2% of total
4-6 Nights
9 listings
2.6% of total
7-29 Nights
6 listings
1.7% of total
30+ Nights
219 listings
62.8% of total
Key Insights
- The most prevalent minimum stay requirement in Carnelian Bay is 30+ Nights, adopted by 62.8% of listings. This highlights the market's preference for longer commitments.
- A significant segment (62.8%) caters to monthly stays (30+ nights) in Carnelian Bay, pointing to opportunities in the extended-stay market.
Recommendations
- Align with the market by considering a 30+ Nights minimum stay, as 62.8% of Carnelian Bay hosts use this setting.
- If feasible, allowing 1-night stays, especially midweek or during low season, could capture last-minute bookings, as only 3.4% currently do.
- Explore offering discounts for stays of 30+ nights to attract the 62.8% of the market seeking extended stays.
- Adjust minimum nights based on seasonality – potentially shorter during low season and longer during peak demand periods in Carnelian Bay.
Carnelian Bay Airbnb Cancellation Policy Trends Analysis (2026)
Super Strict 30 Days
42 listings
12.1% of total
Super Strict 60 Days
18 listings
5.2% of total
Limited
2 listings
0.6% of total
Flexible
6 listings
1.7% of total
Moderate
26 listings
7.5% of total
Firm
207 listings
59.5% of total
Strict
47 listings
13.5% of total
Cancellation Policy Insights for Carnelian Bay
- The prevailing Airbnb cancellation policy trend in Carnelian Bay is Firm, used by 59.5% of listings.
- A majority (73.0%) of hosts in Carnelian Bay utilize Firm or Strict policies, indicating a market where hosts prioritize booking security.
Recommendations for Hosts
- Consider adopting a Firm policy to align with the 59.5% market standard in Carnelian Bay.
- Using a Strict policy might deter some guests, as only 13.5% of listings use it. Evaluate if potential revenue protection outweighs possible lower booking rates.
- Regularly review your cancellation policy against competitors and market demand shifts in Carnelian Bay.
Carnelian Bay STR Booking Lead Time Analysis (2026)
Average Booking Lead Time by Month
Booking Lead Time Insights for Carnelian Bay
- The overall average booking lead time for vacation rentals in Carnelian Bay is 54 days.
- Guests book furthest in advance for stays during July (average 80 days), likely coinciding with peak travel demand or local events.
- The shortest booking windows occur for stays in March (average 36 days), indicating more last-minute travel plans during this time.
- Seasonally, Summer (70 days avg.) sees the longest lead times, while Spring (45 days avg.) has the shortest, reflecting typical travel planning cycles.
Recommendations for Hosts
- Use the overall average lead time (54 days) as a baseline for your pricing and availability strategy in Carnelian Bay.
- For July stays, consider implementing length-of-stay discounts or slightly higher rates for bookings made less than 80 days out to capitalize on advance planning.
- Target marketing efforts for the Summer season well in advance (at least 70 days) to capture early planners.
- Monitor your own booking lead times against these Carnelian Bay averages to identify opportunities for dynamic pricing adjustments.
Popular & Essential Airbnb Amenities in Carnelian Bay (2026)
Amenity Prevalence
Amenity Insights for Carnelian Bay
- Essential amenities in Carnelian Bay that guests expect include: Wifi, Heating, Smoke alarm, Carbon monoxide alarm, Kitchen, Free parking on premises, Coffee maker, TV, Hot water, Washer. Lacking these (any) could significantly impact bookings.
Recommendations for Hosts
- Ensure your listing includes all essential amenities for Carnelian Bay: Wifi, Heating, Smoke alarm, Carbon monoxide alarm, Kitchen, Free parking on premises, Coffee maker, TV, Hot water, Washer.
- Prioritize adding missing essentials: Heating, Smoke alarm, Carbon monoxide alarm, Kitchen, Free parking on premises, Coffee maker, TV, Hot water, Washer.
- Highlight unique or less common amenities you offer (e.g., hot tub, dedicated workspace, EV charger) in your listing description and photos.
- Regularly check competitor amenities in Carnelian Bay to stay competitive.
Carnelian Bay Airbnb Guest Demographics & Profile Analysis (2026)
Guest Profile Summary for Carnelian Bay
- The typical guest profile for Airbnb in Carnelian Bay consists of primarily domestic travelers (96%), often arriving from nearby San Francisco, typically belonging to the Post-2000s (Gen Z/Alpha) group (50%), primarily speaking English or Spanish.
- Domestic travelers account for 95.6% of guests.
- Key international markets include United States (95.6%) and United Kingdom (0.6%).
- Top languages spoken are English (61%) followed by Spanish (15.5%).
- A significant demographic segment is the Post-2000s (Gen Z/Alpha) group, representing 50% of guests.
Recommendations for Hosts
- Target domestic marketing efforts towards travelers from San Francisco and Los Angeles.
- Tailor amenities and listing descriptions to appeal to the dominant Post-2000s (Gen Z/Alpha) demographic (e.g., highlight fast WiFi, smart home features, local guides).
- Highlight unique local experiences or amenities relevant to the primary guest profile.
- Consider seasonal promotions aligned with peak travel times for key origin markets.
Nearby Short-Term Rental Market Comparison
How does the Carnelian Bay Airbnb market stack up against its neighbors? Compare key performance metrics like average monthly revenue, ADR, and occupancy rates in surrounding areas to understand the broader regional STR landscape.
| Market | Active Properties | Monthly Revenue | Daily Rate | Avg. Occupancy |
|---|---|---|---|---|
| Zephyr Cove | 192 | $6,404 | $642.42 | 37% |
| Homewood | 150 | $5,842 | $595.57 | 40% |
| Meyers | 177 | $5,840 | $500.97 | 43% |
| Glenbrook | 32 | $5,788 | $841.74 | 35% |
| Incline Village-Crystal Bay | 204 | $5,197 | $589.54 | 35% |
| Tahoma | 199 | $5,011 | $605.47 | 36% |
| Lake Almanor Country Club | 18 | $4,873 | $556.22 | 44% |
| Tahoe Vista | 233 | $4,606 | $480.30 | 38% |
| Tahoe City | 792 | $4,449 | $539.47 | 36% |
| Kings Beach | 451 | $4,427 | $470.97 | 38% |