Del Mar Airbnb Market Analysis 2026: Short Term Rental Data & Vacation Rental Statistics in California, United States
Is Airbnb profitable in Del Mar in 2026? Explore comprehensive Airbnb analytics for Del Mar, California, United States to uncover income potential. This 2026 STR market report for Del Mar, based on AirROI data from February 2025 to January 2026, reveals key trends in the niche market of 128 active listings.
Whether you're considering an Airbnb investment in Del Mar, optimizing your existing vacation rental, or exploring rental arbitrage opportunities, understanding the Del Mar Airbnb data is crucial. Leveraging the low regulation environment is key to maximizing your short term rental income potential. Let's dive into the specifics.
Key Del Mar Airbnb Performance Metrics Overview
Monthly Airbnb Revenue Variations & Income Potential in Del Mar (2026)
Understanding the monthly revenue variations for Airbnb listings in Del Mar is key to maximizing your short term rental income potential. Seasonality significantly impacts earnings. Our analysis, based on data from the past 12 months, shows that the peak revenue month for STRs in Del Mar is typically July, while January often presents the lowest earnings, highlighting opportunities for strategic pricing adjustments during shoulder and low seasons. Explore the typical Airbnb income in Del Mar across different performance tiers:
- Best-in-class properties (Top 10%) achieve $20,340+ monthly, often utilizing dynamic pricing and superior guest experiences.
- Strong performing properties (Top 25%) earn $13,285 or more, indicating effective management and desirable locations/amenities.
- Typical properties (Median) generate around $7,799 per month, representing the average market performance.
- Entry-level properties (Bottom 25%) see earnings around $4,150, often with potential for optimization.
Average Monthly Airbnb Earnings Trend in Del Mar
Del Mar Airbnb Occupancy Rate Trends (2026)
Maximize your bookings by understanding the Del Mar STR occupancy trends. Seasonal demand shifts significantly influence how often properties are booked. Typically, Augustsees the highest demand (peak season occupancy), while January experiences the lowest (low season). Effective strategies, like adjusting minimum stays or offering promotions, can boost occupancy during slower periods. Here's how different property tiers perform in Del Mar:
- Best-in-class properties (Top 10%) achieve 82%+ occupancy, indicating high desirability and potentially optimized availability.
- Strong performing properties (Top 25%) maintain 68% or higher occupancy, suggesting good market fit and guest satisfaction.
- Typical properties (Median) have an occupancy rate around 49%.
- Entry-level properties (Bottom 25%) average 27% occupancy, potentially facing higher vacancy.
Average Monthly Occupancy Rate Trend in Del Mar
Average Daily Rate (ADR) Airbnb Trends in Del Mar (2026)
Effective short term rental pricing strategy in Del Mar involves understanding monthly ADR fluctuations. The Average Daily Rate (ADR) for Airbnb in Del Mar typically peaks in July and dips lowest during February. Leveraging Airbnb dynamic pricing tools or strategies based on this seasonality can significantly boost revenue. Here's a look at the typical nightly rates achieved:
- Best-in-class properties (Top 10%) command rates of $1,181+ per night, often due to premium features or locations.
- Strong performing properties (Top 25%) achieve nightly rates of $784 or more.
- Typical properties (Median) charge around $518 per night.
- Entry-level properties (Bottom 25%) earn around $296 per night.
Average Daily Rate (ADR) Trend by Month in Del Mar
Get Live Del Mar Market Intelligence 👇

Explore Real-time Analytics
Airbnb Seasonality Analysis & Trends in Del Mar (2026)
Peak Season (July, August, June)
- Revenue averages $15,365 per month
- Occupancy rates average 60.7%
- Daily rates average $701
Shoulder Season
- Revenue averages $8,797 per month
- Occupancy maintains around 46.4%
- Daily rates hold near $631
Low Season (January, February, November)
- Revenue drops to average $7,080 per month
- Occupancy decreases to average 39.3%
- Daily rates adjust to average $614
Seasonality Insights for Del Mar
- The Airbnb seasonality in Del Mar shows highly seasonal trends requiring careful strategy. While the sections above show seasonal averages, it's also insightful to look at the extremes:
- During the high season, the absolute peak month showcases Del Mar's highest earning potential, with monthly revenues capable of climbing to $16,864, occupancy reaching a high of 63.3%, and ADRs peaking at $723.
- Conversely, the slowest single month of the year, typically falling within the low season, marks the market's lowest point. In this month, revenue might dip to $5,997, occupancy could drop to 31.1%, and ADRs may adjust down to $583.
- Understanding both the seasonal averages and these monthly peaks and troughs in revenue, occupancy, and ADR is crucial for maximizing your Airbnb profit potential in Del Mar.
Seasonal Strategies for Maximizing Profit
- Peak Season: Maximize revenue through premium pricing and potentially longer minimum stays. Ensure high availability.
- Low Season: Offer competitive pricing, special promotions (e.g., extended stay discounts), and flexible cancellation policies. Target off-season travelers like remote workers or budget-conscious guests.
- Shoulder Seasons: Implement dynamic pricing that balances peak and low rates. Target weekend travelers or specific events. Offer slightly more flexible terms than peak season.
- Regularly analyze your own performance against these Del Mar seasonality benchmarks and adjust your pricing and availability strategy accordingly.
Best Areas for Airbnb Investment in Del Mar (2026)
Exploring the top neighborhoods for short-term rentals in Del Mar? This section highlights key areas, outlining why they are attractive for hosts and guests, along with notable local attractions. Consider these locations based on your target guest profile and investment strategy.
| Neighborhood / Area | Why Host Here? (Target Guests & Appeal) | Key Attractions & Landmarks |
|---|---|---|
| Del Mar Beach | Stunning seaside location known for its beautiful beaches and upscale community. Perfect for tourists looking to relax by the ocean and enjoy water activities. | Del Mar Main Beach, Powerhouse Park, Seagrove Park, Dog Beach, Del Mar Plaza |
| Riviera Shores | A charming coastal neighborhood offering a peaceful beach atmosphere. Ideal for families and visitors seeking a more tranquil getaway. | Riviera Beach, Torrey Pines State Reserve, Del Mar Fairgrounds, Reach the Beach trail, Riding the Del Mar beach |
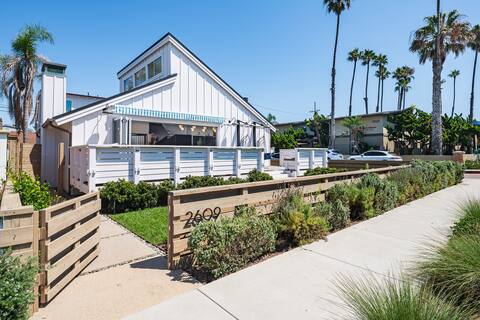
| Del Mar Village | The historic heart of Del Mar, with boutique shops, fine dining, and a vibrant community feel. Attracts visitors looking for a quaint yet lively experience. | L'Auberge Del Mar, Del Mar Plaza, Local art galleries, The Del Mar Racetrack, Wonderful shopping and dining options |
| Carmel Valley | A nearby upscale residential area known for its family-friendly environment and proximity to beaches, attracting guests looking for spacious rentals close to attractions. | Carmel Valley Community Park, Del Mar Highlands Town Center, Torrey Pines Golf Course, Carmel Valley Trail, Local Vineyards |
| Sorrento Valley | A business-friendly neighborhood with many corporate offices. Appeals to business travelers attending conferences or those looking for a convenient location near major routes. | Sorrento Valley Park, Sorrento Valley Business Center, Torrey Pines State Natural Reserve, La Jolla Cove nearby, Dining options in the area |
| Solana Beach | Adjacent to Del Mar, this beach town is popular for its beautiful coastline and artsy vibe. Attracts surfers and beachgoers looking for a laid-back atmosphere. | Fletcher Cove Park, Cedros Avenue Design District, Solana Beach Surfing Spots, Nature preserves, Local restaurants |
| La Jolla | A picturesque coastal community known for its stunning scenery and high-end shopping and eating. Appeals to luxury travelers seeking exquisite experiences. | La Jolla Cove, Torrey Pines State Beach, La Jolla Shores, The Birch Aquarium, Gelato Shops |
| Encinitas | A coastal town with a relaxed vibe and beautiful beaches. Perfect for hosting travelers who enjoy yoga, surfing, and a welcoming arts scene. | Moonlight Beach, Swami's Beach, Encinitas Botanical Garden, Yoga studios, Local surf shops |
Understanding Airbnb License Requirements & STR Laws in Del Mar (2026)
While Del Mar, California, United States currently shows low STR regulations, specific Airbnb license requirements might still exist or change. Always verify the latest short term rental regulations and Airbnb license requirements directly with local government authorities for Del Mar to ensure full compliance before hosting.
(Source: AirROI data, 2026, based on 9% licensed listings)
Top Performing Airbnb Properties in Del Mar (2026)
Benchmark your potential! Explore examples of top-performing Airbnb properties in Del Marbased on Trailing Twelve Month (TTM) revenue. Analyze their characteristics, revenue, occupancy rate, and ADR to understand what drives success in this market.

Oceanfront Home Del Mar Beach!
Entire Place • 4 bedrooms

A Slice of Heaven near Rancho Santa Fe
Entire Place • 4 bedrooms
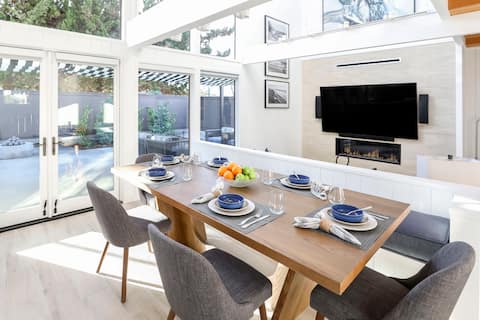
Beautifully Remodeled 3 Bedroom Beach Estate
Entire Place • 3 bedrooms
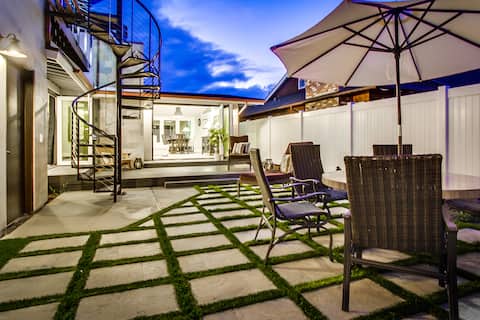
Surf meets Turf
Entire Place • 5 bedrooms
Seaside Sty
Entire Place • 3 bedrooms
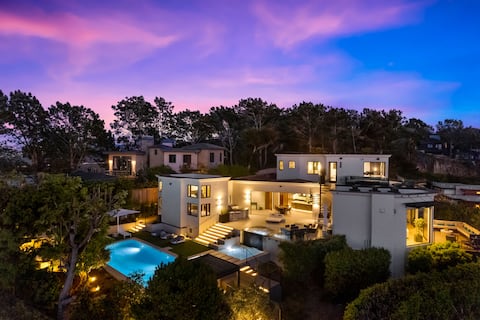
The Del Mar Hilltop Oceanview Resort Mansion
Entire Place • 5 bedrooms
Note: Performance varies based on location, size, amenities, seasonality, and management quality. Data reflects the past 12 months.
Top Performing Airbnb Hosts in Del Mar (2026)
Learn from the best! This table showcases top-performing Airbnb hosts in Del Mar based on the number of properties managed and estimated total revenue over the past year. Analyze their scale and performance metrics.
| Host Name | Properties | Grossing Revenue | Stay Reviews | Avg Rating |
|---|---|---|---|---|
| Kimberly | 15 | $1,952,079 | 875 | 4.76/5.0 |
| Nina | 10 | $1,367,580 | 273 | 4.91/5.0 |
| Gina | 8 | $879,140 | 445 | 4.96/5.0 |
| Brenda | 8 | $821,538 | 874 | 4.94/5.0 |
| DM Beach Hotel | 3 | $749,002 | 193 | 4.98/5.0 |
| Noel & Linda | 3 | $530,207 | 348 | 4.89/5.0 |
| Sharon | 3 | $352,124 | 13 | 4.86/5.0 |
| Jennifer | 1 | $259,270 | 14 | 5.00/5.0 |
| Susie | 2 | $228,999 | 497 | 4.83/5.0 |
| Deborah | 3 | $211,571 | 318 | 4.74/5.0 |
Analyzing the strategies of top hosts, such as their property selection, pricing, and guest communication, can offer valuable lessons for optimizing your own Airbnb operations in Del Mar.
Dive Deeper: Advanced Del Mar STR Market Data (2026)
Ready to unlock more insights? AirROI provides access to advanced metrics and comprehensive Airbnb data for Del Mar. Explore detailed analytics beyond this report to refine your investment strategy, optimize pricing, and maximize your vacation rental profits.
Explore Advanced MetricsDel Mar Short-Term Rental Market Composition (2026): Property & Room Types
Room Type Distribution
Property Type Distribution
Market Composition Insights for Del Mar
- The Del Mar Airbnb market composition is heavily skewed towards Entire Home/Apt listings, which make up 93% of the 128 active rentals. This indicates strong guest preference for privacy and space.
- Looking at the property type distribution in Del Mar, House properties are the most common (60.2%), reflecting the local real estate landscape.
- Houses represent a significant 60.2% portion, catering likely to families or larger groups.
- Smaller segments like hotel/boutique, outdoor/unique, others (combined 5.5%) offer potential for unique stay experiences.
Del Mar Airbnb Room Capacity Analysis (2026): Bedroom Distribution
Distribution of Listings by Number of Bedrooms
Room Capacity Insights for Del Mar
- The dominant room capacity in Del Mar is 3 bedrooms listings, making up 27.3% of the market. This suggests a strong demand for properties suitable for families or small groups.
- Together, 3 bedrooms and 2 bedrooms properties represent 50.7% of the active Airbnb listings in Del Mar, indicating a high concentration in these sizes.
- A significant 47.7% of listings offer 3+ bedrooms, catering to larger groups and families seeking more space in Del Mar.
Del Mar Vacation Rental Guest Capacity Trends (2026)
Distribution of Listings by Guest Capacity
Guest Capacity Insights for Del Mar
- The most common guest capacity trend in Del Mar vacation rentals is listings accommodating 8+ guests (25.8%). This suggests the primary traveler segment is likely larger groups.
- Properties designed for 8+ guests and 4 guests dominate the Del Mar STR market, accounting for 48.5% of listings.
- 54.7% of properties accommodate 6+ guests, serving the market segment for larger families or group travel in Del Mar.
- On average, properties in Del Mar are equipped to host 5.3 guests.
Del Mar Airbnb Booking Patterns (2026): Available vs. Booked Days
Available Days Distribution
Booked Days Distribution
Booking Pattern Insights for Del Mar
- The most common availability pattern in Del Mar falls within the 271-366 days range, representing 42.2% of listings. This suggests many properties have significant open periods on their calendars.
- Approximately 71.1% of listings show high availability (181+ days open annually), indicating potential for increased bookings or specific owner usage patterns.
- For booked days, the 91-180 days range is most frequent in Del Mar (28.9%), reflecting common guest stay durations or potential owner blocking patterns.
- A notable 31.2% of properties secure long booking periods (181+ days booked per year), highlighting successful long-term rental strategies or significant owner usage.
Del Mar Airbnb Minimum Stay Requirements Analysis
Distribution of Listings by Minimum Night Requirement
1 Night
8 listings
6.3% of total
2 Nights
14 listings
10.9% of total
3 Nights
5 listings
3.9% of total
4-6 Nights
32 listings
25% of total
7-29 Nights
13 listings
10.2% of total
30+ Nights
56 listings
43.8% of total
Key Insights
- The most prevalent minimum stay requirement in Del Mar is 30+ Nights, adopted by 43.8% of listings. This highlights the market's preference for longer commitments.
- Very short stays (1-2 nights) are less common (17.2%), suggesting hosts prefer slightly longer bookings to optimize turnover.
- A significant segment (43.8%) caters to monthly stays (30+ nights) in Del Mar, pointing to opportunities in the extended-stay market.
Recommendations
- Align with the market by considering a 30+ Nights minimum stay, as 43.8% of Del Mar hosts use this setting.
- If feasible, allowing 1-night stays, especially midweek or during low season, could capture last-minute bookings, as only 6.3% currently do.
- Explore offering discounts for stays of 30+ nights to attract the 43.8% of the market seeking extended stays.
- Adjust minimum nights based on seasonality – potentially shorter during low season and longer during peak demand periods in Del Mar.
Del Mar Airbnb Cancellation Policy Trends Analysis (2026)
Super Strict 60 Days
2 listings
1.6% of total
Refundable
2 listings
1.6% of total
Limited
2 listings
1.6% of total
Non-refundable
1 listings
0.8% of total
Super Strict 30 Days
15 listings
11.7% of total
Flexible
13 listings
10.2% of total
Moderate
9 listings
7% of total
Firm
59 listings
46.1% of total
Strict
25 listings
19.5% of total
Cancellation Policy Insights for Del Mar
- The prevailing Airbnb cancellation policy trend in Del Mar is Firm, used by 46.1% of listings.
- A majority (65.6%) of hosts in Del Mar utilize Firm or Strict policies, indicating a market where hosts prioritize booking security.
Recommendations for Hosts
- Consider adopting a Firm policy to align with the 46.1% market standard in Del Mar.
- Regularly review your cancellation policy against competitors and market demand shifts in Del Mar.
Del Mar STR Booking Lead Time Analysis (2026)
Average Booking Lead Time by Month
Booking Lead Time Insights for Del Mar
- The overall average booking lead time for vacation rentals in Del Mar is 69 days.
- Guests book furthest in advance for stays during October (average 92 days), likely coinciding with peak travel demand or local events.
- The shortest booking windows occur for stays in May (average 42 days), indicating more last-minute travel plans during this time.
- Seasonally, Summer (79 days avg.) sees the longest lead times, while Spring (52 days avg.) has the shortest, reflecting typical travel planning cycles.
Recommendations for Hosts
- Use the overall average lead time (69 days) as a baseline for your pricing and availability strategy in Del Mar.
- For October stays, consider implementing length-of-stay discounts or slightly higher rates for bookings made less than 92 days out to capitalize on advance planning.
- Target marketing efforts for the Summer season well in advance (at least 79 days) to capture early planners.
- Monitor your own booking lead times against these Del Mar averages to identify opportunities for dynamic pricing adjustments.
Popular & Essential Airbnb Amenities in Del Mar (2026)
Amenity Prevalence
Amenity Insights for Del Mar
- Essential amenities in Del Mar that guests expect include: TV, Wifi. Lacking these (any) could significantly impact bookings.
- Popular amenities like Kitchen, Smoke alarm, Heating are common but not universal. Offering these can provide a competitive edge.
Recommendations for Hosts
- Ensure your listing includes all essential amenities for Del Mar: TV, Wifi.
- Prioritize adding missing essentials: Wifi.
- Consider adding popular differentiators like Kitchen or Smoke alarm to increase appeal.
- Highlight unique or less common amenities you offer (e.g., hot tub, dedicated workspace, EV charger) in your listing description and photos.
- Regularly check competitor amenities in Del Mar to stay competitive.
Del Mar Airbnb Guest Demographics & Profile Analysis (2026)
Guest Profile Summary for Del Mar
- The typical guest profile for Airbnb in Del Mar consists of primarily domestic travelers (94%), often arriving from nearby Los Angeles, typically belonging to the Post-2000s (Gen Z/Alpha) group (50%), primarily speaking English or Spanish.
- Domestic travelers account for 93.9% of guests.
- Key international markets include United States (93.9%) and Canada (1.4%).
- Top languages spoken are English (68.6%) followed by Spanish (15.9%).
- A significant demographic segment is the Post-2000s (Gen Z/Alpha) group, representing 50% of guests.
Recommendations for Hosts
- Target domestic marketing efforts towards travelers from Los Angeles and San Diego.
- Tailor amenities and listing descriptions to appeal to the dominant Post-2000s (Gen Z/Alpha) demographic (e.g., highlight fast WiFi, smart home features, local guides).
- Highlight unique local experiences or amenities relevant to the primary guest profile.
- Consider seasonal promotions aligned with peak travel times for key origin markets.
Nearby Short-Term Rental Market Comparison
How does the Del Mar Airbnb market stack up against its neighbors? Compare key performance metrics like average monthly revenue, ADR, and occupancy rates in surrounding areas to understand the broader regional STR landscape.
| Market | Active Properties | Monthly Revenue | Daily Rate | Avg. Occupancy |
|---|---|---|---|---|
| Newport Beach | 1,273 | $8,950 | $744.06 | 47% |
| Rancho San Diego | 25 | $8,649 | $568.72 | 48% |
| Thousand Palms | 33 | $8,119 | $725.48 | 36% |
| Manhattan Beach | 267 | $7,875 | $585.30 | 53% |
| Lakeside | 33 | $7,537 | $604.33 | 44% |
| GlenOak Hills | 41 | $7,394 | $648.65 | 41% |
| Bermuda Dunes | 143 | $7,324 | $664.90 | 39% |
| Mount Helix | 33 | $7,163 | $594.94 | 50% |
| Avalon | 249 | $6,705 | $696.60 | 38% |
| Rancho Santa Fe | 34 | $6,074 | $913.16 | 35% |