El Granada Airbnb Market Analysis 2026: Short Term Rental Data & Vacation Rental Statistics in California, United States
Is Airbnb profitable in El Granada in 2026? Explore comprehensive Airbnb analytics for El Granada, California, United States to uncover income potential. This 2026 STR market report for El Granada, based on AirROI data from February 2025 to January 2026, reveals key trends in the niche market of 81 active listings.
Whether you're considering an Airbnb investment in El Granada, optimizing your existing vacation rental, or exploring rental arbitrage opportunities, understanding the El Granada Airbnb data is crucial. Leveraging the low regulation environment is key to maximizing your short term rental income potential. Let's dive into the specifics.
Key El Granada Airbnb Performance Metrics Overview
Monthly Airbnb Revenue Variations & Income Potential in El Granada (2026)
Understanding the monthly revenue variations for Airbnb listings in El Granada is key to maximizing your short term rental income potential. Seasonality significantly impacts earnings. Our analysis, based on data from the past 12 months, shows that the peak revenue month for STRs in El Granada is typically July, while January often presents the lowest earnings, highlighting opportunities for strategic pricing adjustments during shoulder and low seasons. Explore the typical Airbnb income in El Granada across different performance tiers:
- Best-in-class properties (Top 10%) achieve $12,618+ monthly, often utilizing dynamic pricing and superior guest experiences.
- Strong performing properties (Top 25%) earn $8,286 or more, indicating effective management and desirable locations/amenities.
- Typical properties (Median) generate around $5,033 per month, representing the average market performance.
- Entry-level properties (Bottom 25%) see earnings around $3,194, often with potential for optimization.
Average Monthly Airbnb Earnings Trend in El Granada
El Granada Airbnb Occupancy Rate Trends (2026)
Maximize your bookings by understanding the El Granada STR occupancy trends. Seasonal demand shifts significantly influence how often properties are booked. Typically, Julysees the highest demand (peak season occupancy), while January experiences the lowest (low season). Effective strategies, like adjusting minimum stays or offering promotions, can boost occupancy during slower periods. Here's how different property tiers perform in El Granada:
- Best-in-class properties (Top 10%) achieve 82%+ occupancy, indicating high desirability and potentially optimized availability.
- Strong performing properties (Top 25%) maintain 67% or higher occupancy, suggesting good market fit and guest satisfaction.
- Typical properties (Median) have an occupancy rate around 52%.
- Entry-level properties (Bottom 25%) average 35% occupancy, potentially facing higher vacancy.
Average Monthly Occupancy Rate Trend in El Granada
Average Daily Rate (ADR) Airbnb Trends in El Granada (2026)
Effective short term rental pricing strategy in El Granada involves understanding monthly ADR fluctuations. The Average Daily Rate (ADR) for Airbnb in El Granada typically peaks in June and dips lowest during February. Leveraging Airbnb dynamic pricing tools or strategies based on this seasonality can significantly boost revenue. Here's a look at the typical nightly rates achieved:
- Best-in-class properties (Top 10%) command rates of $740+ per night, often due to premium features or locations.
- Strong performing properties (Top 25%) achieve nightly rates of $531 or more.
- Typical properties (Median) charge around $321 per night.
- Entry-level properties (Bottom 25%) earn around $225 per night.
Average Daily Rate (ADR) Trend by Month in El Granada
Get Live El Granada Market Intelligence 👇

Explore Real-time Analytics
Airbnb Seasonality Analysis & Trends in El Granada (2026)
Peak Season (July, August, June)
- Revenue averages $8,208 per month
- Occupancy rates average 61.2%
- Daily rates average $405
Shoulder Season
- Revenue averages $6,408 per month
- Occupancy maintains around 51.2%
- Daily rates hold near $396
Low Season (January, February, November)
- Revenue drops to average $4,460 per month
- Occupancy decreases to average 41.7%
- Daily rates adjust to average $381
Seasonality Insights for El Granada
- The Airbnb seasonality in El Granada shows highly seasonal trends requiring careful strategy. While the sections above show seasonal averages, it's also insightful to look at the extremes:
- During the high season, the absolute peak month showcases El Granada's highest earning potential, with monthly revenues capable of climbing to $8,885, occupancy reaching a high of 63.8%, and ADRs peaking at $420.
- Conversely, the slowest single month of the year, typically falling within the low season, marks the market's lowest point. In this month, revenue might dip to $3,783, occupancy could drop to 33.7%, and ADRs may adjust down to $343.
- Understanding both the seasonal averages and these monthly peaks and troughs in revenue, occupancy, and ADR is crucial for maximizing your Airbnb profit potential in El Granada.
Seasonal Strategies for Maximizing Profit
- Peak Season: Maximize revenue through premium pricing and potentially longer minimum stays. Ensure high availability.
- Low Season: Offer competitive pricing, special promotions (e.g., extended stay discounts), and flexible cancellation policies. Target off-season travelers like remote workers or budget-conscious guests.
- Shoulder Seasons: Implement dynamic pricing that balances peak and low rates. Target weekend travelers or specific events. Offer slightly more flexible terms than peak season.
- Regularly analyze your own performance against these El Granada seasonality benchmarks and adjust your pricing and availability strategy accordingly.
Best Areas for Airbnb Investment in El Granada (2026)
Exploring the top neighborhoods for short-term rentals in El Granada? This section highlights key areas, outlining why they are attractive for hosts and guests, along with notable local attractions. Consider these locations based on your target guest profile and investment strategy.
| Neighborhood / Area | Why Host Here? (Target Guests & Appeal) | Key Attractions & Landmarks |
|---|---|---|
| El Granada Beach | Beautiful, serene beach area perfect for vacationers looking for relaxation and coastal activities. Offers stunning views and a peaceful atmosphere. | El Granada Beach, Pillar Point Harbor, Marin Headlands, Half Moon Bay State Beach, Beachfront restaurants |
| Half Moon Bay | Charming coastal town known for its scenic beaches and popular events like the Half Moon Bay Pumpkin Festival. Great for tourists seeking small-town charm with outdoor activities. | Half Moon Bay State Beach, Farmers' Market, Pigeon Point Lighthouse, Half Moon Bay Harbor, Joaquin Miller Park |
| Mavericks Beach | Renowned surf spot known for its big waves and surf culture, attracting adventure seekers and surfers year-round. | Mavericks Surf Break, Rockaway Beach, Half Moon Bay Brewing Company, Surfer's Beach, Coastal Trail |
| California Coastal Trail | Offers breathtaking views of the coastline, perfect for hikers and nature lovers, making it an attractive location for eco-tourism. | California Coastal Trail, Pigeon Point Lighthouse, Moss Beach, Tennessee Valley, Nature reserves |
| Pillar Point Harbor | A harbor area with picturesque views and seafood dining options, ideal for visitors looking for a seaside experience. | Pillar Point Harbor, Harbor Village, Seafood restaurants, Kayaking and boating, Coastal scenic walks |
| The Ritz-Carlton, Half Moon Bay | Luxury resort that attracts high-end travelers. Outstanding for hosting guests looking for premium accommodations near the coast. | Ritz-Carlton spa, Golf course, Beach access, Fine dining, Ocean views |
| Burleigh H. Murray Ranch State Park | A hidden gem for outdoor enthusiasts and nature lovers, providing opportunities for hiking and experiencing California's natural beauty. | Hiking trails, Wildlife viewing, Historic ranch buildings, Scenic vistas, Picnic areas |
| Half Moon Bay Airport | A convenient location for private travelers and those attending events or activities nearby, making it a strategic area for Airbnb hosting. | Coastal aviation charters, Flying lessons, Scenic flights, Event space, Nearby beaches |
Understanding Airbnb License Requirements & STR Laws in El Granada (2026)
While El Granada, California, United States currently shows low STR regulations, specific Airbnb license requirements might still exist or change. Always verify the latest short term rental regulations and Airbnb license requirements directly with local government authorities for El Granada to ensure full compliance before hosting.
(Source: AirROI data, 2026, finding no licensed listings among those analyzed)
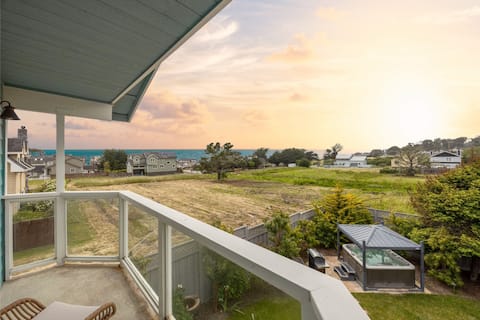
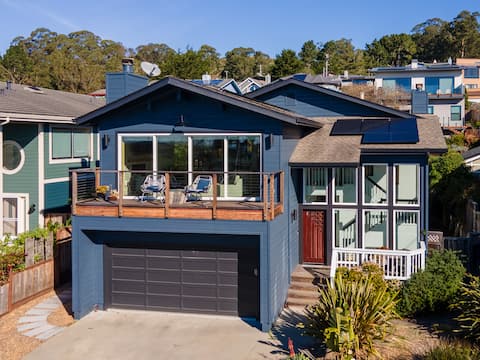
Top Performing Airbnb Properties in El Granada (2026)
Benchmark your potential! Explore examples of top-performing Airbnb properties in El Granadabased on Trailing Twelve Month (TTM) revenue. Analyze their characteristics, revenue, occupancy rate, and ADR to understand what drives success in this market.

Ocean Views, Steps 2 Beach, Hot Tub, BBQ, Fire Pit
Entire Place • 5 bedrooms

Explorer's Retreat - Forest, ocean, hot tub, beach
Entire Place • 5 bedrooms
Coastal Dream! OceanView, steps2beach, HotTub, BBQ
Entire Place • 6 bedrooms

Half Moon Bay Coastal Home Walk Beach & Harbor SPA
Entire Place • 4 bedrooms
Coastal Retreat Near Harbor, Beaches, Restaurants
Entire Place • 4 bedrooms

Miramar Escape! Ocean View, Roof Deck & Steps2Beach
Entire Place • 4 bedrooms
Note: Performance varies based on location, size, amenities, seasonality, and management quality. Data reflects the past 12 months.
Top Performing Airbnb Hosts in El Granada (2026)
Learn from the best! This table showcases top-performing Airbnb hosts in El Granada based on the number of properties managed and estimated total revenue over the past year. Analyze their scale and performance metrics.
| Host Name | Properties | Grossing Revenue | Stay Reviews | Avg Rating |
|---|---|---|---|---|
| Stephanie And Melanie | 6 | $694,350 | 607 | 4.80/5.0 |
| Karen | 2 | $243,380 | 54 | 5.00/5.0 |
| Rich | 1 | $195,167 | 138 | 4.91/5.0 |
| Gi'Angelo | 2 | $164,511 | 193 | 4.93/5.0 |
| Nancy | 1 | $164,415 | 389 | 4.99/5.0 |
| Paul | 3 | $153,949 | 25 | 5.00/5.0 |
| Rita | 2 | $143,426 | 193 | 4.98/5.0 |
| Lynn | 1 | $140,432 | 26 | 5.00/5.0 |
| Diana | 3 | $139,866 | 1144 | 4.92/5.0 |
| Matt | 3 | $138,634 | 36 | 4.88/5.0 |
Analyzing the strategies of top hosts, such as their property selection, pricing, and guest communication, can offer valuable lessons for optimizing your own Airbnb operations in El Granada.
Dive Deeper: Advanced El Granada STR Market Data (2026)
Ready to unlock more insights? AirROI provides access to advanced metrics and comprehensive Airbnb data for El Granada. Explore detailed analytics beyond this report to refine your investment strategy, optimize pricing, and maximize your vacation rental profits.
Explore Advanced MetricsEl Granada Short-Term Rental Market Composition (2026): Property & Room Types
Room Type Distribution
Property Type Distribution
Market Composition Insights for El Granada
- The El Granada Airbnb market composition is heavily skewed towards Entire Home/Apt listings, which make up 96.3% of the 81 active rentals. This indicates strong guest preference for privacy and space.
- Looking at the property type distribution in El Granada, House properties are the most common (65.4%), reflecting the local real estate landscape.
- Houses represent a significant 65.4% portion, catering likely to families or larger groups.
- The presence of 8.6% Hotel/Boutique listings indicates integration with traditional hospitality.
El Granada Airbnb Room Capacity Analysis (2026): Bedroom Distribution
Distribution of Listings by Number of Bedrooms
Room Capacity Insights for El Granada
- The dominant room capacity in El Granada is 2 bedrooms listings, making up 28.4% of the market. This suggests a strong demand for properties suitable for couples or solo travelers.
- Together, 2 bedrooms and 1 bedroom properties represent 54.3% of the active Airbnb listings in El Granada, indicating a high concentration in these sizes.
- A significant 37.0% of listings offer 3+ bedrooms, catering to larger groups and families seeking more space in El Granada.
El Granada Vacation Rental Guest Capacity Trends (2026)
Distribution of Listings by Guest Capacity
Guest Capacity Insights for El Granada
- The most common guest capacity trend in El Granada vacation rentals is listings accommodating 8+ guests (21%). This suggests the primary traveler segment is likely larger groups.
- Properties designed for 8+ guests and 4 guests dominate the El Granada STR market, accounting for 40.8% of listings.
- 43.2% of properties accommodate 6+ guests, serving the market segment for larger families or group travel in El Granada.
- On average, properties in El Granada are equipped to host 4.8 guests.
El Granada Airbnb Booking Patterns (2026): Available vs. Booked Days
Available Days Distribution
Booked Days Distribution
Booking Pattern Insights for El Granada
- The most common availability pattern in El Granada falls within the 181-270 days range, representing 38.3% of listings. This suggests many properties have significant open periods on their calendars.
- Approximately 61.8% of listings show high availability (181+ days open annually), indicating potential for increased bookings or specific owner usage patterns.
- For booked days, the 91-180 days range is most frequent in El Granada (38.3%), reflecting common guest stay durations or potential owner blocking patterns.
- A notable 39.5% of properties secure long booking periods (181+ days booked per year), highlighting successful long-term rental strategies or significant owner usage.
El Granada Airbnb Minimum Stay Requirements Analysis
Distribution of Listings by Minimum Night Requirement
1 Night
16 listings
19.8% of total
2 Nights
25 listings
30.9% of total
4-6 Nights
1 listings
1.2% of total
7-29 Nights
2 listings
2.5% of total
30+ Nights
37 listings
45.7% of total
Key Insights
- The most prevalent minimum stay requirement in El Granada is 30+ Nights, adopted by 45.7% of listings. This highlights the market's preference for longer commitments.
- A significant segment (45.7%) caters to monthly stays (30+ nights) in El Granada, pointing to opportunities in the extended-stay market.
Recommendations
- Align with the market by considering a 30+ Nights minimum stay, as 45.7% of El Granada hosts use this setting.
- If feasible, allowing 1-night stays, especially midweek or during low season, could capture last-minute bookings, as only 19.8% currently do.
- A 2-night minimum appears standard (30.9%). Consider this for weekends or peak periods.
- Explore offering discounts for stays of 30+ nights to attract the 45.7% of the market seeking extended stays.
- Adjust minimum nights based on seasonality – potentially shorter during low season and longer during peak demand periods in El Granada.
El Granada Airbnb Cancellation Policy Trends Analysis (2026)
Limited
3 listings
3.7% of total
Flexible
18 listings
22.2% of total
Moderate
30 listings
37% of total
Firm
24 listings
29.6% of total
Strict
6 listings
7.4% of total
Cancellation Policy Insights for El Granada
- The prevailing Airbnb cancellation policy trend in El Granada is Moderate, used by 37% of listings.
- There's a relatively balanced mix between guest-friendly (59.2%) and stricter (37.0%) policies, offering choices for different guest needs.
- Strict cancellation policies are quite rare (7.4%), potentially making listings with this policy less competitive unless justified by high demand or property type.
Recommendations for Hosts
- Consider adopting a Moderate policy to align with the 37% market standard in El Granada.
- Using a Strict policy might deter some guests, as only 7.4% of listings use it. Evaluate if potential revenue protection outweighs possible lower booking rates.
- Regularly review your cancellation policy against competitors and market demand shifts in El Granada.
El Granada STR Booking Lead Time Analysis (2026)
Average Booking Lead Time by Month
Booking Lead Time Insights for El Granada
- The overall average booking lead time for vacation rentals in El Granada is 48 days.
- Guests book furthest in advance for stays during July (average 56 days), likely coinciding with peak travel demand or local events.
- The shortest booking windows occur for stays in March (average 28 days), indicating more last-minute travel plans during this time.
- Seasonally, Summer (53 days avg.) sees the longest lead times, while Spring (35 days avg.) has the shortest, reflecting typical travel planning cycles.
Recommendations for Hosts
- Use the overall average lead time (48 days) as a baseline for your pricing and availability strategy in El Granada.
- Target marketing efforts for the Summer season well in advance (at least 53 days) to capture early planners.
- Monitor your own booking lead times against these El Granada averages to identify opportunities for dynamic pricing adjustments.
Popular & Essential Airbnb Amenities in El Granada (2026)
Amenity Prevalence
Amenity Insights for El Granada
- Essential amenities in El Granada that guests expect include: Wifi, Smoke alarm, Heating, Carbon monoxide alarm, Hot water. Lacking these (any) could significantly impact bookings.
- Popular amenities like Kitchen, TV, Fire extinguisher are common but not universal. Offering these can provide a competitive edge.
Recommendations for Hosts
- Ensure your listing includes all essential amenities for El Granada: Wifi, Smoke alarm, Heating, Carbon monoxide alarm, Hot water.
- Prioritize adding missing essentials: Wifi, Smoke alarm, Heating, Carbon monoxide alarm, Hot water.
- Consider adding popular differentiators like Kitchen or TV to increase appeal.
- Highlight unique or less common amenities you offer (e.g., hot tub, dedicated workspace, EV charger) in your listing description and photos.
- Regularly check competitor amenities in El Granada to stay competitive.
El Granada Airbnb Guest Demographics & Profile Analysis (2026)
Guest Profile Summary for El Granada
- The typical guest profile for Airbnb in El Granada consists of primarily domestic travelers (93%), often arriving from nearby San Francisco, typically belonging to the Post-2000s (Gen Z/Alpha) group (50%), primarily speaking English or Spanish.
- Domestic travelers account for 92.5% of guests.
- Key international markets include United States (92.5%) and Canada (1.4%).
- Top languages spoken are English (65.6%) followed by Spanish (12.6%).
- A significant demographic segment is the Post-2000s (Gen Z/Alpha) group, representing 50% of guests.
Recommendations for Hosts
- Target domestic marketing efforts towards travelers from San Francisco and Sacramento.
- Tailor amenities and listing descriptions to appeal to the dominant Post-2000s (Gen Z/Alpha) demographic (e.g., highlight fast WiFi, smart home features, local guides).
- Highlight unique local experiences or amenities relevant to the primary guest profile.
- Consider seasonal promotions aligned with peak travel times for key origin markets.
Nearby Short-Term Rental Market Comparison
How does the El Granada Airbnb market stack up against its neighbors? Compare key performance metrics like average monthly revenue, ADR, and occupancy rates in surrounding areas to understand the broader regional STR landscape.
| Market | Active Properties | Monthly Revenue | Daily Rate | Avg. Occupancy |
|---|---|---|---|---|
| Carmel Point | 15 | $14,483 | $1046.17 | 54% |
| Del Monte Forest | 105 | $10,280 | $964.89 | 47% |
| Moss Beach | 34 | $10,092 | $676.91 | 53% |
| Sonoma | 228 | $9,647 | $819.87 | 43% |
| Marshall | 18 | $8,897 | $607.75 | 50% |
| St. Helena | 50 | $8,684 | $924.70 | 38% |
| Carmel-by-the-Sea | 305 | $8,657 | $680.02 | 49% |
| Kenwood | 60 | $8,643 | $810.83 | 41% |
| Glen Ellen | 85 | $8,482 | $799.53 | 43% |
| Eldridge | 21 | $8,410 | $930.61 | 41% |