Felton Airbnb Market Analysis 2026: Short Term Rental Data & Vacation Rental Statistics in California, United States
Is Airbnb profitable in Felton in 2026? Explore comprehensive Airbnb analytics for Felton, California, United States to uncover income potential. This 2026 STR market report for Felton, based on AirROI data from February 2025 to January 2026, reveals key trends in the niche market of 51 active listings.
Whether you're considering an Airbnb investment in Felton, optimizing your existing vacation rental, or exploring rental arbitrage opportunities, understanding the Felton Airbnb data is crucial. Leveraging the low regulation environment is key to maximizing your short term rental income potential. Let's dive into the specifics.
Key Felton Airbnb Performance Metrics Overview
Monthly Airbnb Revenue Variations & Income Potential in Felton (2026)
Understanding the monthly revenue variations for Airbnb listings in Felton is key to maximizing your short term rental income potential. Seasonality significantly impacts earnings. Our analysis, based on data from the past 12 months, shows that the peak revenue month for STRs in Felton is typically July, while January often presents the lowest earnings, highlighting opportunities for strategic pricing adjustments during shoulder and low seasons. Explore the typical Airbnb income in Felton across different performance tiers:
- Best-in-class properties (Top 10%) achieve $11,874+ monthly, often utilizing dynamic pricing and superior guest experiences.
- Strong performing properties (Top 25%) earn $8,085 or more, indicating effective management and desirable locations/amenities.
- Typical properties (Median) generate around $4,678 per month, representing the average market performance.
- Entry-level properties (Bottom 25%) see earnings around $2,989, often with potential for optimization.
Average Monthly Airbnb Earnings Trend in Felton
Felton Airbnb Occupancy Rate Trends (2026)
Maximize your bookings by understanding the Felton STR occupancy trends. Seasonal demand shifts significantly influence how often properties are booked. Typically, Julysees the highest demand (peak season occupancy), while January experiences the lowest (low season). Effective strategies, like adjusting minimum stays or offering promotions, can boost occupancy during slower periods. Here's how different property tiers perform in Felton:
- Best-in-class properties (Top 10%) achieve 88%+ occupancy, indicating high desirability and potentially optimized availability.
- Strong performing properties (Top 25%) maintain 78% or higher occupancy, suggesting good market fit and guest satisfaction.
- Typical properties (Median) have an occupancy rate around 57%.
- Entry-level properties (Bottom 25%) average 39% occupancy, potentially facing higher vacancy.
Average Monthly Occupancy Rate Trend in Felton
Average Daily Rate (ADR) Airbnb Trends in Felton (2026)
Effective short term rental pricing strategy in Felton involves understanding monthly ADR fluctuations. The Average Daily Rate (ADR) for Airbnb in Felton typically peaks in June and dips lowest during February. Leveraging Airbnb dynamic pricing tools or strategies based on this seasonality can significantly boost revenue. Here's a look at the typical nightly rates achieved:
- Best-in-class properties (Top 10%) command rates of $552+ per night, often due to premium features or locations.
- Strong performing properties (Top 25%) achieve nightly rates of $401 or more.
- Typical properties (Median) charge around $237 per night.
- Entry-level properties (Bottom 25%) earn around $165 per night.
Average Daily Rate (ADR) Trend by Month in Felton
Get Live Felton Market Intelligence 👇

Explore Real-time Analytics
Airbnb Seasonality Analysis & Trends in Felton (2026)
Peak Season (July, June, August)
- Revenue averages $7,929 per month
- Occupancy rates average 66.0%
- Daily rates average $328
Shoulder Season
- Revenue averages $5,624 per month
- Occupancy maintains around 55.2%
- Daily rates hold near $303
Low Season (January, February, December)
- Revenue drops to average $4,345 per month
- Occupancy decreases to average 48.6%
- Daily rates adjust to average $287
Seasonality Insights for Felton
- The Airbnb seasonality in Felton shows highly seasonal trends requiring careful strategy. While the sections above show seasonal averages, it's also insightful to look at the extremes:
- During the high season, the absolute peak month showcases Felton's highest earning potential, with monthly revenues capable of climbing to $8,285, occupancy reaching a high of 66.4%, and ADRs peaking at $335.
- Conversely, the slowest single month of the year, typically falling within the low season, marks the market's lowest point. In this month, revenue might dip to $3,755, occupancy could drop to 43.8%, and ADRs may adjust down to $270.
- Understanding both the seasonal averages and these monthly peaks and troughs in revenue, occupancy, and ADR is crucial for maximizing your Airbnb profit potential in Felton.
Seasonal Strategies for Maximizing Profit
- Peak Season: Maximize revenue through premium pricing and potentially longer minimum stays. Ensure high availability.
- Low Season: Offer competitive pricing, special promotions (e.g., extended stay discounts), and flexible cancellation policies. Target off-season travelers like remote workers or budget-conscious guests.
- Shoulder Seasons: Implement dynamic pricing that balances peak and low rates. Target weekend travelers or specific events. Offer slightly more flexible terms than peak season.
- Regularly analyze your own performance against these Felton seasonality benchmarks and adjust your pricing and availability strategy accordingly.
Best Areas for Airbnb Investment in Felton (2026)
Exploring the top neighborhoods for short-term rentals in Felton? This section highlights key areas, outlining why they are attractive for hosts and guests, along with notable local attractions. Consider these locations based on your target guest profile and investment strategy.
| Neighborhood / Area | Why Host Here? (Target Guests & Appeal) | Key Attractions & Landmarks |
|---|---|---|
| Henry Cowell Redwoods State Park | A serene natural area famous for its towering redwood trees and lush trails. Perfect for nature lovers seeking an outdoor escape and adventure, making it attractive for visitors looking to reconnect with nature. | Redwood Grove Loop Trail, Giant Tree, Pine Flat, Observation Deck, Nature Center |
| Felton Covered Bridge Park | Home to the historic covered bridge, this park is a picturesque spot that offers scenic views and picnic areas. It’s a charming locale for families and history buffs alike. | Felton Covered Bridge, Picnic areas, Scenic walking paths |
| Downtown Felton | The heart of the charming town with quaint shops and dining options. This area attracts visitors looking for a small-town experience with local flavor and character. | Local cafes and restaurants, Shops, Annual events |
| Roaring Camp Railroads | A family-friendly attraction offering nostalgic steam train rides through the redwood forests. Great for families and tourists who enjoy historical experiences and unique attractions. | Steam train rides, Historical exhibits, Scenic redwood views |
| Big Basin Redwoods State Park | The oldest state park in California, known for its stunning redwood trees and diverse hiking trails. It's perfect for eco-tourism and outdoor enthusiasts looking for peace and nature. | Big Basin Waterfalls, Skyline to the Sea Trail, Visitor Center, Nature walks |
| Mount Hermon | A scenic area surrounding the historic Mount Hermon conference grounds, offering opportunities for a range of outdoor activities, including zip-lining and hiking. Attracts thrill-seekers and retreat groups. | Zip Line Tree Top Tour, Hiking Trails, Nature activities |
| San Lorenzo Valley | A beautiful valley that offers stunning views and nature trails, appealing to outdoor enthusiasts and those looking to explore the beauty of Central California. | San Lorenzo River, Hiking and biking trails, Nature photography |
| Felton Grove | A charming residential neighborhood close to nature, perfect for a laid-back vacation experience while being near Felton's features. Ideal for those looking for a quieter environment close to attractions. | Riverside picnic areas, Nature watching, Small local markets |
Understanding Airbnb License Requirements & STR Laws in Felton (2026)
While Felton, California, United States currently shows low STR regulations, specific Airbnb license requirements might still exist or change. Always verify the latest short term rental regulations and Airbnb license requirements directly with local government authorities for Felton to ensure full compliance before hosting.
(Source: AirROI data, 2026, finding no licensed listings among those analyzed)
Top Performing Airbnb Properties in Felton (2026)
Benchmark your potential! Explore examples of top-performing Airbnb properties in Feltonbased on Trailing Twelve Month (TTM) revenue. Analyze their characteristics, revenue, occupancy rate, and ADR to understand what drives success in this market.
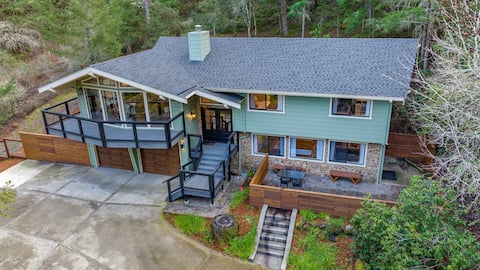
Upscale Newly Remodeled Cabin
Entire Place • 4 bedrooms
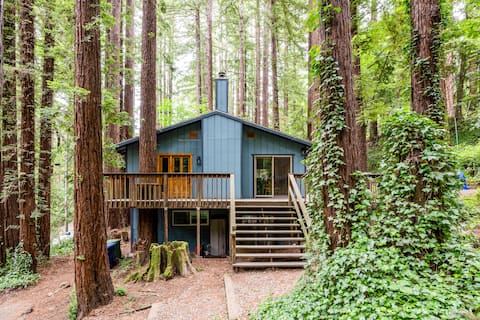
Adventure house under the redwoods, with spa!
Entire Place • 4 bedrooms

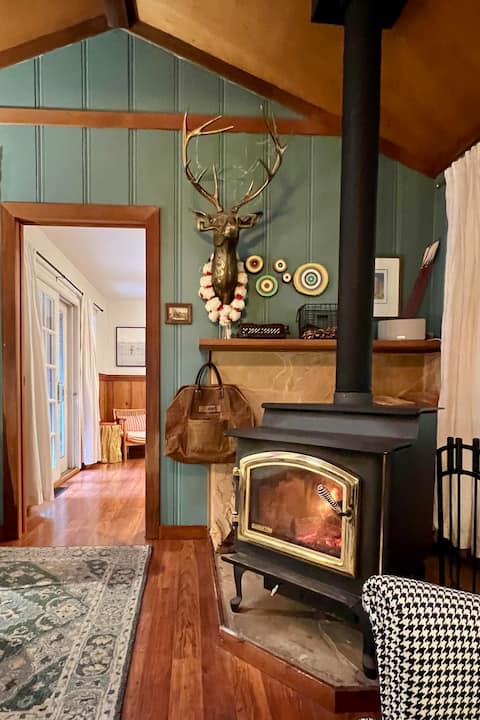
Whiskey Hollow A-Frame: As feat'd in Condé Nast!
Entire Place • 2 bedrooms
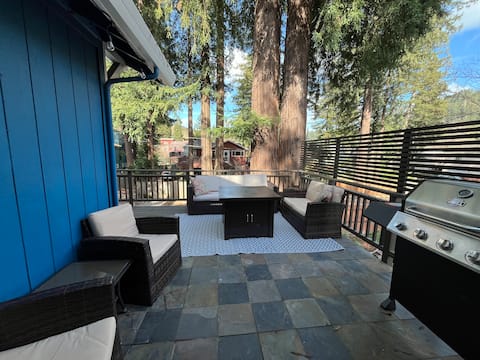
Whiskey Creek, Dog-Friendly Cabin with Hot Tub
Entire Place • 2 bedrooms

Santa Cruz Mountain Retreat
Entire Place • 3 bedrooms
The Famous Felton Express
Entire Place • 5 bedrooms
Note: Performance varies based on location, size, amenities, seasonality, and management quality. Data reflects the past 12 months.
Top Performing Airbnb Hosts in Felton (2026)
Learn from the best! This table showcases top-performing Airbnb hosts in Felton based on the number of properties managed and estimated total revenue over the past year. Analyze their scale and performance metrics.
| Host Name | Properties | Grossing Revenue | Stay Reviews | Avg Rating |
|---|---|---|---|---|
| Laurel | 2 | $228,474 | 321 | 4.84/5.0 |
| Gowa | 4 | $218,756 | 153 | 4.92/5.0 |
| Presnell | 1 | $172,100 | 55 | 4.91/5.0 |
| Jamie | 1 | $159,219 | 317 | 4.99/5.0 |
| Paige | 1 | $129,131 | 155 | 4.99/5.0 |
| Pavan | 1 | $126,833 | 48 | 4.83/5.0 |
| Kent | 1 | $123,713 | 80 | 5.00/5.0 |
| Geralynn | 1 | $121,613 | 325 | 4.90/5.0 |
| Jorian | 1 | $119,957 | 125 | 4.96/5.0 |
| Ovr | 2 | $111,190 | 248 | 4.79/5.0 |
Analyzing the strategies of top hosts, such as their property selection, pricing, and guest communication, can offer valuable lessons for optimizing your own Airbnb operations in Felton.
Dive Deeper: Advanced Felton STR Market Data (2026)
Ready to unlock more insights? AirROI provides access to advanced metrics and comprehensive Airbnb data for Felton. Explore detailed analytics beyond this report to refine your investment strategy, optimize pricing, and maximize your vacation rental profits.
Explore Advanced MetricsFelton Short-Term Rental Market Composition (2026): Property & Room Types
Room Type Distribution
Property Type Distribution
Market Composition Insights for Felton
- The Felton Airbnb market composition is heavily skewed towards Entire Home/Apt listings, which make up 92.2% of the 51 active rentals. This indicates strong guest preference for privacy and space.
- Looking at the property type distribution in Felton, House properties are the most common (54.9%), reflecting the local real estate landscape.
- Houses represent a significant 54.9% portion, catering likely to families or larger groups.
- The presence of 11.8% Hotel/Boutique listings indicates integration with traditional hospitality.
- Smaller segments like apartment/condo, unique stays, others (combined 9.8%) offer potential for unique stay experiences.
Felton Airbnb Room Capacity Analysis (2026): Bedroom Distribution
Distribution of Listings by Number of Bedrooms
Room Capacity Insights for Felton
- The dominant room capacity in Felton is 1 bedroom listings, making up 33.3% of the market. This suggests a strong demand for properties suitable for couples or solo travelers.
- Together, 1 bedroom and 2 bedrooms properties represent 64.7% of the active Airbnb listings in Felton, indicating a high concentration in these sizes.
- A significant 25.5% of listings offer 3+ bedrooms, catering to larger groups and families seeking more space in Felton.
Felton Vacation Rental Guest Capacity Trends (2026)
Distribution of Listings by Guest Capacity
Guest Capacity Insights for Felton
- The most common guest capacity trend in Felton vacation rentals is listings accommodating 2 guests (27.5%). This suggests the primary traveler segment is likely couples or solo travelers.
- Properties designed for 2 guests and 6 guests dominate the Felton STR market, accounting for 47.1% of listings.
- 31.4% of properties accommodate 6+ guests, serving the market segment for larger families or group travel in Felton.
- On average, properties in Felton are equipped to host 4.2 guests.
Felton Airbnb Booking Patterns (2026): Available vs. Booked Days
Available Days Distribution
Booked Days Distribution
Booking Pattern Insights for Felton
- The most common availability pattern in Felton falls within the 181-270 days range, representing 35.3% of listings. This suggests many properties have significant open periods on their calendars.
- Approximately 52.9% of listings show high availability (181+ days open annually), indicating potential for increased bookings or specific owner usage patterns.
- For booked days, the 91-180 days range is most frequent in Felton (35.3%), reflecting common guest stay durations or potential owner blocking patterns.
- A notable 47.1% of properties secure long booking periods (181+ days booked per year), highlighting successful long-term rental strategies or significant owner usage.
Felton Airbnb Minimum Stay Requirements Analysis
Distribution of Listings by Minimum Night Requirement
1 Night
13 listings
25.5% of total
2 Nights
10 listings
19.6% of total
3 Nights
1 listings
2% of total
4-6 Nights
2 listings
3.9% of total
7-29 Nights
5 listings
9.8% of total
30+ Nights
20 listings
39.2% of total
Key Insights
- The most prevalent minimum stay requirement in Felton is 30+ Nights, adopted by 39.2% of listings. This highlights the market's preference for longer commitments.
- A significant segment (39.2%) caters to monthly stays (30+ nights) in Felton, pointing to opportunities in the extended-stay market.
Recommendations
- Align with the market by considering a 30+ Nights minimum stay, as 39.2% of Felton hosts use this setting.
- If feasible, allowing 1-night stays, especially midweek or during low season, could capture last-minute bookings, as only 25.5% currently do.
- Explore offering discounts for stays of 30+ nights to attract the 39.2% of the market seeking extended stays.
- Adjust minimum nights based on seasonality – potentially shorter during low season and longer during peak demand periods in Felton.
Felton Airbnb Cancellation Policy Trends Analysis (2026)
Limited
1 listings
2% of total
Flexible
6 listings
11.8% of total
Moderate
21 listings
41.2% of total
Firm
18 listings
35.3% of total
Strict
5 listings
9.8% of total
Cancellation Policy Insights for Felton
- The prevailing Airbnb cancellation policy trend in Felton is Moderate, used by 41.2% of listings.
- There's a relatively balanced mix between guest-friendly (53.0%) and stricter (45.1%) policies, offering choices for different guest needs.
- Strict cancellation policies are quite rare (9.8%), potentially making listings with this policy less competitive unless justified by high demand or property type.
Recommendations for Hosts
- Consider adopting a Moderate policy to align with the 41.2% market standard in Felton.
- Using a Strict policy might deter some guests, as only 9.8% of listings use it. Evaluate if potential revenue protection outweighs possible lower booking rates.
- Regularly review your cancellation policy against competitors and market demand shifts in Felton.
Felton STR Booking Lead Time Analysis (2026)
Average Booking Lead Time by Month
Booking Lead Time Insights for Felton
- The overall average booking lead time for vacation rentals in Felton is 45 days.
- Guests book furthest in advance for stays during June (average 73 days), likely coinciding with peak travel demand or local events.
- The shortest booking windows occur for stays in January (average 27 days), indicating more last-minute travel plans during this time.
- Seasonally, Summer (68 days avg.) sees the longest lead times, while Winter (35 days avg.) has the shortest, reflecting typical travel planning cycles.
Recommendations for Hosts
- Use the overall average lead time (45 days) as a baseline for your pricing and availability strategy in Felton.
- For June stays, consider implementing length-of-stay discounts or slightly higher rates for bookings made less than 73 days out to capitalize on advance planning.
- Target marketing efforts for the Summer season well in advance (at least 68 days) to capture early planners.
- Monitor your own booking lead times against these Felton averages to identify opportunities for dynamic pricing adjustments.
Popular & Essential Airbnb Amenities in Felton (2026)
Amenity Prevalence
Amenity Insights for Felton
- Essential amenities in Felton that guests expect include: Wifi, Smoke alarm, Free parking on premises, Hot water, Coffee maker. Lacking these (any) could significantly impact bookings.
- Popular amenities like Heating, Carbon monoxide alarm, Bed linens are common but not universal. Offering these can provide a competitive edge.
Recommendations for Hosts
- Ensure your listing includes all essential amenities for Felton: Wifi, Smoke alarm, Free parking on premises, Hot water, Coffee maker.
- Prioritize adding missing essentials: Wifi, Smoke alarm, Free parking on premises, Hot water, Coffee maker.
- Consider adding popular differentiators like Heating or Carbon monoxide alarm to increase appeal.
- Highlight unique or less common amenities you offer (e.g., hot tub, dedicated workspace, EV charger) in your listing description and photos.
- Regularly check competitor amenities in Felton to stay competitive.
Felton Airbnb Guest Demographics & Profile Analysis (2026)
Guest Profile Summary for Felton
- The typical guest profile for Airbnb in Felton consists of primarily domestic travelers (96%), often arriving from nearby San Francisco, typically belonging to the Post-2000s (Gen Z/Alpha) group (50%), primarily speaking English or Spanish.
- Domestic travelers account for 95.6% of guests.
- Key international markets include United States (95.6%) and United Kingdom (0.8%).
- Top languages spoken are English (62.7%) followed by Spanish (14.4%).
- A significant demographic segment is the Post-2000s (Gen Z/Alpha) group, representing 50% of guests.
Recommendations for Hosts
- Target domestic marketing efforts towards travelers from San Francisco and Los Angeles.
- Tailor amenities and listing descriptions to appeal to the dominant Post-2000s (Gen Z/Alpha) demographic (e.g., highlight fast WiFi, smart home features, local guides).
- Highlight unique local experiences or amenities relevant to the primary guest profile.
- Consider seasonal promotions aligned with peak travel times for key origin markets.
Nearby Short-Term Rental Market Comparison
How does the Felton Airbnb market stack up against its neighbors? Compare key performance metrics like average monthly revenue, ADR, and occupancy rates in surrounding areas to understand the broader regional STR landscape.
| Market | Active Properties | Monthly Revenue | Daily Rate | Avg. Occupancy |
|---|---|---|---|---|
| Carmel Point | 15 | $14,483 | $1046.17 | 54% |
| Del Monte Forest | 105 | $10,280 | $964.89 | 47% |
| Moss Beach | 34 | $10,092 | $676.91 | 53% |
| Sonoma | 228 | $9,647 | $819.87 | 43% |
| Marshall | 18 | $8,897 | $607.75 | 50% |
| St. Helena | 50 | $8,684 | $924.70 | 38% |
| Carmel-by-the-Sea | 305 | $8,657 | $680.02 | 49% |
| Kenwood | 60 | $8,643 | $810.83 | 41% |
| Glen Ellen | 85 | $8,482 | $799.53 | 43% |
| Eldridge | 21 | $8,410 | $930.61 | 41% |