Fetters Hot Springs Airbnb Market Analysis 2026: Short Term Rental Data & Vacation Rental Statistics in California, United States
Is Airbnb profitable in Fetters Hot Springs in 2026? Explore comprehensive Airbnb analytics for Fetters Hot Springs, California, United States to uncover income potential. This 2026 STR market report for Fetters Hot Springs, based on AirROI data from February 2025 to January 2026, reveals key trends in the niche market of 73 active listings.
Whether you're considering an Airbnb investment in Fetters Hot Springs, optimizing your existing vacation rental, or exploring rental arbitrage opportunities, understanding the Fetters Hot Springs Airbnb data is crucial. Understanding the local regulations is key to maximizing your short term rental income potential. Let's dive into the specifics.
Key Fetters Hot Springs Airbnb Performance Metrics Overview
Monthly Airbnb Revenue Variations & Income Potential in Fetters Hot Springs (2026)
Understanding the monthly revenue variations for Airbnb listings in Fetters Hot Springs is key to maximizing your short term rental income potential. Seasonality significantly impacts earnings. Our analysis, based on data from the past 12 months, shows that the peak revenue month for STRs in Fetters Hot Springs is typically August, while February often presents the lowest earnings, highlighting opportunities for strategic pricing adjustments during shoulder and low seasons. Explore the typical Airbnb income in Fetters Hot Springs across different performance tiers:
- Best-in-class properties (Top 10%) achieve $16,177+ monthly, often utilizing dynamic pricing and superior guest experiences.
- Strong performing properties (Top 25%) earn $9,777 or more, indicating effective management and desirable locations/amenities.
- Typical properties (Median) generate around $5,197 per month, representing the average market performance.
- Entry-level properties (Bottom 25%) see earnings around $2,752, often with potential for optimization.
Average Monthly Airbnb Earnings Trend in Fetters Hot Springs
Fetters Hot Springs Airbnb Occupancy Rate Trends (2026)
Maximize your bookings by understanding the Fetters Hot Springs STR occupancy trends. Seasonal demand shifts significantly influence how often properties are booked. Typically, Augustsees the highest demand (peak season occupancy), while January experiences the lowest (low season). Effective strategies, like adjusting minimum stays or offering promotions, can boost occupancy during slower periods. Here's how different property tiers perform in Fetters Hot Springs:
- Best-in-class properties (Top 10%) achieve 72%+ occupancy, indicating high desirability and potentially optimized availability.
- Strong performing properties (Top 25%) maintain 56% or higher occupancy, suggesting good market fit and guest satisfaction.
- Typical properties (Median) have an occupancy rate around 40%.
- Entry-level properties (Bottom 25%) average 24% occupancy, potentially facing higher vacancy.
Average Monthly Occupancy Rate Trend in Fetters Hot Springs
Average Daily Rate (ADR) Airbnb Trends in Fetters Hot Springs (2026)
Effective short term rental pricing strategy in Fetters Hot Springs involves understanding monthly ADR fluctuations. The Average Daily Rate (ADR) for Airbnb in Fetters Hot Springs typically peaks in June and dips lowest during February. Leveraging Airbnb dynamic pricing tools or strategies based on this seasonality can significantly boost revenue. Here's a look at the typical nightly rates achieved:
- Best-in-class properties (Top 10%) command rates of $1,212+ per night, often due to premium features or locations.
- Strong performing properties (Top 25%) achieve nightly rates of $740 or more.
- Typical properties (Median) charge around $466 per night.
- Entry-level properties (Bottom 25%) earn around $223 per night.
Average Daily Rate (ADR) Trend by Month in Fetters Hot Springs
Get Live Fetters Hot Springs Market Intelligence 👇

Explore Real-time Analytics
Airbnb Seasonality Analysis & Trends in Fetters Hot Springs (2026)
Peak Season (August, July, October)
- Revenue averages $9,982 per month
- Occupancy rates average 49.4%
- Daily rates average $590
Shoulder Season
- Revenue averages $7,973 per month
- Occupancy maintains around 42.7%
- Daily rates hold near $584
Low Season (January, February, December)
- Revenue drops to average $4,532 per month
- Occupancy decreases to average 31.2%
- Daily rates adjust to average $518
Seasonality Insights for Fetters Hot Springs
- The Airbnb seasonality in Fetters Hot Springs shows highly seasonal trends requiring careful strategy. While the sections above show seasonal averages, it's also insightful to look at the extremes:
- During the high season, the absolute peak month showcases Fetters Hot Springs's highest earning potential, with monthly revenues capable of climbing to $10,521, occupancy reaching a high of 51.3%, and ADRs peaking at $632.
- Conversely, the slowest single month of the year, typically falling within the low season, marks the market's lowest point. In this month, revenue might dip to $3,733, occupancy could drop to 27.0%, and ADRs may adjust down to $502.
- Understanding both the seasonal averages and these monthly peaks and troughs in revenue, occupancy, and ADR is crucial for maximizing your Airbnb profit potential in Fetters Hot Springs.
Seasonal Strategies for Maximizing Profit
- Peak Season: Maximize revenue through premium pricing and potentially longer minimum stays. Ensure high availability.
- Low Season: Offer competitive pricing, special promotions (e.g., extended stay discounts), and flexible cancellation policies. Target off-season travelers like remote workers or budget-conscious guests.
- Shoulder Seasons: Implement dynamic pricing that balances peak and low rates. Target weekend travelers or specific events. Offer slightly more flexible terms than peak season.
- Regularly analyze your own performance against these Fetters Hot Springs seasonality benchmarks and adjust your pricing and availability strategy accordingly.
Best Areas for Airbnb Investment in Fetters Hot Springs (2026)
Exploring the top neighborhoods for short-term rentals in Fetters Hot Springs? This section highlights key areas, outlining why they are attractive for hosts and guests, along with notable local attractions. Consider these locations based on your target guest profile and investment strategy.
| Neighborhood / Area | Why Host Here? (Target Guests & Appeal) | Key Attractions & Landmarks |
|---|---|---|
| Sonoma Plaza | Historic town square surrounded by shops, restaurants, and wine tasting rooms. Perfect for guests looking to explore Sonoma County's wine country attractions and enjoy the charming atmosphere. | Sonoma Plaza, Mission San Francisco Solano, Sonoma State Historic Park, Vallejo's Restaurant, Sonoma County Museum |
| Glen Ellen | A quaint village that offers beautiful vineyards and proximity to natural attractions, great for those seeking a relaxing stay in wine country. | Jack London State Historic Park, Benziger Family Winery, Glen Ellen Village Market, Kunde Family Winery |
| Kenwood | Nestled in wine country, Kenwood is known for its beautiful landscape and wineries. Ideal for guests who appreciate nature and fine wine. | Kunde Family Winery, Kenwood Vineyards, Sugarloaf Ridge State Park, Hafenland Vineyards |
| Napa | Famous for its world-renowned wineries and vibrant culinary scene, Napa is a must-visit for foodies and wine enthusiasts. | Napa Valley Wine Train, Oxbow Public Market, di Rosa Center for Contemporary Art, Napa Valley Opera House |
| Santa Rosa | Larger city with a variety of attractions, dining, and shopping options. A good base for exploring the surrounding wine regions. | Charles M. Schulz Museum, Railroad Square Historic District, Santa Rosa Memorial Park, Luther Burbank Home and Gardens |
| Healdsburg | Charming town at the convergence of three wine regions, known for its small-town feel and sophisticated dining experiences. | Healdsburg Plaza, Healdsburg Museum, Dining at popular restaurants, Savor Healdsburg's wine tasting shops |
| Petaluma | Known for its historic downtown and vibrant arts scene, Petaluma offers a unique setting for guests looking to experience local culture. | Petaluma Adobe State Historic Park, Petaluma Historical Museum, The Great Petaluma Mill, Downtown Petaluma shops |
| Lake Sonoma | A beautiful reservoir surrounded by nature trails and parks, ideal for outdoor enthusiasts and those looking to relax by the water. | Lake Sonoma Recreation Area, Fishhook Beach, Boating and fishing opportunities, Hiking trails around the lake |
Understanding Airbnb License Requirements & STR Laws in Fetters Hot Springs (2026)
With 25% of listings showing registration in 2026, understanding potential Airbnb license requirements is crucial in Fetters Hot Springs. Always verify the latest short term rental regulations and Airbnb license requirements directly with local government authorities for Fetters Hot Springs to ensure full compliance before hosting.
(Source: AirROI data, 2026, based on 25% licensed listings)
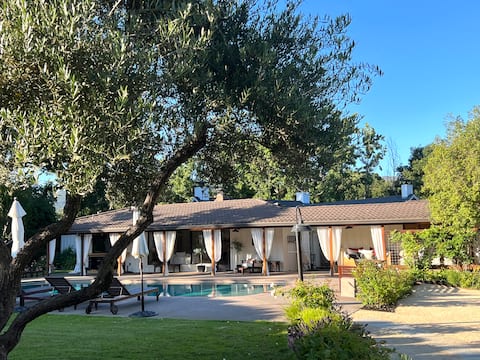
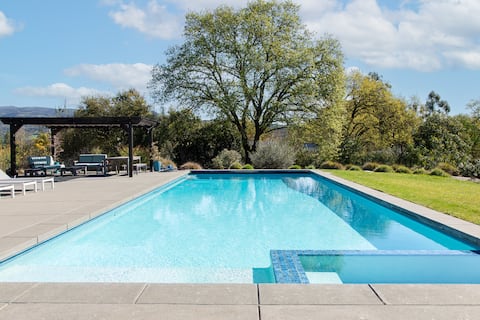
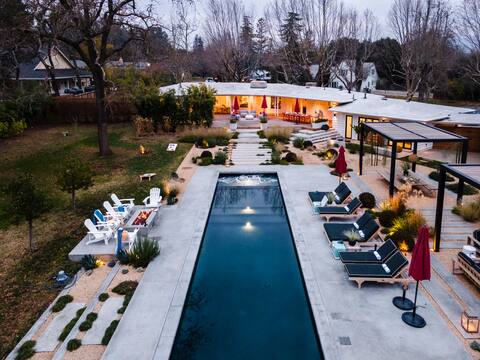
Top Performing Airbnb Properties in Fetters Hot Springs (2026)
Benchmark your potential! Explore examples of top-performing Airbnb properties in Fetters Hot Springsbased on Trailing Twelve Month (TTM) revenue. Analyze their characteristics, revenue, occupancy rate, and ADR to understand what drives success in this market.
Stunning Pool Property Minutes to Downtown Sonoma
Entire Place • 5 bedrooms
Private & peaceful 3 acres, 50ft pool & spa
Entire Place • 4 bedrooms
Marquee By AvantStay | Stylish Estate w/ Pool
Entire Place • 5 bedrooms

Sonoma Hilltop Estate with Spa
Entire Place • 3 bedrooms

Modern wine country stunner with pool & pickleball
Entire Place • 3 bedrooms

Sonoma Country Club Wine Country w/ pool
Entire Place • 3 bedrooms
Note: Performance varies based on location, size, amenities, seasonality, and management quality. Data reflects the past 12 months.
Top Performing Airbnb Hosts in Fetters Hot Springs (2026)
Learn from the best! This table showcases top-performing Airbnb hosts in Fetters Hot Springs based on the number of properties managed and estimated total revenue over the past year. Analyze their scale and performance metrics.
| Host Name | Properties | Grossing Revenue | Stay Reviews | Avg Rating |
|---|---|---|---|---|
| Dream Sonoma Vacation Rentals | 1 | $389,341 | 37 | 4.97/5.0 |
| AvantStay Sonoma | 2 | $374,105 | 192 | 4.79/5.0 |
| Nicole | 1 | $345,443 | 29 | 4.97/5.0 |
| Julie | 2 | $333,961 | 299 | 4.98/5.0 |
| Sandy | 3 | $301,825 | 220 | 4.86/5.0 |
| Malia | 3 | $298,206 | 536 | 4.91/5.0 |
| Woodfield Properties | 3 | $268,942 | 107 | 4.79/5.0 |
| Sonoma Rental Magic | 2 | $221,230 | 139 | 4.96/5.0 |
| Hunt | 1 | $212,065 | 31 | 4.94/5.0 |
| Wine Country Estate Management | 1 | $184,377 | 108 | 4.85/5.0 |
Analyzing the strategies of top hosts, such as their property selection, pricing, and guest communication, can offer valuable lessons for optimizing your own Airbnb operations in Fetters Hot Springs.
Dive Deeper: Advanced Fetters Hot Springs STR Market Data (2026)
Ready to unlock more insights? AirROI provides access to advanced metrics and comprehensive Airbnb data for Fetters Hot Springs. Explore detailed analytics beyond this report to refine your investment strategy, optimize pricing, and maximize your vacation rental profits.
Explore Advanced MetricsFetters Hot Springs Short-Term Rental Market Composition (2026): Property & Room Types
Room Type Distribution
Property Type Distribution
Market Composition Insights for Fetters Hot Springs
- The Fetters Hot Springs Airbnb market composition is heavily skewed towards Entire Home/Apt listings, which make up 94.5% of the 73 active rentals. This indicates strong guest preference for privacy and space.
- Looking at the property type distribution in Fetters Hot Springs, House properties are the most common (76.7%), reflecting the local real estate landscape.
- Houses represent a significant 76.7% portion, catering likely to families or larger groups.
- The presence of 5.5% Hotel/Boutique listings indicates integration with traditional hospitality.
- Smaller segments like outdoor/unique, apartment/condo (combined 5.4%) offer potential for unique stay experiences.
Fetters Hot Springs Airbnb Room Capacity Analysis (2026): Bedroom Distribution
Distribution of Listings by Number of Bedrooms
Room Capacity Insights for Fetters Hot Springs
- The dominant room capacity in Fetters Hot Springs is 3 bedrooms listings, making up 39.7% of the market. This suggests a strong demand for properties suitable for families or small groups.
- Together, 3 bedrooms and 4 bedrooms properties represent 56.1% of the active Airbnb listings in Fetters Hot Springs, indicating a high concentration in these sizes.
- A significant 60.2% of listings offer 3+ bedrooms, catering to larger groups and families seeking more space in Fetters Hot Springs.
Fetters Hot Springs Vacation Rental Guest Capacity Trends (2026)
Distribution of Listings by Guest Capacity
Guest Capacity Insights for Fetters Hot Springs
- The most common guest capacity trend in Fetters Hot Springs vacation rentals is listings accommodating 8+ guests (32.9%). This suggests the primary traveler segment is likely larger groups.
- Properties designed for 8+ guests and 6 guests dominate the Fetters Hot Springs STR market, accounting for 54.8% of listings.
- 56.2% of properties accommodate 6+ guests, serving the market segment for larger families or group travel in Fetters Hot Springs.
- On average, properties in Fetters Hot Springs are equipped to host 5.2 guests.
Fetters Hot Springs Airbnb Booking Patterns (2026): Available vs. Booked Days
Available Days Distribution
Booked Days Distribution
Booking Pattern Insights for Fetters Hot Springs
- The most common availability pattern in Fetters Hot Springs falls within the 181-270 days range, representing 41.1% of listings. This suggests many properties have significant open periods on their calendars.
- Approximately 75.3% of listings show high availability (181+ days open annually), indicating potential for increased bookings or specific owner usage patterns.
- For booked days, the 91-180 days range is most frequent in Fetters Hot Springs (39.7%), reflecting common guest stay durations or potential owner blocking patterns.
- A notable 27.4% of properties secure long booking periods (181+ days booked per year), highlighting successful long-term rental strategies or significant owner usage.
Fetters Hot Springs Airbnb Minimum Stay Requirements Analysis
Distribution of Listings by Minimum Night Requirement
1 Night
5 listings
6.8% of total
2 Nights
20 listings
27.4% of total
3 Nights
7 listings
9.6% of total
4-6 Nights
3 listings
4.1% of total
7-29 Nights
2 listings
2.7% of total
30+ Nights
36 listings
49.3% of total
Key Insights
- The most prevalent minimum stay requirement in Fetters Hot Springs is 30+ Nights, adopted by 49.3% of listings. This highlights the market's preference for longer commitments.
- A significant segment (49.3%) caters to monthly stays (30+ nights) in Fetters Hot Springs, pointing to opportunities in the extended-stay market.
Recommendations
- Align with the market by considering a 30+ Nights minimum stay, as 49.3% of Fetters Hot Springs hosts use this setting.
- If feasible, allowing 1-night stays, especially midweek or during low season, could capture last-minute bookings, as only 6.8% currently do.
- Explore offering discounts for stays of 30+ nights to attract the 49.3% of the market seeking extended stays.
- Adjust minimum nights based on seasonality – potentially shorter during low season and longer during peak demand periods in Fetters Hot Springs.
Fetters Hot Springs Airbnb Cancellation Policy Trends Analysis (2026)
Super Strict 30 Days
3 listings
4.1% of total
Limited
1 listings
1.4% of total
Super Strict 60 Days
3 listings
4.1% of total
Flexible
5 listings
6.8% of total
Moderate
16 listings
21.9% of total
Firm
37 listings
50.7% of total
Strict
8 listings
11% of total
Cancellation Policy Insights for Fetters Hot Springs
- The prevailing Airbnb cancellation policy trend in Fetters Hot Springs is Firm, used by 50.7% of listings.
- A majority (61.7%) of hosts in Fetters Hot Springs utilize Firm or Strict policies, indicating a market where hosts prioritize booking security.
Recommendations for Hosts
- Consider adopting a Firm policy to align with the 50.7% market standard in Fetters Hot Springs.
- Using a Strict policy might deter some guests, as only 11% of listings use it. Evaluate if potential revenue protection outweighs possible lower booking rates.
- Regularly review your cancellation policy against competitors and market demand shifts in Fetters Hot Springs.
Fetters Hot Springs STR Booking Lead Time Analysis (2026)
Average Booking Lead Time by Month
Booking Lead Time Insights for Fetters Hot Springs
- The overall average booking lead time for vacation rentals in Fetters Hot Springs is 68 days.
- Guests book furthest in advance for stays during May (average 82 days), likely coinciding with peak travel demand or local events.
- The shortest booking windows occur for stays in February (average 46 days), indicating more last-minute travel plans during this time.
- Seasonally, Summer (75 days avg.) sees the longest lead times, while Winter (49 days avg.) has the shortest, reflecting typical travel planning cycles.
Recommendations for Hosts
- Use the overall average lead time (68 days) as a baseline for your pricing and availability strategy in Fetters Hot Springs.
- For May stays, consider implementing length-of-stay discounts or slightly higher rates for bookings made less than 82 days out to capitalize on advance planning.
- Target marketing efforts for the Summer season well in advance (at least 75 days) to capture early planners.
- Monitor your own booking lead times against these Fetters Hot Springs averages to identify opportunities for dynamic pricing adjustments.
Popular & Essential Airbnb Amenities in Fetters Hot Springs (2026)
Amenity Prevalence
Amenity Insights for Fetters Hot Springs
- Essential amenities in Fetters Hot Springs that guests expect include: Free parking on premises, Wifi, Essentials, Smoke alarm, Heating, Carbon monoxide alarm. Lacking these (any) could significantly impact bookings.
- Popular amenities like Dishes and silverware, Hangers, Hair dryer are common but not universal. Offering these can provide a competitive edge.
Recommendations for Hosts
- Ensure your listing includes all essential amenities for Fetters Hot Springs: Free parking on premises, Wifi, Essentials, Smoke alarm, Heating, Carbon monoxide alarm.
- Prioritize adding missing essentials: Smoke alarm, Heating, Carbon monoxide alarm.
- Consider adding popular differentiators like Dishes and silverware or Hangers to increase appeal.
- Highlight unique or less common amenities you offer (e.g., hot tub, dedicated workspace, EV charger) in your listing description and photos.
- Regularly check competitor amenities in Fetters Hot Springs to stay competitive.
Fetters Hot Springs Airbnb Guest Demographics & Profile Analysis (2026)
Guest Profile Summary for Fetters Hot Springs
- The typical guest profile for Airbnb in Fetters Hot Springs consists of primarily domestic travelers (96%), often arriving from nearby San Francisco, typically belonging to the Post-2000s (Gen Z/Alpha) group (50%), primarily speaking English or Spanish.
- Domestic travelers account for 95.9% of guests.
- Key international markets include United States (95.9%) and United Kingdom (0.9%).
- Top languages spoken are English (67.2%) followed by Spanish (12.7%).
- A significant demographic segment is the Post-2000s (Gen Z/Alpha) group, representing 50% of guests.
Recommendations for Hosts
- Target domestic marketing efforts towards travelers from San Francisco and Los Angeles.
- Tailor amenities and listing descriptions to appeal to the dominant Post-2000s (Gen Z/Alpha) demographic (e.g., highlight fast WiFi, smart home features, local guides).
- Highlight unique local experiences or amenities relevant to the primary guest profile.
- Consider seasonal promotions aligned with peak travel times for key origin markets.
Nearby Short-Term Rental Market Comparison
How does the Fetters Hot Springs Airbnb market stack up against its neighbors? Compare key performance metrics like average monthly revenue, ADR, and occupancy rates in surrounding areas to understand the broader regional STR landscape.
| Market | Active Properties | Monthly Revenue | Daily Rate | Avg. Occupancy |
|---|---|---|---|---|
| Moss Beach | 34 | $10,092 | $676.91 | 53% |
| Sonoma | 228 | $9,647 | $819.87 | 43% |
| Marshall | 18 | $8,897 | $607.75 | 50% |
| St. Helena | 50 | $8,684 | $924.70 | 38% |
| Kenwood | 60 | $8,643 | $810.83 | 41% |
| Glen Ellen | 85 | $8,482 | $799.53 | 43% |
| Eldridge | 21 | $8,410 | $930.61 | 41% |
| Dillon Beach | 82 | $8,062 | $703.26 | 41% |
| Stinson Beach | 106 | $7,814 | $812.15 | 43% |
| Healdsburg | 195 | $7,538 | $744.46 | 41% |