Fresno Airbnb Market Analysis 2026: Short Term Rental Data & Vacation Rental Statistics in California, United States
Is Airbnb profitable in Fresno in 2026? Explore comprehensive Airbnb analytics for Fresno, California, United States to uncover income potential. This 2026 STR market report for Fresno, based on AirROI data from February 2025 to January 2026, reveals key trends in the market of 705 active listings.
Whether you're considering an Airbnb investment in Fresno, optimizing your existing vacation rental, or exploring rental arbitrage opportunities, understanding the Fresno Airbnb data is crucial. Understanding the local regulations is key to maximizing your short term rental income potential. Let's dive into the specifics.
Key Fresno Airbnb Performance Metrics Overview
Monthly Airbnb Revenue Variations & Income Potential in Fresno (2026)
Understanding the monthly revenue variations for Airbnb listings in Fresno is key to maximizing your short term rental income potential. Seasonality significantly impacts earnings. Our analysis, based on data from the past 12 months, shows that the peak revenue month for STRs in Fresno is typically May, while January often presents the lowest earnings, highlighting opportunities for strategic pricing adjustments during shoulder and low seasons. Explore the typical Airbnb income in Fresno across different performance tiers:
- Best-in-class properties (Top 10%) achieve $5,221+ monthly, often utilizing dynamic pricing and superior guest experiences.
- Strong performing properties (Top 25%) earn $3,528 or more, indicating effective management and desirable locations/amenities.
- Typical properties (Median) generate around $1,907 per month, representing the average market performance.
- Entry-level properties (Bottom 25%) see earnings around $758, often with potential for optimization.
Average Monthly Airbnb Earnings Trend in Fresno
Fresno Airbnb Occupancy Rate Trends (2026)
Maximize your bookings by understanding the Fresno STR occupancy trends. Seasonal demand shifts significantly influence how often properties are booked. Typically, Marchsees the highest demand (peak season occupancy), while January experiences the lowest (low season). Effective strategies, like adjusting minimum stays or offering promotions, can boost occupancy during slower periods. Here's how different property tiers perform in Fresno:
- Best-in-class properties (Top 10%) achieve 81%+ occupancy, indicating high desirability and potentially optimized availability.
- Strong performing properties (Top 25%) maintain 67% or higher occupancy, suggesting good market fit and guest satisfaction.
- Typical properties (Median) have an occupancy rate around 44%.
- Entry-level properties (Bottom 25%) average 23% occupancy, potentially facing higher vacancy.
Average Monthly Occupancy Rate Trend in Fresno
Average Daily Rate (ADR) Airbnb Trends in Fresno (2026)
Effective short term rental pricing strategy in Fresno involves understanding monthly ADR fluctuations. The Average Daily Rate (ADR) for Airbnb in Fresno typically peaks in October and dips lowest during February. Leveraging Airbnb dynamic pricing tools or strategies based on this seasonality can significantly boost revenue. Here's a look at the typical nightly rates achieved:
- Best-in-class properties (Top 10%) command rates of $285+ per night, often due to premium features or locations.
- Strong performing properties (Top 25%) achieve nightly rates of $199 or more.
- Typical properties (Median) charge around $129 per night.
- Entry-level properties (Bottom 25%) earn around $69 per night.
Average Daily Rate (ADR) Trend by Month in Fresno
Get Live Fresno Market Intelligence 👇

Explore Real-time Analytics
Airbnb Seasonality Analysis & Trends in Fresno (2026)
Peak Season (May, June, July)
- Revenue averages $2,839 per month
- Occupancy rates average 48.5%
- Daily rates average $153
Shoulder Season
- Revenue averages $2,477 per month
- Occupancy maintains around 46.3%
- Daily rates hold near $151
Low Season (January, February, November)
- Revenue drops to average $1,926 per month
- Occupancy decreases to average 40.1%
- Daily rates adjust to average $146
Seasonality Insights for Fresno
- The Airbnb seasonality in Fresno shows moderate seasonality with distinct peak and low periods. While the sections above show seasonal averages, it's also insightful to look at the extremes:
- During the high season, the absolute peak month showcases Fresno's highest earning potential, with monthly revenues capable of climbing to $2,888, occupancy reaching a high of 49.1%, and ADRs peaking at $159.
- Conversely, the slowest single month of the year, typically falling within the low season, marks the market's lowest point. In this month, revenue might dip to $1,769, occupancy could drop to 34.7%, and ADRs may adjust down to $130.
- Understanding both the seasonal averages and these monthly peaks and troughs in revenue, occupancy, and ADR is crucial for maximizing your Airbnb profit potential in Fresno.
Seasonal Strategies for Maximizing Profit
- Peak Season: Maximize revenue through premium pricing and potentially longer minimum stays. Ensure high availability.
- Low Season: Offer competitive pricing, special promotions (e.g., extended stay discounts), and flexible cancellation policies. Target off-season travelers like remote workers or budget-conscious guests.
- Shoulder Seasons: Implement dynamic pricing that balances peak and low rates. Target weekend travelers or specific events. Offer slightly more flexible terms than peak season.
- Regularly analyze your own performance against these Fresno seasonality benchmarks and adjust your pricing and availability strategy accordingly.
Best Areas for Airbnb Investment in Fresno (2026)
Exploring the top neighborhoods for short-term rentals in Fresno? This section highlights key areas, outlining why they are attractive for hosts and guests, along with notable local attractions. Consider these locations based on your target guest profile and investment strategy.
| Neighborhood / Area | Why Host Here? (Target Guests & Appeal) | Key Attractions & Landmarks |
|---|---|---|
| North Fresno | A family-friendly area known for its excellent schools, parks, and shopping. Popular with families and business travelers seeking a suburban experience close to amenities. | Woodward Park, Fashion Fair Mall, River Park Shopping Center, Fresno Art Museum, Woodward Lake |
| Clovis | Charming suburb of Fresno known for its tight-knit community and historic Old Town. Attracts visitors looking for a more local experience with access to dining and outdoor activities. | Old Town Clovis, Clovis Farmer's Market, Sierra Vista Mall, Clovis Botanical Garden, Broadway Street shops |
| Downtown Fresno | The revitalized urban core with a mix of dining, nightlife, and cultural venues. Ideal for young professionals and travelers wanting to experience the city's metropolitan vibe. | Fresno Chaffee Zoo, Fresno Convention Center, Tower Theatre, The Historic Water Tower, Full Circle Brewery |
| Fig Garden | An upscale residential neighborhood with beautiful homes and proximity to parks and recreation. Appeals to guests looking for a quiet, elegant stay. | Fig Garden Shopping Center, Ashlan Park, Woodward Park, Smittcamp Family Rose Garden, Palm Avenue']},{ |
| Sanger | A small town east of Fresno known for its agricultural roots and close-knit community. Excellent for guests seeking an authentic Central Valley experience. | Sanger Depot, Peckham Park, Sanger High School Football Field, Sanger Historical Society, Fresno County Blossom Trail |
| Fowler | A quaint town with rich agriculture and community feel. Suitable for visitors who want a peaceful retreat and to explore nearby vineyards and farms. | Fowler Historical Society, The Fowler Avenue, Reedley River Parkway, Fowler City Park, Local farms and markets |
| Pinedale | A suburban neighborhood that offers both residential areas and space for recreational activities. A good option for families and outdoor enthusiasts. | Pinedale Shopping Center, Pinedale Park, Riverside Golf Course, Cedar Point Sports Center, Nearby hiking trails |
| Easton | A small unincorporated community in Fresno County that offers visitors a quiet getaway while being close to the larger city. Great for those looking for rural experiences. | Easton Community Park, Local farms, Close proximity to Kerman, Cultural local events, Central Valley activities |
Understanding Airbnb License Requirements & STR Laws in Fresno (2026)
With 10% of listings showing registration in 2026, understanding potential Airbnb license requirements is crucial in Fresno. Always verify the latest short term rental regulations and Airbnb license requirements directly with local government authorities for Fresno to ensure full compliance before hosting.
(Source: AirROI data, 2026, based on 10% licensed listings)
Top Performing Airbnb Properties in Fresno (2026)
Benchmark your potential! Explore examples of top-performing Airbnb properties in Fresnobased on Trailing Twelve Month (TTM) revenue. Analyze their characteristics, revenue, occupancy rate, and ADR to understand what drives success in this market.

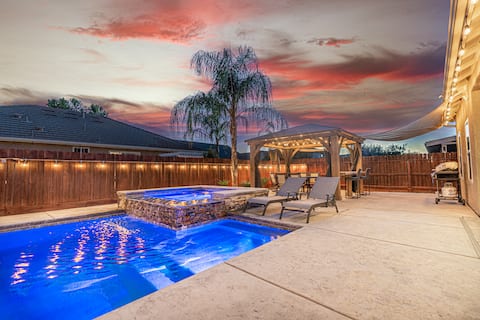
Mid-Century Modern Oasis • Pool • Spa
Entire Place • 3 bedrooms
5BR Oasis • Heated Pool Option + Hot Tub
Entire Place • 5 bedrooms
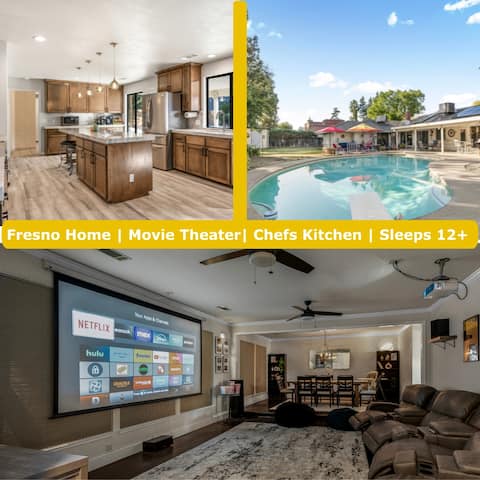
Fresno Movie Theater House w/pool!
Entire Place • 4 bedrooms

Modern Backyard Oasis Pool Spa 4B2B Chefs Kitchen
Entire Place • 4 bedrooms
Cozy 6-Bedroom home perfect for large groups
Entire Place • 6 bedrooms

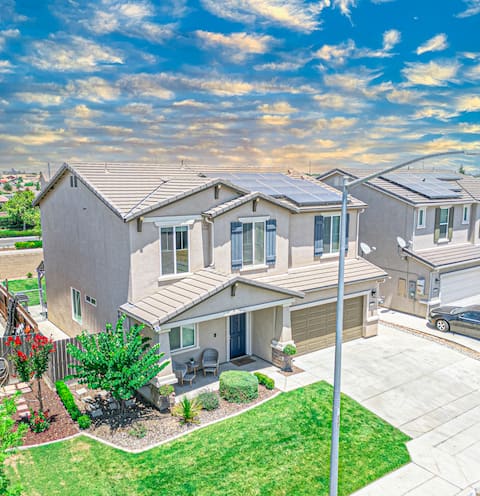
Spacious two-story newer family home
Entire Place • 5 bedrooms
Note: Performance varies based on location, size, amenities, seasonality, and management quality. Data reflects the past 12 months.
Top Performing Airbnb Hosts in Fresno (2026)
Learn from the best! This table showcases top-performing Airbnb hosts in Fresno based on the number of properties managed and estimated total revenue over the past year. Analyze their scale and performance metrics.
| Host Name | Properties | Grossing Revenue | Stay Reviews | Avg Rating |
|---|---|---|---|---|
| Kyle | 31 | $1,025,929 | 2138 | 4.85/5.0 |
| Masato | 26 | $708,811 | 3372 | 4.89/5.0 |
| Kyle | 28 | $708,366 | 1651 | 4.83/5.0 |
| Nader | 7 | $476,245 | 448 | 4.93/5.0 |
| Leigh | 11 | $417,980 | 1928 | 4.94/5.0 |
| Jason | 13 | $349,223 | 515 | 4.65/5.0 |
| Emilio | 5 | $275,160 | 689 | 4.91/5.0 |
| Rosa | 3 | $260,390 | 499 | 4.91/5.0 |
| Tania | 2 | $211,952 | 319 | 5.00/5.0 |
| Makai | 8 | $161,213 | 289 | 4.47/5.0 |
Analyzing the strategies of top hosts, such as their property selection, pricing, and guest communication, can offer valuable lessons for optimizing your own Airbnb operations in Fresno.
Dive Deeper: Advanced Fresno STR Market Data (2026)
Ready to unlock more insights? AirROI provides access to advanced metrics and comprehensive Airbnb data for Fresno. Explore detailed analytics beyond this report to refine your investment strategy, optimize pricing, and maximize your vacation rental profits.
Explore Advanced MetricsFresno Short-Term Rental Market Composition (2026): Property & Room Types
Room Type Distribution
Property Type Distribution
Market Composition Insights for Fresno
- The Fresno Airbnb market composition is heavily skewed towards Entire Home/Apt listings, which make up 73.5% of the 705 active rentals. This indicates strong guest preference for privacy and space.
- Looking at the property type distribution in Fresno, House properties are the most common (78%), reflecting the local real estate landscape.
- Houses represent a significant 78% portion, catering likely to families or larger groups.
- The presence of 5.7% Hotel/Boutique listings indicates integration with traditional hospitality.
- Smaller segments like others, outdoor/unique, unique stays (combined 5.8%) offer potential for unique stay experiences.
Fresno Airbnb Room Capacity Analysis (2026): Bedroom Distribution
Distribution of Listings by Number of Bedrooms
Room Capacity Insights for Fresno
- The dominant room capacity in Fresno is 3 bedrooms listings, making up 27.2% of the market. This suggests a strong demand for properties suitable for families or small groups.
- Together, 3 bedrooms and 1 bedroom properties represent 45.4% of the active Airbnb listings in Fresno, indicating a high concentration in these sizes.
- A significant 44.5% of listings offer 3+ bedrooms, catering to larger groups and families seeking more space in Fresno.
Fresno Vacation Rental Guest Capacity Trends (2026)
Distribution of Listings by Guest Capacity
Guest Capacity Insights for Fresno
- The most common guest capacity trend in Fresno vacation rentals is listings accommodating 8+ guests (30.5%). This suggests the primary traveler segment is likely larger groups.
- Properties designed for 8+ guests and 2 guests dominate the Fresno STR market, accounting for 41.0% of listings.
- 44.7% of properties accommodate 6+ guests, serving the market segment for larger families or group travel in Fresno.
- On average, properties in Fresno are equipped to host 4.4 guests.
Fresno Airbnb Booking Patterns (2026): Available vs. Booked Days
Available Days Distribution
Booked Days Distribution
Booking Pattern Insights for Fresno
- The most common availability pattern in Fresno falls within the 271-366 days range, representing 41.4% of listings. This suggests many properties have significant open periods on their calendars.
- Approximately 73.5% of listings show high availability (181+ days open annually), indicating potential for increased bookings or specific owner usage patterns.
- For booked days, the 91-180 days range is most frequent in Fresno (32.6%), reflecting common guest stay durations or potential owner blocking patterns.
- A notable 27.8% of properties secure long booking periods (181+ days booked per year), highlighting successful long-term rental strategies or significant owner usage.
Fresno Airbnb Minimum Stay Requirements Analysis
Distribution of Listings by Minimum Night Requirement
1 Night
252 listings
35.7% of total
2 Nights
174 listings
24.7% of total
3 Nights
30 listings
4.3% of total
4-6 Nights
31 listings
4.4% of total
7-29 Nights
61 listings
8.7% of total
30+ Nights
157 listings
22.3% of total
Key Insights
- The most prevalent minimum stay requirement in Fresno is 1 Night, adopted by 35.7% of listings. This highlights the market's preference for shorter, flexible bookings.
- A strong majority (60.4%) of the Fresno Airbnb data shows acceptance of very short stays (1-2 nights), indicating a dynamic, high-turnover market.
- A significant segment (22.3%) caters to monthly stays (30+ nights) in Fresno, pointing to opportunities in the extended-stay market.
Recommendations
- Align with the market by considering a 1 Night minimum stay, as 35.7% of Fresno hosts use this setting.
- Explore offering discounts for stays of 30+ nights to attract the 22.3% of the market seeking extended stays.
- Adjust minimum nights based on seasonality – potentially shorter during low season and longer during peak demand periods in Fresno.
Fresno Airbnb Cancellation Policy Trends Analysis (2026)
Limited
8 listings
1.1% of total
Flexible
155 listings
22% of total
Moderate
270 listings
38.4% of total
Firm
188 listings
26.7% of total
Strict
83 listings
11.8% of total
Cancellation Policy Insights for Fresno
- The prevailing Airbnb cancellation policy trend in Fresno is Moderate, used by 38.4% of listings.
- There's a relatively balanced mix between guest-friendly (60.4%) and stricter (38.5%) policies, offering choices for different guest needs.
Recommendations for Hosts
- Consider adopting a Moderate policy to align with the 38.4% market standard in Fresno.
- Using a Strict policy might deter some guests, as only 11.8% of listings use it. Evaluate if potential revenue protection outweighs possible lower booking rates.
- Regularly review your cancellation policy against competitors and market demand shifts in Fresno.
Fresno STR Booking Lead Time Analysis (2026)
Average Booking Lead Time by Month
Booking Lead Time Insights for Fresno
- The overall average booking lead time for vacation rentals in Fresno is 23 days.
- Guests book furthest in advance for stays during November (average 31 days), likely coinciding with peak travel demand or local events.
- The shortest booking windows occur for stays in January (average 16 days), indicating more last-minute travel plans during this time.
- Seasonally, Fall (28 days avg.) sees the longest lead times, while Winter (20 days avg.) has the shortest, reflecting typical travel planning cycles.
Recommendations for Hosts
- Use the overall average lead time (23 days) as a baseline for your pricing and availability strategy in Fresno.
- Target marketing efforts for the Fall season well in advance (at least 28 days) to capture early planners.
- Monitor your own booking lead times against these Fresno averages to identify opportunities for dynamic pricing adjustments.
Popular & Essential Airbnb Amenities in Fresno (2026)
Amenity Prevalence
Amenity Insights for Fresno
- Essential amenities in Fresno that guests expect include: Air conditioning, Wifi, Smoke alarm, TV. Lacking these (any) could significantly impact bookings.
- Popular amenities like Carbon monoxide alarm, Heating, Hot water are common but not universal. Offering these can provide a competitive edge.
Recommendations for Hosts
- Ensure your listing includes all essential amenities for Fresno: Air conditioning, Wifi, Smoke alarm, TV.
- Prioritize adding missing essentials: Air conditioning, Wifi, Smoke alarm, TV.
- Consider adding popular differentiators like Carbon monoxide alarm or Heating to increase appeal.
- Highlight unique or less common amenities you offer (e.g., hot tub, dedicated workspace, EV charger) in your listing description and photos.
- Regularly check competitor amenities in Fresno to stay competitive.
Fresno Airbnb Guest Demographics & Profile Analysis (2026)
Guest Profile Summary for Fresno
- The typical guest profile for Airbnb in Fresno consists of primarily domestic travelers (93%), often arriving from nearby Fresno, typically belonging to the Post-2000s (Gen Z/Alpha) group (50%), primarily speaking English or Spanish.
- Domestic travelers account for 93.3% of guests.
- Key international markets include United States (93.3%) and Canada (0.9%).
- Top languages spoken are English (62.3%) followed by Spanish (20%).
- A significant demographic segment is the Post-2000s (Gen Z/Alpha) group, representing 50% of guests.
Recommendations for Hosts
- Target domestic marketing efforts towards travelers from Fresno and Los Angeles.
- Tailor amenities and listing descriptions to appeal to the dominant Post-2000s (Gen Z/Alpha) demographic (e.g., highlight fast WiFi, smart home features, local guides).
- Highlight unique local experiences or amenities relevant to the primary guest profile.
- Consider seasonal promotions aligned with peak travel times for key origin markets.
Nearby Short-Term Rental Market Comparison
How does the Fresno Airbnb market stack up against its neighbors? Compare key performance metrics like average monthly revenue, ADR, and occupancy rates in surrounding areas to understand the broader regional STR landscape.
| Market | Active Properties | Monthly Revenue | Daily Rate | Avg. Occupancy |
|---|---|---|---|---|
| Wawona | 66 | $7,186 | $548.44 | 45% |
| Yosemite National Park | 227 | $6,835 | $511.03 | 44% |
| Avila Beach | 94 | $6,770 | $582.34 | 41% |
| Yosemite West | 29 | $5,597 | $423.79 | 49% |
| Three Rivers | 407 | $5,504 | $387.06 | 50% |
| Templeton | 159 | $5,070 | $541.75 | 38% |
| San Luis Obispo | 319 | $4,877 | $391.84 | 48% |
| Paso Robles | 690 | $4,837 | $449.42 | 39% |
| Lone Pine | 33 | $4,810 | $274.42 | 55% |
| Cayucos | 186 | $4,743 | $438.93 | 42% |