GlenOak Hills Airbnb Market Analysis 2026: Short Term Rental Data & Vacation Rental Statistics in California, United States
Is Airbnb profitable in GlenOak Hills in 2026? Explore comprehensive Airbnb analytics for GlenOak Hills, California, United States to uncover income potential. This 2026 STR market report for GlenOak Hills, based on AirROI data from February 2025 to January 2026, reveals key trends in the niche market of 41 active listings.
Whether you're considering an Airbnb investment in GlenOak Hills, optimizing your existing vacation rental, or exploring rental arbitrage opportunities, understanding the GlenOak Hills Airbnb data is crucial. Leveraging the low regulation environment is key to maximizing your short term rental income potential. Let's dive into the specifics.
Key GlenOak Hills Airbnb Performance Metrics Overview
Monthly Airbnb Revenue Variations & Income Potential in GlenOak Hills (2026)
Understanding the monthly revenue variations for Airbnb listings in GlenOak Hills is key to maximizing your short term rental income potential. Seasonality significantly impacts earnings. Our analysis, based on data from the past 12 months, shows that the peak revenue month for STRs in GlenOak Hills is typically June, while February often presents the lowest earnings, highlighting opportunities for strategic pricing adjustments during shoulder and low seasons. Explore the typical Airbnb income in GlenOak Hills across different performance tiers:
- Best-in-class properties (Top 10%) achieve $17,418+ monthly, often utilizing dynamic pricing and superior guest experiences.
- Strong performing properties (Top 25%) earn $11,626 or more, indicating effective management and desirable locations/amenities.
- Typical properties (Median) generate around $7,560 per month, representing the average market performance.
- Entry-level properties (Bottom 25%) see earnings around $4,441, often with potential for optimization.
Average Monthly Airbnb Earnings Trend in GlenOak Hills
GlenOak Hills Airbnb Occupancy Rate Trends (2026)
Maximize your bookings by understanding the GlenOak Hills STR occupancy trends. Seasonal demand shifts significantly influence how often properties are booked. Typically, Octobersees the highest demand (peak season occupancy), while January experiences the lowest (low season). Effective strategies, like adjusting minimum stays or offering promotions, can boost occupancy during slower periods. Here's how different property tiers perform in GlenOak Hills:
- Best-in-class properties (Top 10%) achieve 68%+ occupancy, indicating high desirability and potentially optimized availability.
- Strong performing properties (Top 25%) maintain 54% or higher occupancy, suggesting good market fit and guest satisfaction.
- Typical properties (Median) have an occupancy rate around 40%.
- Entry-level properties (Bottom 25%) average 28% occupancy, potentially facing higher vacancy.
Average Monthly Occupancy Rate Trend in GlenOak Hills
Average Daily Rate (ADR) Airbnb Trends in GlenOak Hills (2026)
Effective short term rental pricing strategy in GlenOak Hills involves understanding monthly ADR fluctuations. The Average Daily Rate (ADR) for Airbnb in GlenOak Hills typically peaks in June and dips lowest during February. Leveraging Airbnb dynamic pricing tools or strategies based on this seasonality can significantly boost revenue. Here's a look at the typical nightly rates achieved:
- Best-in-class properties (Top 10%) command rates of $1,139+ per night, often due to premium features or locations.
- Strong performing properties (Top 25%) achieve nightly rates of $844 or more.
- Typical properties (Median) charge around $568 per night.
- Entry-level properties (Bottom 25%) earn around $342 per night.
Average Daily Rate (ADR) Trend by Month in GlenOak Hills
Get Live GlenOak Hills Market Intelligence 👇

Explore Real-time Analytics
Airbnb Seasonality Analysis & Trends in GlenOak Hills (2026)
Peak Season (June, July, May)
- Revenue averages $11,773 per month
- Occupancy rates average 47.8%
- Daily rates average $672
Shoulder Season
- Revenue averages $9,117 per month
- Occupancy maintains around 45.4%
- Daily rates hold near $622
Low Season (January, February, December)
- Revenue drops to average $5,561 per month
- Occupancy decreases to average 31.5%
- Daily rates adjust to average $602
Seasonality Insights for GlenOak Hills
- The Airbnb seasonality in GlenOak Hills shows highly seasonal trends requiring careful strategy. While the sections above show seasonal averages, it's also insightful to look at the extremes:
- During the high season, the absolute peak month showcases GlenOak Hills's highest earning potential, with monthly revenues capable of climbing to $12,032, occupancy reaching a high of 52.0%, and ADRs peaking at $686.
- Conversely, the slowest single month of the year, typically falling within the low season, marks the market's lowest point. In this month, revenue might dip to $4,369, occupancy could drop to 25.1%, and ADRs may adjust down to $544.
- Understanding both the seasonal averages and these monthly peaks and troughs in revenue, occupancy, and ADR is crucial for maximizing your Airbnb profit potential in GlenOak Hills.
Seasonal Strategies for Maximizing Profit
- Peak Season: Maximize revenue through premium pricing and potentially longer minimum stays. Ensure high availability.
- Low Season: Offer competitive pricing, special promotions (e.g., extended stay discounts), and flexible cancellation policies. Target off-season travelers like remote workers or budget-conscious guests.
- Shoulder Seasons: Implement dynamic pricing that balances peak and low rates. Target weekend travelers or specific events. Offer slightly more flexible terms than peak season.
- Regularly analyze your own performance against these GlenOak Hills seasonality benchmarks and adjust your pricing and availability strategy accordingly.
Best Areas for Airbnb Investment in GlenOak Hills (2026)
Exploring the top neighborhoods for short-term rentals in GlenOak Hills? This section highlights key areas, outlining why they are attractive for hosts and guests, along with notable local attractions. Consider these locations based on your target guest profile and investment strategy.
| Neighborhood / Area | Why Host Here? (Target Guests & Appeal) | Key Attractions & Landmarks |
|---|---|---|
| GlenOak Hills | A serene and peaceful community surrounded by nature, perfect for those seeking a tranquil getaway. Close enough to urban amenities while being immersed in a beautiful natural setting. | Local hiking trails, Scenic views of the surrounding mountains, Proximity to local wineries and vineyards, Outdoor recreational activities, Natural parks nearby |
| GlenOak Vista | Known for its scenic overlooks and spacious properties, this area attracts families and groups looking for spacious accommodations and breathtaking views. | GlenOak Vista Overlook, Nearby state parks, Family-friendly hiking options, Local picnic areas, Community events |
| GlenOak Estates | A prestigious neighborhood with upscale homes offering privacy and luxury, ideal for those looking for an elite Airbnb experience. | Luxury shopping, Gourmet dining options, Private golf courses, Spa and wellness centers, High-end entertainment facilities |
| Sunset Ridge | Featuring stunning sunsets and close proximity to various outdoor activities, Sunset Ridge is ideal for nature lovers and adventure seekers. | Sunset Ridge Hiking Trails, Outdoor adventure sports, Picnic spots, Horseback riding, Birdwatching |
| GlenOak Knolls | A quiet and family-friendly area that provides an ideal escape for families and those looking for a peaceful retreat with facilities. | Community parks, Children’s playgrounds, Family-oriented events, Local farmer's market, Great for nature walks |
| Wooded Glen | This area offers a cozy, wooded atmosphere, perfect for quiet retreats and romantic getaways. | Wooded walking paths, Intimate dining spots, Nature observation points, Art and craft fairs, Seasonal festivals |
| GlenBrooke | An up-and-coming area known for its charm and community feel, appealing to travelers looking for a local experience. | Community art installations, Local cafes and shops, Cultural festivals, Tranquil park areas, Friendly neighborhood atmosphere |
| LakeView Heights | With views overlooking water bodies and lush greenery, this area offers a picturesque setting for tourists seeking relaxation. | Lakeside parks, Fishing opportunities, Picnic areas, Water sports, Biking trails along the lake |
Understanding Airbnb License Requirements & STR Laws in GlenOak Hills (2026)
While GlenOak Hills, California, United States currently shows low STR regulations, specific Airbnb license requirements might still exist or change. Always verify the latest short term rental regulations and Airbnb license requirements directly with local government authorities for GlenOak Hills to ensure full compliance before hosting.
(Source: AirROI data, 2026, finding no licensed listings among those analyzed)
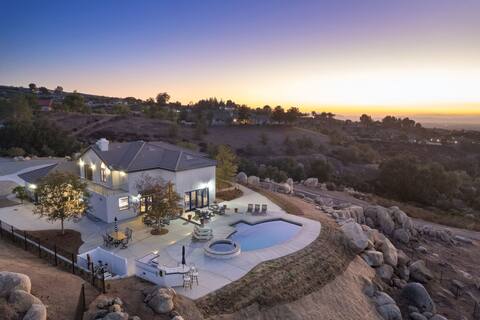
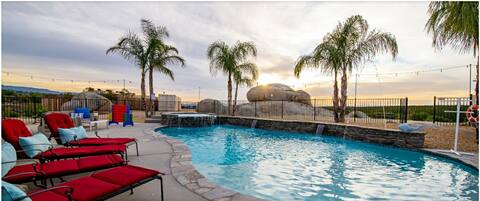
Top Performing Airbnb Properties in GlenOak Hills (2026)
Benchmark your potential! Explore examples of top-performing Airbnb properties in GlenOak Hillsbased on Trailing Twelve Month (TTM) revenue. Analyze their characteristics, revenue, occupancy rate, and ADR to understand what drives success in this market.

WATER SLIDE & Grotto, Heated pool game room, GOLF
Entire Place • 5 bedrooms
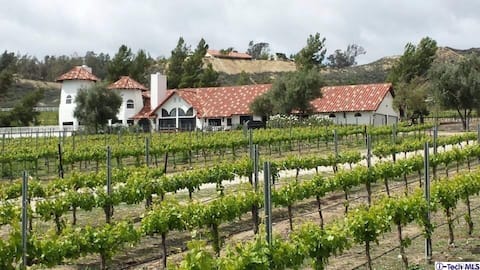
Original Keyways Winery Estate Home
Entire Place • 8 bedrooms
Chateau Evie James - High End Luxury Home w/POOL
Entire Place • 5 bedrooms
Luxurious Mansion in Wine Country
Entire Place • 6 bedrooms

Vineyard Chateau Sanctuary | Sauna | Tennis | Pool
Entire Place • 5 bedrooms

Le Grand Bleu by AvantStay | Luxury Hilltop Estate
Entire Place • 5 bedrooms
Note: Performance varies based on location, size, amenities, seasonality, and management quality. Data reflects the past 12 months.
Top Performing Airbnb Hosts in GlenOak Hills (2026)
Learn from the best! This table showcases top-performing Airbnb hosts in GlenOak Hills based on the number of properties managed and estimated total revenue over the past year. Analyze their scale and performance metrics.
| Host Name | Properties | Grossing Revenue | Stay Reviews | Avg Rating |
|---|---|---|---|---|
| AvantStay Temecula | 3 | $403,575 | 160 | 4.77/5.0 |
| Leisure Home | 4 | $344,947 | 379 | 4.72/5.0 |
| Jessica At Woldenga’s Wine Cou | 1 | $260,524 | 174 | 4.95/5.0 |
| Nesreen | 1 | $240,579 | 88 | 4.91/5.0 |
| Hi-Desert Dwellings | 1 | $213,665 | 98 | 4.99/5.0 |
| Mary Kate With Lotustay | 1 | $207,653 | 177 | 4.98/5.0 |
| Wei-On | 1 | $153,290 | 26 | 4.85/5.0 |
| Jerry | 1 | $143,336 | 142 | 4.96/5.0 |
| Andrew | 2 | $127,685 | 103 | 4.99/5.0 |
| David | 1 | $127,378 | 138 | 4.80/5.0 |
Analyzing the strategies of top hosts, such as their property selection, pricing, and guest communication, can offer valuable lessons for optimizing your own Airbnb operations in GlenOak Hills.
Dive Deeper: Advanced GlenOak Hills STR Market Data (2026)
Ready to unlock more insights? AirROI provides access to advanced metrics and comprehensive Airbnb data for GlenOak Hills. Explore detailed analytics beyond this report to refine your investment strategy, optimize pricing, and maximize your vacation rental profits.
Explore Advanced MetricsGlenOak Hills Short-Term Rental Market Composition (2026): Property & Room Types
Room Type Distribution
Property Type Distribution
Market Composition Insights for GlenOak Hills
- The GlenOak Hills Airbnb market composition is heavily skewed towards Entire Home/Apt listings, which make up 100% of the 41 active rentals. This indicates strong guest preference for privacy and space.
- Looking at the property type distribution in GlenOak Hills, House properties are the most common (75.6%), reflecting the local real estate landscape.
- Houses represent a significant 75.6% portion, catering likely to families or larger groups.
- The presence of 7.3% Hotel/Boutique listings indicates integration with traditional hospitality.
- Smaller segments like apartment/condo (combined 2.4%) offer potential for unique stay experiences.
GlenOak Hills Airbnb Room Capacity Analysis (2026): Bedroom Distribution
Distribution of Listings by Number of Bedrooms
Room Capacity Insights for GlenOak Hills
- The dominant room capacity in GlenOak Hills is 5+ bedrooms listings, making up 46.3% of the market. This suggests a strong demand for properties suitable for families or small groups.
- Together, 5+ bedrooms and 1 bedroom properties represent 73.1% of the active Airbnb listings in GlenOak Hills, indicating a high concentration in these sizes.
- A significant 68.3% of listings offer 3+ bedrooms, catering to larger groups and families seeking more space in GlenOak Hills.
GlenOak Hills Vacation Rental Guest Capacity Trends (2026)
Distribution of Listings by Guest Capacity
Guest Capacity Insights for GlenOak Hills
- The most common guest capacity trend in GlenOak Hills vacation rentals is listings accommodating 8+ guests (65.9%). This suggests the primary traveler segment is likely larger groups.
- Properties designed for 8+ guests and 2 guests dominate the GlenOak Hills STR market, accounting for 80.5% of listings.
- 70.8% of properties accommodate 6+ guests, serving the market segment for larger families or group travel in GlenOak Hills.
- On average, properties in GlenOak Hills are equipped to host 6.4 guests.
GlenOak Hills Airbnb Booking Patterns (2026): Available vs. Booked Days
Available Days Distribution
Booked Days Distribution
Booking Pattern Insights for GlenOak Hills
- The most common availability pattern in GlenOak Hills falls within the 181-270 days range, representing 58.5% of listings. This suggests many properties have significant open periods on their calendars.
- Approximately 82.9% of listings show high availability (181+ days open annually), indicating potential for increased bookings or specific owner usage patterns.
- For booked days, the 91-180 days range is most frequent in GlenOak Hills (61%), reflecting common guest stay durations or potential owner blocking patterns.
- A notable 17.0% of properties secure long booking periods (181+ days booked per year), highlighting successful long-term rental strategies or significant owner usage.
GlenOak Hills Airbnb Minimum Stay Requirements Analysis
Distribution of Listings by Minimum Night Requirement
1 Night
7 listings
17.1% of total
2 Nights
18 listings
43.9% of total
3 Nights
2 listings
4.9% of total
7-29 Nights
1 listings
2.4% of total
30+ Nights
13 listings
31.7% of total
Key Insights
- The most prevalent minimum stay requirement in GlenOak Hills is 2 Nights, adopted by 43.9% of listings. This highlights the market's preference for shorter, flexible bookings.
- A strong majority (61.0%) of the GlenOak Hills Airbnb data shows acceptance of very short stays (1-2 nights), indicating a dynamic, high-turnover market.
- A significant segment (31.7%) caters to monthly stays (30+ nights) in GlenOak Hills, pointing to opportunities in the extended-stay market.
Recommendations
- Align with the market by considering a 2 Nights minimum stay, as 43.9% of GlenOak Hills hosts use this setting.
- If feasible, allowing 1-night stays, especially midweek or during low season, could capture last-minute bookings, as only 17.1% currently do.
- A 2-night minimum appears standard (43.9%). Consider this for weekends or peak periods.
- Explore offering discounts for stays of 30+ nights to attract the 31.7% of the market seeking extended stays.
- Adjust minimum nights based on seasonality – potentially shorter during low season and longer during peak demand periods in GlenOak Hills.
GlenOak Hills Airbnb Cancellation Policy Trends Analysis (2026)
Super Strict 60 Days
1 listings
2.4% of total
Flexible
3 listings
7.3% of total
Moderate
10 listings
24.4% of total
Firm
23 listings
56.1% of total
Strict
4 listings
9.8% of total
Cancellation Policy Insights for GlenOak Hills
- The prevailing Airbnb cancellation policy trend in GlenOak Hills is Firm, used by 56.1% of listings.
- A majority (65.9%) of hosts in GlenOak Hills utilize Firm or Strict policies, indicating a market where hosts prioritize booking security.
- Strict cancellation policies are quite rare (9.8%), potentially making listings with this policy less competitive unless justified by high demand or property type.
Recommendations for Hosts
- Consider adopting a Firm policy to align with the 56.1% market standard in GlenOak Hills.
- Using a Strict policy might deter some guests, as only 9.8% of listings use it. Evaluate if potential revenue protection outweighs possible lower booking rates.
- Regularly review your cancellation policy against competitors and market demand shifts in GlenOak Hills.
GlenOak Hills STR Booking Lead Time Analysis (2026)
Average Booking Lead Time by Month
Booking Lead Time Insights for GlenOak Hills
- The overall average booking lead time for vacation rentals in GlenOak Hills is 60 days.
- Guests book furthest in advance for stays during May (average 84 days), likely coinciding with peak travel demand or local events.
- The shortest booking windows occur for stays in January (average 46 days), indicating more last-minute travel plans during this time.
- Seasonally, Summer (72 days avg.) sees the longest lead times, while Winter (51 days avg.) has the shortest, reflecting typical travel planning cycles.
Recommendations for Hosts
- Use the overall average lead time (60 days) as a baseline for your pricing and availability strategy in GlenOak Hills.
- For May stays, consider implementing length-of-stay discounts or slightly higher rates for bookings made less than 84 days out to capitalize on advance planning.
- Target marketing efforts for the Summer season well in advance (at least 72 days) to capture early planners.
- Monitor your own booking lead times against these GlenOak Hills averages to identify opportunities for dynamic pricing adjustments.
Popular & Essential Airbnb Amenities in GlenOak Hills (2026)
Amenity Prevalence
Amenity Insights for GlenOak Hills
- Essential amenities in GlenOak Hills that guests expect include: TV, Coffee maker, Wifi, Air conditioning, Smoke alarm, Free parking on premises, Hair dryer, Heating, Hot water, Dishes and silverware. Lacking these (any) could significantly impact bookings.
Recommendations for Hosts
- Ensure your listing includes all essential amenities for GlenOak Hills: TV, Coffee maker, Wifi, Air conditioning, Smoke alarm, Free parking on premises, Hair dryer, Heating, Hot water, Dishes and silverware.
- Prioritize adding missing essentials: Smoke alarm, Free parking on premises, Hair dryer, Heating, Hot water, Dishes and silverware.
- Highlight unique or less common amenities you offer (e.g., hot tub, dedicated workspace, EV charger) in your listing description and photos.
- Regularly check competitor amenities in GlenOak Hills to stay competitive.
GlenOak Hills Airbnb Guest Demographics & Profile Analysis (2026)
Guest Profile Summary for GlenOak Hills
- The typical guest profile for Airbnb in GlenOak Hills consists of primarily domestic travelers (97%), often arriving from nearby Los Angeles, typically belonging to the Post-2000s (Gen Z/Alpha) group (50%), primarily speaking English or Spanish.
- Domestic travelers account for 97.4% of guests.
- Key international markets include United States (97.4%) and United Kingdom (0.9%).
- Top languages spoken are English (71.3%) followed by Spanish (19.5%).
- A significant demographic segment is the Post-2000s (Gen Z/Alpha) group, representing 50% of guests.
Recommendations for Hosts
- Target domestic marketing efforts towards travelers from Los Angeles and San Diego.
- Tailor amenities and listing descriptions to appeal to the dominant Post-2000s (Gen Z/Alpha) demographic (e.g., highlight fast WiFi, smart home features, local guides).
- Highlight unique local experiences or amenities relevant to the primary guest profile.
- Consider seasonal promotions aligned with peak travel times for key origin markets.
Nearby Short-Term Rental Market Comparison
How does the GlenOak Hills Airbnb market stack up against its neighbors? Compare key performance metrics like average monthly revenue, ADR, and occupancy rates in surrounding areas to understand the broader regional STR landscape.
| Market | Active Properties | Monthly Revenue | Daily Rate | Avg. Occupancy |
|---|---|---|---|---|
| Newport Beach | 1,273 | $8,950 | $744.06 | 47% |
| Rancho San Diego | 25 | $8,649 | $568.72 | 48% |
| Thousand Palms | 33 | $8,119 | $725.48 | 36% |
| Lakeside | 33 | $7,537 | $604.33 | 44% |
| Bermuda Dunes | 143 | $7,324 | $664.90 | 39% |
| Mount Helix | 33 | $7,163 | $594.94 | 50% |
| Del Mar | 128 | $7,011 | $671.56 | 45% |
| Rancho Santa Fe | 34 | $6,074 | $913.16 | 35% |
| Encinitas | 559 | $5,940 | $543.93 | 49% |
| Santa Margarita Ranchos | 18 | $5,614 | $506.60 | 36% |