Granite Bay Airbnb Market Analysis 2026: Short Term Rental Data & Vacation Rental Statistics in California, United States
Is Airbnb profitable in Granite Bay in 2026? Explore comprehensive Airbnb analytics for Granite Bay, California, United States to uncover income potential. This 2026 STR market report for Granite Bay, based on AirROI data from February 2025 to January 2026, reveals key trends in the niche market of 31 active listings.
Whether you're considering an Airbnb investment in Granite Bay, optimizing your existing vacation rental, or exploring rental arbitrage opportunities, understanding the Granite Bay Airbnb data is crucial. Leveraging the low regulation environment is key to maximizing your short term rental income potential. Let's dive into the specifics.
Key Granite Bay Airbnb Performance Metrics Overview
Monthly Airbnb Revenue Variations & Income Potential in Granite Bay (2026)
Understanding the monthly revenue variations for Airbnb listings in Granite Bay is key to maximizing your short term rental income potential. Seasonality significantly impacts earnings. Our analysis, based on data from the past 12 months, shows that the peak revenue month for STRs in Granite Bay is typically December, while February often presents the lowest earnings, highlighting opportunities for strategic pricing adjustments during shoulder and low seasons. Explore the typical Airbnb income in Granite Bay across different performance tiers:
- Best-in-class properties (Top 10%) achieve $12,275+ monthly, often utilizing dynamic pricing and superior guest experiences.
- Strong performing properties (Top 25%) earn $7,576 or more, indicating effective management and desirable locations/amenities.
- Typical properties (Median) generate around $3,690 per month, representing the average market performance.
- Entry-level properties (Bottom 25%) see earnings around $1,503, often with potential for optimization.
Average Monthly Airbnb Earnings Trend in Granite Bay
Granite Bay Airbnb Occupancy Rate Trends (2026)
Maximize your bookings by understanding the Granite Bay STR occupancy trends. Seasonal demand shifts significantly influence how often properties are booked. Typically, Julysees the highest demand (peak season occupancy), while June experiences the lowest (low season). Effective strategies, like adjusting minimum stays or offering promotions, can boost occupancy during slower periods. Here's how different property tiers perform in Granite Bay:
- Best-in-class properties (Top 10%) achieve 71%+ occupancy, indicating high desirability and potentially optimized availability.
- Strong performing properties (Top 25%) maintain 57% or higher occupancy, suggesting good market fit and guest satisfaction.
- Typical properties (Median) have an occupancy rate around 38%.
- Entry-level properties (Bottom 25%) average 20% occupancy, potentially facing higher vacancy.
Average Monthly Occupancy Rate Trend in Granite Bay
Average Daily Rate (ADR) Airbnb Trends in Granite Bay (2026)
Effective short term rental pricing strategy in Granite Bay involves understanding monthly ADR fluctuations. The Average Daily Rate (ADR) for Airbnb in Granite Bay typically peaks in December and dips lowest during February. Leveraging Airbnb dynamic pricing tools or strategies based on this seasonality can significantly boost revenue. Here's a look at the typical nightly rates achieved:
- Best-in-class properties (Top 10%) command rates of $826+ per night, often due to premium features or locations.
- Strong performing properties (Top 25%) achieve nightly rates of $586 or more.
- Typical properties (Median) charge around $314 per night.
- Entry-level properties (Bottom 25%) earn around $181 per night.
Average Daily Rate (ADR) Trend by Month in Granite Bay
Get Live Granite Bay Market Intelligence 👇
Explore Real-time Analytics
Airbnb Seasonality Analysis & Trends in Granite Bay (2026)
Peak Season (December, August, July)
- Revenue averages $6,832 per month
- Occupancy rates average 42.3%
- Daily rates average $418
Shoulder Season
- Revenue averages $5,252 per month
- Occupancy maintains around 39.1%
- Daily rates hold near $410
Low Season (February, September, November)
- Revenue drops to average $4,715 per month
- Occupancy decreases to average 38.4%
- Daily rates adjust to average $405
Seasonality Insights for Granite Bay
- The Airbnb seasonality in Granite Bay shows moderate seasonality with distinct peak and low periods. While the sections above show seasonal averages, it's also insightful to look at the extremes:
- During the high season, the absolute peak month showcases Granite Bay's highest earning potential, with monthly revenues capable of climbing to $7,171, occupancy reaching a high of 44.3%, and ADRs peaking at $457.
- Conversely, the slowest single month of the year, typically falling within the low season, marks the market's lowest point. In this month, revenue might dip to $4,616, occupancy could drop to 35.3%, and ADRs may adjust down to $349.
- Understanding both the seasonal averages and these monthly peaks and troughs in revenue, occupancy, and ADR is crucial for maximizing your Airbnb profit potential in Granite Bay.
Seasonal Strategies for Maximizing Profit
- Peak Season: Maximize revenue through premium pricing and potentially longer minimum stays. Ensure high availability.
- Low Season: Offer competitive pricing, special promotions (e.g., extended stay discounts), and flexible cancellation policies. Target off-season travelers like remote workers or budget-conscious guests.
- Shoulder Seasons: Implement dynamic pricing that balances peak and low rates. Target weekend travelers or specific events. Offer slightly more flexible terms than peak season.
- Regularly analyze your own performance against these Granite Bay seasonality benchmarks and adjust your pricing and availability strategy accordingly.
Best Areas for Airbnb Investment in Granite Bay (2026)
Exploring the top neighborhoods for short-term rentals in Granite Bay? This section highlights key areas, outlining why they are attractive for hosts and guests, along with notable local attractions. Consider these locations based on your target guest profile and investment strategy.
| Neighborhood / Area | Why Host Here? (Target Guests & Appeal) | Key Attractions & Landmarks |
|---|---|---|
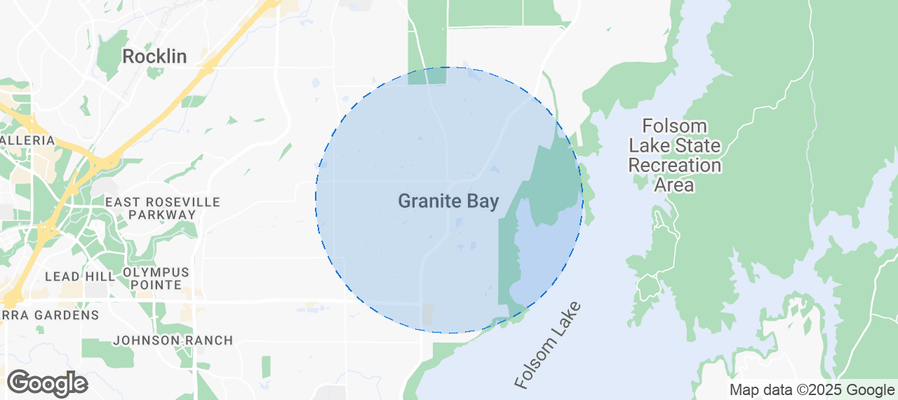
| Granite Bay Lakefront | A picturesque waterfront area offering scenic views and boating activities. Ideal for families and those seeking a relaxing getaway near the water. | Folsom Lake, Granite Bay Beach, Beal's Point, Maidu Regional Park, Granite Bay Golf Club |
| Treelake Village | A family-friendly neighborhood with excellent schools and community amenities. Popular among vacationing families looking for a peaceful suburban stay. | Treelake Village Shopping Center, Granite Bay Community Park, Maidu Museum, local restaurants, Walking trails |
| Douglas Boulevard | A vibrant area with diverse dining and shopping options. Conveniently located near major access roads, making it a great spot for business travelers. | Granite Bay Plaza, The Fountains at Roseville, local boutiques, restaurants, fitness centers |
| Cavitt Stallman | A serene residential area with large homes and expansive lots. Attracts guests looking for privacy and a quiet retreat while still being close to other attractions. | Sacramento State University, local parks, nature trails, Granite Bay Park, country clubs |
| Newcastle | A nearby quaint town offering a rural California experience while being close to Granite Bay. Perfect for guests seeking small-town charm. | Newcastle Community Park, local wineries, historical sites, antique shops, art galleries |
| Loomis | Picturesque countryside area with a friendly community atmosphere. Attracts guests interested in outdoor activities and rural experiences. | Loomis Basin Community Park, historic downtown Loomis, local farmers market, hiking trails, wine tasting |
| Roseville | Just a short drive away from Granite Bay, this bustling city has shopping, entertainment, and dining options. Perfect for guests who want to enjoy the amenities of a larger city. | Westfield Galleria at Roseville, Roseville Aquatic Complex, local events, Roseville Historic Society, parks and recreation areas |
| Folsom | Known for its historic downtown and outdoor recreational activities, Folsom offers a mix of natural beauty and urban convenience. Great for guests who love history and nature. | Folsom State Historic Park, Folsom Lake State Recreation Area, Folsom Premium Outlets, Empire Ranch Golf Club, local restaurants |
Understanding Airbnb License Requirements & STR Laws in Granite Bay (2026)
While Granite Bay, California, United States currently shows low STR regulations, specific Airbnb license requirements might still exist or change. Always verify the latest short term rental regulations and Airbnb license requirements directly with local government authorities for Granite Bay to ensure full compliance before hosting.
(Source: AirROI data, 2026, finding no licensed listings among those analyzed)
Top Performing Airbnb Properties in Granite Bay (2026)
Benchmark your potential! Explore examples of top-performing Airbnb properties in Granite Baybased on Trailing Twelve Month (TTM) revenue. Analyze their characteristics, revenue, occupancy rate, and ADR to understand what drives success in this market.

Luxury Granite Bay Home | 5BR with Private Yard
Entire Place • 5 bedrooms

Luxury Getaway with Huge Game Room
Entire Place • 5 bedrooms

'Casa d'Amore': Extravagant Lakefront Villa!
Entire Place • 5 bedrooms

Ranch Stay-A 240 acre Working Ranch
Entire Place • 4 bedrooms
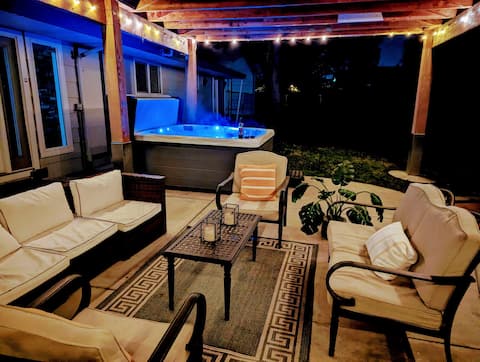
Private Oasis w Hot Tub & Pool near Folsom Lake!
Entire Place • 4 bedrooms

Granite Bay Home
Entire Place • 4 bedrooms
Note: Performance varies based on location, size, amenities, seasonality, and management quality. Data reflects the past 12 months.
Top Performing Airbnb Hosts in Granite Bay (2026)
Learn from the best! This table showcases top-performing Airbnb hosts in Granite Bay based on the number of properties managed and estimated total revenue over the past year. Analyze their scale and performance metrics.
| Host Name | Properties | Grossing Revenue | Stay Reviews | Avg Rating |
|---|---|---|---|---|
| Hearth Property | 2 | $227,549 | 22 | 4.95/5.0 |
| Sharalee Rowett | 1 | $176,125 | 65 | 4.78/5.0 |
| Evolve | 2 | $124,735 | 56 | 4.09/5.0 |
| Angela | 1 | $92,711 | 9 | 5.00/5.0 |
| Kimberly | 1 | $88,803 | 36 | 4.89/5.0 |
| Ana | 1 | $86,859 | 21 | 5.00/5.0 |
| Eli | 1 | $81,818 | 65 | 4.98/5.0 |
| Anastasiya | 1 | $77,022 | 14 | 5.00/5.0 |
| David | 5 | $74,621 | 429 | 4.47/5.0 |
| Timothee | 1 | $74,097 | 14 | 5.00/5.0 |
Analyzing the strategies of top hosts, such as their property selection, pricing, and guest communication, can offer valuable lessons for optimizing your own Airbnb operations in Granite Bay.
Dive Deeper: Advanced Granite Bay STR Market Data (2026)
Ready to unlock more insights? AirROI provides access to advanced metrics and comprehensive Airbnb data for Granite Bay. Explore detailed analytics beyond this report to refine your investment strategy, optimize pricing, and maximize your vacation rental profits.
Explore Advanced MetricsGranite Bay Short-Term Rental Market Composition (2026): Property & Room Types
Room Type Distribution
Property Type Distribution
Market Composition Insights for Granite Bay
- The Granite Bay Airbnb market composition is heavily skewed towards Entire Home/Apt listings, which make up 100% of the 31 active rentals. This indicates strong guest preference for privacy and space.
- Looking at the property type distribution in Granite Bay, House properties are the most common (58.1%), reflecting the local real estate landscape.
- Houses represent a significant 58.1% portion, catering likely to families or larger groups.
- The presence of 12.9% Hotel/Boutique listings indicates integration with traditional hospitality.
- Smaller segments like others (combined 3.2%) offer potential for unique stay experiences.
Granite Bay Airbnb Room Capacity Analysis (2026): Bedroom Distribution
Distribution of Listings by Number of Bedrooms
Room Capacity Insights for Granite Bay
- The dominant room capacity in Granite Bay is 4 bedrooms listings, making up 35.5% of the market. This suggests a strong demand for properties suitable for families or small groups.
- Together, 4 bedrooms and 3 bedrooms properties represent 58.1% of the active Airbnb listings in Granite Bay, indicating a high concentration in these sizes.
- A significant 67.8% of listings offer 3+ bedrooms, catering to larger groups and families seeking more space in Granite Bay.
Granite Bay Vacation Rental Guest Capacity Trends (2026)
Distribution of Listings by Guest Capacity
Guest Capacity Insights for Granite Bay
- The most common guest capacity trend in Granite Bay vacation rentals is listings accommodating 8+ guests (54.8%). This suggests the primary traveler segment is likely larger groups.
- Properties designed for 8+ guests and 6 guests dominate the Granite Bay STR market, accounting for 80.6% of listings.
- 83.8% of properties accommodate 6+ guests, serving the market segment for larger families or group travel in Granite Bay.
- On average, properties in Granite Bay are equipped to host 6.6 guests.
Granite Bay Airbnb Booking Patterns (2026): Available vs. Booked Days
Available Days Distribution
Booked Days Distribution
Booking Pattern Insights for Granite Bay
- The most common availability pattern in Granite Bay falls within the 181-270 days range, representing 45.2% of listings. This suggests many properties have significant open periods on their calendars.
- Approximately 83.9% of listings show high availability (181+ days open annually), indicating potential for increased bookings or specific owner usage patterns.
- For booked days, the 91-180 days range is most frequent in Granite Bay (48.4%), reflecting common guest stay durations or potential owner blocking patterns.
- A notable 16.1% of properties secure long booking periods (181+ days booked per year), highlighting successful long-term rental strategies or significant owner usage.
Granite Bay Airbnb Minimum Stay Requirements Analysis
Distribution of Listings by Minimum Night Requirement
1 Night
11 listings
35.5% of total
2 Nights
9 listings
29% of total
3 Nights
3 listings
9.7% of total
7-29 Nights
3 listings
9.7% of total
30+ Nights
5 listings
16.1% of total
Key Insights
- The most prevalent minimum stay requirement in Granite Bay is 1 Night, adopted by 35.5% of listings. This highlights the market's preference for shorter, flexible bookings.
- A strong majority (64.5%) of the Granite Bay Airbnb data shows acceptance of very short stays (1-2 nights), indicating a dynamic, high-turnover market.
- A significant segment (16.1%) caters to monthly stays (30+ nights) in Granite Bay, pointing to opportunities in the extended-stay market.
Recommendations
- Align with the market by considering a 1 Night minimum stay, as 35.5% of Granite Bay hosts use this setting.
- Explore offering discounts for stays of 30+ nights to attract the 16.1% of the market seeking extended stays.
- Adjust minimum nights based on seasonality – potentially shorter during low season and longer during peak demand periods in Granite Bay.
Granite Bay Airbnb Cancellation Policy Trends Analysis (2026)
Flexible
3 listings
9.7% of total
Moderate
6 listings
19.4% of total
Firm
13 listings
41.9% of total
Strict
9 listings
29% of total
Cancellation Policy Insights for Granite Bay
- The prevailing Airbnb cancellation policy trend in Granite Bay is Firm, used by 41.9% of listings.
- A majority (70.9%) of hosts in Granite Bay utilize Firm or Strict policies, indicating a market where hosts prioritize booking security.
Recommendations for Hosts
- Consider adopting a Firm policy to align with the 41.9% market standard in Granite Bay.
- Regularly review your cancellation policy against competitors and market demand shifts in Granite Bay.
Granite Bay STR Booking Lead Time Analysis (2026)
Average Booking Lead Time by Month
Booking Lead Time Insights for Granite Bay
- The overall average booking lead time for vacation rentals in Granite Bay is 38 days.
- Guests book furthest in advance for stays during October (average 59 days), likely coinciding with peak travel demand or local events.
- The shortest booking windows occur for stays in February (average 14 days), indicating more last-minute travel plans during this time.
- Seasonally, Fall (45 days avg.) sees the longest lead times, while Winter (31 days avg.) has the shortest, reflecting typical travel planning cycles.
Recommendations for Hosts
- Use the overall average lead time (38 days) as a baseline for your pricing and availability strategy in Granite Bay.
- For October stays, consider implementing length-of-stay discounts or slightly higher rates for bookings made less than 59 days out to capitalize on advance planning.
- During February, focus on last-minute booking availability and promotions, as guests book with very short notice (14 days avg.).
- Target marketing efforts for the Fall season well in advance (at least 45 days) to capture early planners.
- Monitor your own booking lead times against these Granite Bay averages to identify opportunities for dynamic pricing adjustments.
Popular & Essential Airbnb Amenities in Granite Bay (2026)
Amenity Prevalence
Amenity Insights for Granite Bay
- Essential amenities in Granite Bay that guests expect include: Carbon monoxide alarm, Heating, Air conditioning, Smoke alarm, Wifi, Hot water, Free parking on premises, TV, Kitchen, Bed linens. Lacking these (any) could significantly impact bookings.
Recommendations for Hosts
- Ensure your listing includes all essential amenities for Granite Bay: Carbon monoxide alarm, Heating, Air conditioning, Smoke alarm, Wifi, Hot water, Free parking on premises, TV, Kitchen, Bed linens.
- Prioritize adding missing essentials: Hot water, Free parking on premises, TV, Kitchen, Bed linens.
- Highlight unique or less common amenities you offer (e.g., hot tub, dedicated workspace, EV charger) in your listing description and photos.
- Regularly check competitor amenities in Granite Bay to stay competitive.
Granite Bay Airbnb Guest Demographics & Profile Analysis (2026)
Guest Profile Summary for Granite Bay
- The typical guest profile for Airbnb in Granite Bay consists of primarily domestic travelers (95%), often arriving from nearby San Jose, typically belonging to the Post-2000s (Gen Z/Alpha) group (50%), primarily speaking English or Spanish.
- Domestic travelers account for 95.2% of guests.
- Key international markets include United States (95.2%) and Canada (0.9%).
- Top languages spoken are English (63.2%) followed by Spanish (16.8%).
- A significant demographic segment is the Post-2000s (Gen Z/Alpha) group, representing 50% of guests.
Recommendations for Hosts
- Target domestic marketing efforts towards travelers from San Jose and Reno.
- Tailor amenities and listing descriptions to appeal to the dominant Post-2000s (Gen Z/Alpha) demographic (e.g., highlight fast WiFi, smart home features, local guides).
- Highlight unique local experiences or amenities relevant to the primary guest profile.
- Consider seasonal promotions aligned with peak travel times for key origin markets.
Nearby Short-Term Rental Market Comparison
How does the Granite Bay Airbnb market stack up against its neighbors? Compare key performance metrics like average monthly revenue, ADR, and occupancy rates in surrounding areas to understand the broader regional STR landscape.
| Market | Active Properties | Monthly Revenue | Daily Rate | Avg. Occupancy |
|---|---|---|---|---|
| Moss Beach | 34 | $10,092 | $676.91 | 53% |
| Sonoma | 228 | $9,647 | $819.87 | 43% |
| Marshall | 18 | $8,897 | $607.75 | 50% |
| St. Helena | 50 | $8,684 | $924.70 | 38% |
| Kenwood | 60 | $8,643 | $810.83 | 41% |
| Glen Ellen | 85 | $8,482 | $799.53 | 43% |
| Eldridge | 21 | $8,410 | $930.61 | 41% |
| Dillon Beach | 82 | $8,062 | $703.26 | 41% |
| Stinson Beach | 106 | $7,814 | $812.15 | 43% |
| Healdsburg | 195 | $7,538 | $744.46 | 41% |