Hercules Airbnb Market Analysis 2026: Short Term Rental Data & Vacation Rental Statistics in California, United States
Is Airbnb profitable in Hercules in 2026? Explore comprehensive Airbnb analytics for Hercules, California, United States to uncover income potential. This 2026 STR market report for Hercules, based on AirROI data from February 2025 to January 2026, reveals key trends in the niche market of 21 active listings.
Whether you're considering an Airbnb investment in Hercules, optimizing your existing vacation rental, or exploring rental arbitrage opportunities, understanding the Hercules Airbnb data is crucial. Leveraging the low regulation environment is key to maximizing your short term rental income potential. Let's dive into the specifics.
Key Hercules Airbnb Performance Metrics Overview
Monthly Airbnb Revenue Variations & Income Potential in Hercules (2026)
Understanding the monthly revenue variations for Airbnb listings in Hercules is key to maximizing your short term rental income potential. Seasonality significantly impacts earnings. Our analysis, based on data from the past 12 months, shows that the peak revenue month for STRs in Hercules is typically July, while January often presents the lowest earnings, highlighting opportunities for strategic pricing adjustments during shoulder and low seasons. Explore the typical Airbnb income in Hercules across different performance tiers:
- Best-in-class properties (Top 10%) achieve $5,535+ monthly, often utilizing dynamic pricing and superior guest experiences.
- Strong performing properties (Top 25%) earn $2,787 or more, indicating effective management and desirable locations/amenities.
- Typical properties (Median) generate around $1,634 per month, representing the average market performance.
- Entry-level properties (Bottom 25%) see earnings around $706, often with potential for optimization.
Average Monthly Airbnb Earnings Trend in Hercules
Hercules Airbnb Occupancy Rate Trends (2026)
Maximize your bookings by understanding the Hercules STR occupancy trends. Seasonal demand shifts significantly influence how often properties are booked. Typically, Julysees the highest demand (peak season occupancy), while April experiences the lowest (low season). Effective strategies, like adjusting minimum stays or offering promotions, can boost occupancy during slower periods. Here's how different property tiers perform in Hercules:
- Best-in-class properties (Top 10%) achieve 81%+ occupancy, indicating high desirability and potentially optimized availability.
- Strong performing properties (Top 25%) maintain 69% or higher occupancy, suggesting good market fit and guest satisfaction.
- Typical properties (Median) have an occupancy rate around 49%.
- Entry-level properties (Bottom 25%) average 26% occupancy, potentially facing higher vacancy.
Average Monthly Occupancy Rate Trend in Hercules
Average Daily Rate (ADR) Airbnb Trends in Hercules (2026)
Effective short term rental pricing strategy in Hercules involves understanding monthly ADR fluctuations. The Average Daily Rate (ADR) for Airbnb in Hercules typically peaks in December and dips lowest during February. Leveraging Airbnb dynamic pricing tools or strategies based on this seasonality can significantly boost revenue. Here's a look at the typical nightly rates achieved:
- Best-in-class properties (Top 10%) command rates of $392+ per night, often due to premium features or locations.
- Strong performing properties (Top 25%) achieve nightly rates of $131 or more.
- Typical properties (Median) charge around $82 per night.
- Entry-level properties (Bottom 25%) earn around $63 per night.
Average Daily Rate (ADR) Trend by Month in Hercules
Get Live Hercules Market Intelligence 👇

Explore Real-time Analytics
Airbnb Seasonality Analysis & Trends in Hercules (2026)
Peak Season (July, September, August)
- Revenue averages $2,647 per month
- Occupancy rates average 53.9%
- Daily rates average $129
Shoulder Season
- Revenue averages $2,216 per month
- Occupancy maintains around 48.3%
- Daily rates hold near $145
Low Season (January, February, March)
- Revenue drops to average $1,782 per month
- Occupancy decreases to average 41.9%
- Daily rates adjust to average $136
Seasonality Insights for Hercules
- The Airbnb seasonality in Hercules shows highly seasonal trends requiring careful strategy. While the sections above show seasonal averages, it's also insightful to look at the extremes:
- During the high season, the absolute peak month showcases Hercules's highest earning potential, with monthly revenues capable of climbing to $3,203, occupancy reaching a high of 60.7%, and ADRs peaking at $162.
- Conversely, the slowest single month of the year, typically falling within the low season, marks the market's lowest point. In this month, revenue might dip to $1,569, occupancy could drop to 38.5%, and ADRs may adjust down to $120.
- Understanding both the seasonal averages and these monthly peaks and troughs in revenue, occupancy, and ADR is crucial for maximizing your Airbnb profit potential in Hercules.
Seasonal Strategies for Maximizing Profit
- Peak Season: Maximize revenue through premium pricing and potentially longer minimum stays. Ensure high availability.
- Low Season: Offer competitive pricing, special promotions (e.g., extended stay discounts), and flexible cancellation policies. Target off-season travelers like remote workers or budget-conscious guests.
- Shoulder Seasons: Implement dynamic pricing that balances peak and low rates. Target weekend travelers or specific events. Offer slightly more flexible terms than peak season.
- Regularly analyze your own performance against these Hercules seasonality benchmarks and adjust your pricing and availability strategy accordingly.
Best Areas for Airbnb Investment in Hercules (2026)
Exploring the top neighborhoods for short-term rentals in Hercules? This section highlights key areas, outlining why they are attractive for hosts and guests, along with notable local attractions. Consider these locations based on your target guest profile and investment strategy.
| Neighborhood / Area | Why Host Here? (Target Guests & Appeal) | Key Attractions & Landmarks |
|---|---|---|
| Downtown Hercules | A revitalizing area with local shops and restaurants, downtown Hercules is becoming a new hub for visitors seeking a vibrant community atmosphere. | Hercules Library, Shirley Temple Park, Hercules Waterfront, Casa Blanca Park, Hercules Community Center |
| Hercules Waterfront | With scenic views of the bay and access to outdoor activities, the waterfront area attracts nature lovers and families looking for recreational opportunities. | Refugio Valley Park, Hercules Bay Trail, Marina Park, Waterfront Promenade, Hercules Fishing Pier |
| Victoria by the Bay | A popular residential area with beautiful homes and proximity to the bay, known for its parks and family-friendly environment. | Victoria Park, Bayfront Park, Nature trails, Playgrounds, Close access to the bay |
| Amazon Park | A neighborhood with great access to parks and schools, it's ideal for families and those transitioning to the area, making it attractive for longer stays. | Amazon Park, Play area, Recreational facilities, Community events |
| Sycamore Avenue | A main thoroughfare with lots of businesses, Sycamore is a convenient place for visitors who want easy access to amenities. | Local shops, Restaurants, Grocery stores, Fitness centers, Public transit access |
| Tara Hills | A primarily residential area that offers a quiet atmosphere while being close to major routes for an easy commute, appealing to working professionals. | Parks nearby, Quiet residential streets, Convenient access to I-80, Community amenities |
| Fernandez Park | Known for its large park that hosts various community events, this area is perfect for families and travelers who enjoy outdoor activities. | Fernandez Park, Walking trails, Sports fields, Community gatherings |
| Highlands | An upscale neighborhood with larger homes and panoramic views, ideal for those looking for a more luxurious stay. | Hiking trails, Community amenities, Scenic viewpoints, Great for family gatherings |
Understanding Airbnb License Requirements & STR Laws in Hercules (2026)
While Hercules, California, United States currently shows low STR regulations, specific Airbnb license requirements might still exist or change. Always verify the latest short term rental regulations and Airbnb license requirements directly with local government authorities for Hercules to ensure full compliance before hosting.
(Source: AirROI data, 2026, finding no licensed listings among those analyzed)
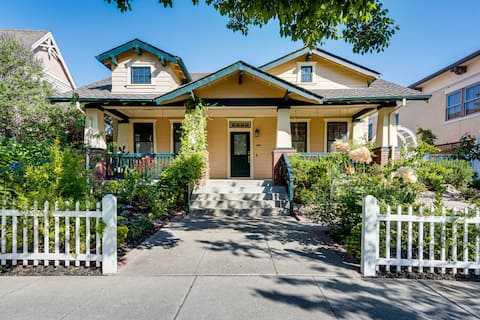
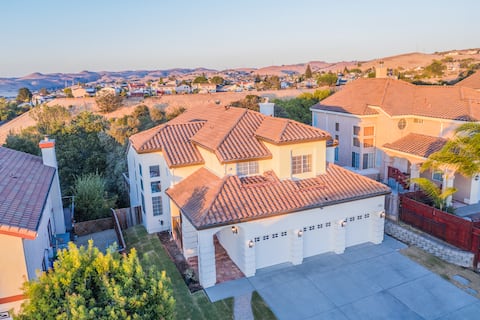
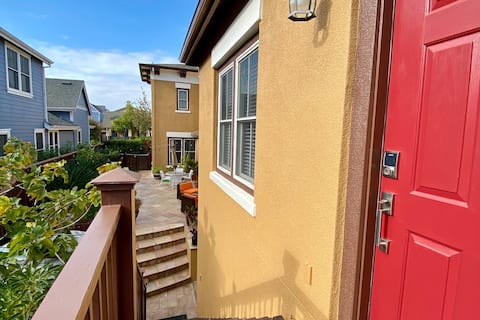
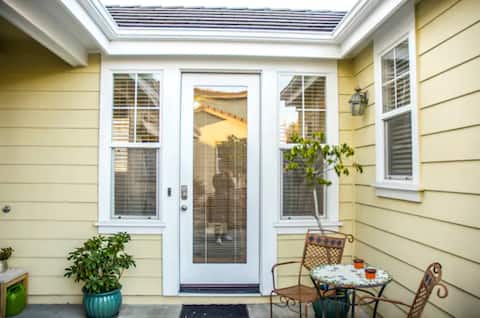
Top Performing Airbnb Properties in Hercules (2026)
Benchmark your potential! Explore examples of top-performing Airbnb properties in Herculesbased on Trailing Twelve Month (TTM) revenue. Analyze their characteristics, revenue, occupancy rate, and ADR to understand what drives success in this market.
Luxe Bay View Home Near SF, Berkley & Napa Valley
Entire Place • 4 bedrooms
The Emerald Gem
Entire Place • 5 bedrooms
Fantastic Flat by the Bay in btwn SF/Berkeley/Napa
Entire Place • 1 bedroom
Totally Private Waterside Suite
Entire Place • 1 bedroom

Beautiful, Warm and Cozy safe place in Hercules
Entire Place • N/A
Private Studio in Lovely Neighborhood
Entire Place • N/A
Note: Performance varies based on location, size, amenities, seasonality, and management quality. Data reflects the past 12 months.
Top Performing Airbnb Hosts in Hercules (2026)
Learn from the best! This table showcases top-performing Airbnb hosts in Hercules based on the number of properties managed and estimated total revenue over the past year. Analyze their scale and performance metrics.
| Host Name | Properties | Grossing Revenue | Stay Reviews | Avg Rating |
|---|---|---|---|---|
| Evolve | 1 | $77,927 | 21 | 4.81/5.0 |
| Nidhi | 1 | $48,163 | 49 | 4.92/5.0 |
| Yvonne | 1 | $35,945 | 91 | 4.99/5.0 |
| Andrea | 1 | $32,556 | 186 | 4.96/5.0 |
| Belino | 1 | $27,739 | 355 | 4.97/5.0 |
| Manik | 1 | $23,274 | 173 | 4.93/5.0 |
| Qian | 2 | $20,260 | 179 | 4.83/5.0 |
| Lita | 1 | $15,929 | 323 | 4.94/5.0 |
| Marissa | 2 | $7,462 | 52 | 4.92/5.0 |
| Rishard | 1 | $6,411 | 6 | 4.17/5.0 |
Analyzing the strategies of top hosts, such as their property selection, pricing, and guest communication, can offer valuable lessons for optimizing your own Airbnb operations in Hercules.
Dive Deeper: Advanced Hercules STR Market Data (2026)
Ready to unlock more insights? AirROI provides access to advanced metrics and comprehensive Airbnb data for Hercules. Explore detailed analytics beyond this report to refine your investment strategy, optimize pricing, and maximize your vacation rental profits.
Explore Advanced MetricsHercules Short-Term Rental Market Composition (2026): Property & Room Types
Room Type Distribution
Property Type Distribution
Market Composition Insights for Hercules
- The Hercules Airbnb market composition is heavily skewed towards Private Room listings, which make up 47.6% of the 21 active rentals. This indicates strong guest preference for privacy and space.
- Looking at the property type distribution in Hercules, House properties are the most common (57.1%), reflecting the local real estate landscape.
- Houses represent a significant 57.1% portion, catering likely to families or larger groups.
- The presence of 19% Hotel/Boutique listings indicates integration with traditional hospitality.
- Smaller segments like others (combined 4.8%) offer potential for unique stay experiences.
Hercules Airbnb Room Capacity Analysis (2026): Bedroom Distribution
Distribution of Listings by Number of Bedrooms
Room Capacity Insights for Hercules
- The dominant room capacity in Hercules is 1 bedroom listings, making up 19% of the market. This suggests a strong demand for properties suitable for couples or solo travelers.
- Together, 1 bedroom and 4 bedrooms properties represent 28.5% of the active Airbnb listings in Hercules, indicating a high concentration in these sizes.
Hercules Vacation Rental Guest Capacity Trends (2026)
Distribution of Listings by Guest Capacity
Guest Capacity Insights for Hercules
- The most common guest capacity trend in Hercules vacation rentals is listings accommodating 2 guests (23.8%). This suggests the primary traveler segment is likely couples or solo travelers.
- Properties designed for 2 guests and 8+ guests dominate the Hercules STR market, accounting for 38.1% of listings.
- 19.1% of properties accommodate 6+ guests, serving the market segment for larger families or group travel in Hercules.
- On average, properties in Hercules are equipped to host 2.0 guests.
Hercules Airbnb Booking Patterns (2026): Available vs. Booked Days
Available Days Distribution
Booked Days Distribution
Booking Pattern Insights for Hercules
- The most common availability pattern in Hercules falls within the 271-366 days range, representing 57.1% of listings. This suggests many properties have significant open periods on their calendars.
- Approximately 76.1% of listings show high availability (181+ days open annually), indicating potential for increased bookings or specific owner usage patterns.
- For booked days, the 1-30 days range is most frequent in Hercules (33.3%), reflecting common guest stay durations or potential owner blocking patterns.
- A notable 28.5% of properties secure long booking periods (181+ days booked per year), highlighting successful long-term rental strategies or significant owner usage.
Hercules Airbnb Minimum Stay Requirements Analysis
Distribution of Listings by Minimum Night Requirement
1 Night
6 listings
28.6% of total
2 Nights
6 listings
28.6% of total
3 Nights
4 listings
19% of total
4-6 Nights
1 listings
4.8% of total
30+ Nights
4 listings
19% of total
Key Insights
- The most prevalent minimum stay requirement in Hercules is 1 Night, adopted by 28.6% of listings. This highlights the market's preference for shorter, flexible bookings.
- A significant segment (19%) caters to monthly stays (30+ nights) in Hercules, pointing to opportunities in the extended-stay market.
Recommendations
- Align with the market by considering a 1 Night minimum stay, as 28.6% of Hercules hosts use this setting.
- If feasible, allowing 1-night stays, especially midweek or during low season, could capture last-minute bookings, as only 28.6% currently do.
- Explore offering discounts for stays of 30+ nights to attract the 19% of the market seeking extended stays.
- Adjust minimum nights based on seasonality – potentially shorter during low season and longer during peak demand periods in Hercules.
Hercules Airbnb Cancellation Policy Trends Analysis (2026)
Flexible
13 listings
65% of total
Moderate
5 listings
25% of total
Firm
2 listings
10% of total
Cancellation Policy Insights for Hercules
- The prevailing Airbnb cancellation policy trend in Hercules is Flexible, used by 65% of listings.
- The market strongly favors guest-friendly terms, with 90.0% of listings offering Flexible or Moderate policies. This suggests guests in Hercules may expect booking flexibility.
Recommendations for Hosts
- Consider adopting a Flexible policy to align with the 65% market standard in Hercules.
- Given the high prevalence of Flexible policies (65%), offering this can enhance booking appeal, especially during shoulder seasons.
- Regularly review your cancellation policy against competitors and market demand shifts in Hercules.
Hercules STR Booking Lead Time Analysis (2026)
Average Booking Lead Time by Month
Booking Lead Time Insights for Hercules
- The overall average booking lead time for vacation rentals in Hercules is 20 days.
- Guests book furthest in advance for stays during May (average 45 days), likely coinciding with peak travel demand or local events.
- The shortest booking windows occur for stays in February (average 16 days), indicating more last-minute travel plans during this time.
- Seasonally, Spring (29 days avg.) sees the longest lead times, while Winter (17 days avg.) has the shortest, reflecting typical travel planning cycles.
Recommendations for Hosts
- Use the overall average lead time (20 days) as a baseline for your pricing and availability strategy in Hercules.
- For May stays, consider implementing length-of-stay discounts or slightly higher rates for bookings made less than 45 days out to capitalize on advance planning.
- Target marketing efforts for the Spring season well in advance (at least 29 days) to capture early planners.
- Monitor your own booking lead times against these Hercules averages to identify opportunities for dynamic pricing adjustments.
Popular & Essential Airbnb Amenities in Hercules (2026)
Amenity Prevalence
Amenity Insights for Hercules
- Essential amenities in Hercules that guests expect include: Wifi. Lacking these (this) could significantly impact bookings.
- Popular amenities like Smoke alarm, Heating, Washer are common but not universal. Offering these can provide a competitive edge.
Recommendations for Hosts
- Ensure your listing includes all essential amenities for Hercules: Wifi.
- Consider adding popular differentiators like Smoke alarm or Heating to increase appeal.
- Highlight unique or less common amenities you offer (e.g., hot tub, dedicated workspace, EV charger) in your listing description and photos.
- Regularly check competitor amenities in Hercules to stay competitive.
Hercules Airbnb Guest Demographics & Profile Analysis (2026)
Guest Profile Summary for Hercules
- The typical guest profile for Airbnb in Hercules consists of primarily domestic travelers (95%), often arriving from nearby Seattle, typically belonging to the Post-2000s (Gen Z/Alpha) group (50%), primarily speaking English or Spanish.
- Domestic travelers account for 94.8% of guests.
- Key international markets include United States (94.8%) and DC (1.7%).
- Top languages spoken are English (73.3%) followed by Spanish (9.3%).
- A significant demographic segment is the Post-2000s (Gen Z/Alpha) group, representing 50% of guests.
Recommendations for Hosts
- Target domestic marketing efforts towards travelers from Seattle and Berkeley.
- Tailor amenities and listing descriptions to appeal to the dominant Post-2000s (Gen Z/Alpha) demographic (e.g., highlight fast WiFi, smart home features, local guides).
- Highlight unique local experiences or amenities relevant to the primary guest profile.
- Consider seasonal promotions aligned with peak travel times for key origin markets.
Nearby Short-Term Rental Market Comparison
How does the Hercules Airbnb market stack up against its neighbors? Compare key performance metrics like average monthly revenue, ADR, and occupancy rates in surrounding areas to understand the broader regional STR landscape.
| Market | Active Properties | Monthly Revenue | Daily Rate | Avg. Occupancy |
|---|---|---|---|---|
| Moss Beach | 34 | $10,092 | $676.91 | 53% |
| Sonoma | 228 | $9,647 | $819.87 | 43% |
| Marshall | 18 | $8,897 | $607.75 | 50% |
| St. Helena | 50 | $8,684 | $924.70 | 38% |
| Kenwood | 60 | $8,643 | $810.83 | 41% |
| Glen Ellen | 85 | $8,482 | $799.53 | 43% |
| Eldridge | 21 | $8,410 | $930.61 | 41% |
| Dillon Beach | 82 | $8,062 | $703.26 | 41% |
| Stinson Beach | 106 | $7,814 | $812.15 | 43% |
| Healdsburg | 195 | $7,538 | $744.46 | 41% |