Irvine Airbnb Market Analysis 2026: Short Term Rental Data & Vacation Rental Statistics in California, United States
Is Airbnb profitable in Irvine in 2026? Explore comprehensive Airbnb analytics for Irvine, California, United States to uncover income potential. This 2026 STR market report for Irvine, based on AirROI data from February 2025 to January 2026, reveals key trends in the market of 531 active listings.
Whether you're considering an Airbnb investment in Irvine, optimizing your existing vacation rental, or exploring rental arbitrage opportunities, understanding the Irvine Airbnb data is crucial. Leveraging the low regulation environment is key to maximizing your short term rental income potential. Let's dive into the specifics.
Key Irvine Airbnb Performance Metrics Overview
Monthly Airbnb Revenue Variations & Income Potential in Irvine (2026)
Understanding the monthly revenue variations for Airbnb listings in Irvine is key to maximizing your short term rental income potential. Seasonality significantly impacts earnings. Our analysis, based on data from the past 12 months, shows that the peak revenue month for STRs in Irvine is typically July, while January often presents the lowest earnings, highlighting opportunities for strategic pricing adjustments during shoulder and low seasons. Explore the typical Airbnb income in Irvine across different performance tiers:
- Best-in-class properties (Top 10%) achieve $7,184+ monthly, often utilizing dynamic pricing and superior guest experiences.
- Strong performing properties (Top 25%) earn $5,172 or more, indicating effective management and desirable locations/amenities.
- Typical properties (Median) generate around $2,636 per month, representing the average market performance.
- Entry-level properties (Bottom 25%) see earnings around $1,072, often with potential for optimization.
Average Monthly Airbnb Earnings Trend in Irvine
Irvine Airbnb Occupancy Rate Trends (2026)
Maximize your bookings by understanding the Irvine STR occupancy trends. Seasonal demand shifts significantly influence how often properties are booked. Typically, Julysees the highest demand (peak season occupancy), while January experiences the lowest (low season). Effective strategies, like adjusting minimum stays or offering promotions, can boost occupancy during slower periods. Here's how different property tiers perform in Irvine:
- Best-in-class properties (Top 10%) achieve 87%+ occupancy, indicating high desirability and potentially optimized availability.
- Strong performing properties (Top 25%) maintain 70% or higher occupancy, suggesting good market fit and guest satisfaction.
- Typical properties (Median) have an occupancy rate around 45%.
- Entry-level properties (Bottom 25%) average 19% occupancy, potentially facing higher vacancy.
Average Monthly Occupancy Rate Trend in Irvine
Average Daily Rate (ADR) Airbnb Trends in Irvine (2026)
Effective short term rental pricing strategy in Irvine involves understanding monthly ADR fluctuations. The Average Daily Rate (ADR) for Airbnb in Irvine typically peaks in July and dips lowest during October. Leveraging Airbnb dynamic pricing tools or strategies based on this seasonality can significantly boost revenue. Here's a look at the typical nightly rates achieved:
- Best-in-class properties (Top 10%) command rates of $377+ per night, often due to premium features or locations.
- Strong performing properties (Top 25%) achieve nightly rates of $299 or more.
- Typical properties (Median) charge around $210 per night.
- Entry-level properties (Bottom 25%) earn around $96 per night.
Average Daily Rate (ADR) Trend by Month in Irvine
Get Live Irvine Market Intelligence 👇

Explore Real-time Analytics
Airbnb Seasonality Analysis & Trends in Irvine (2026)
Peak Season (July, June, March)
- Revenue averages $4,211 per month
- Occupancy rates average 51.1%
- Daily rates average $229
Shoulder Season
- Revenue averages $3,326 per month
- Occupancy maintains around 46.0%
- Daily rates hold near $213
Low Season (January, September, December)
- Revenue drops to average $2,657 per month
- Occupancy decreases to average 38.6%
- Daily rates adjust to average $209
Seasonality Insights for Irvine
- The Airbnb seasonality in Irvine shows highly seasonal trends requiring careful strategy. While the sections above show seasonal averages, it's also insightful to look at the extremes:
- During the high season, the absolute peak month showcases Irvine's highest earning potential, with monthly revenues capable of climbing to $4,833, occupancy reaching a high of 55.7%, and ADRs peaking at $236.
- Conversely, the slowest single month of the year, typically falling within the low season, marks the market's lowest point. In this month, revenue might dip to $2,218, occupancy could drop to 34.3%, and ADRs may adjust down to $202.
- Understanding both the seasonal averages and these monthly peaks and troughs in revenue, occupancy, and ADR is crucial for maximizing your Airbnb profit potential in Irvine.
Seasonal Strategies for Maximizing Profit
- Peak Season: Maximize revenue through premium pricing and potentially longer minimum stays. Ensure high availability.
- Low Season: Offer competitive pricing, special promotions (e.g., extended stay discounts), and flexible cancellation policies. Target off-season travelers like remote workers or budget-conscious guests.
- Shoulder Seasons: Implement dynamic pricing that balances peak and low rates. Target weekend travelers or specific events. Offer slightly more flexible terms than peak season.
- Regularly analyze your own performance against these Irvine seasonality benchmarks and adjust your pricing and availability strategy accordingly.
Best Areas for Airbnb Investment in Irvine (2026)
Exploring the top neighborhoods for short-term rentals in Irvine? This section highlights key areas, outlining why they are attractive for hosts and guests, along with notable local attractions. Consider these locations based on your target guest profile and investment strategy.
| Neighborhood / Area | Why Host Here? (Target Guests & Appeal) | Key Attractions & Landmarks |
|---|---|---|
| University Town Center | A vibrant area close to the University of California, Irvine, attracting students, faculty, and visiting parents. Ideal for short-term rentals with a youthful demographic. | UCI campus, Mike Ward Community Park, South Coast Plaza, Irvine Spectrum Center, The District at Tustin Legacy |
| Woodbridge | A residential neighborhood with serene lakes and parks, perfect for families and leisure travelers. Its scenic beauty and community facilities lure visitors seeking a peaceful escape. | Woodbridge Village Center, North Lake, South Lake, Irvine Historical Museum, Woodbridge Community Park |
| Northwood | A family-friendly community with excellent schools and parks, great for attracting families on vacation. Offers a suburban feel with access to urban amenities. | Northwood Community Park, Northwood High School, Irvine Valley College, Pioneer Road Community Park, Heritage Park |
| The Spectrum | A premier shopping and entertainment destination in Irvine, ideal for tourists looking for dining and entertainment options. Its vibrant atmosphere draws many visitors year-round. | Irvine Spectrum Center, Giant Wheel, Movie Theaters, Restaurants, Retail Shops |
| Great Park Neighborhoods | A rapidly developing area with new homes and the famous Great Park, attracting visitors interested in outdoor activities and modern amenities. | Great Park Balloon, Great Park Farmers Market, Sports Complex, Great Park Adventure Playground, Pavilion Park |
| Tustin Legacy | Adjacent to Irvine, offers a mix of residential and commercial spaces. It's appealing to those looking for access to both urban and suburban living. | The District at Tustin Legacy, Tustin Marketplace, Edwards Theaters, Children's Museum at La Habra |
| Irvine Business Complex | The thriving business district attracts corporate travelers and professionals seeking short-term stays. Close to major companies and offices. | Irvine Spectrum, Corporate Offices, Higher Education Institutions, Shopping Centers |
| Quail Hill | A quiet, upscale neighborhood in Irvine offering hiking and outdoor activities. Attracts visitors looking for a more suburban, nature-oriented stay. | Quail Hill Trailhead, Oak Creek Golf Club, Quail Hill Community Park, Los Olivos Marketplace |
Understanding Airbnb License Requirements & STR Laws in Irvine (2026)
While Irvine, California, United States currently shows low STR regulations, specific Airbnb license requirements might still exist or change. Always verify the latest short term rental regulations and Airbnb license requirements directly with local government authorities for Irvine to ensure full compliance before hosting.
(Source: AirROI data, 2026, based on 1% licensed listings)
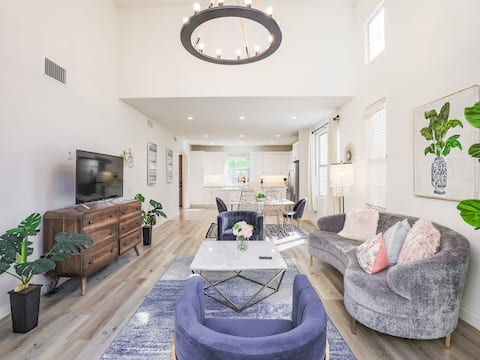
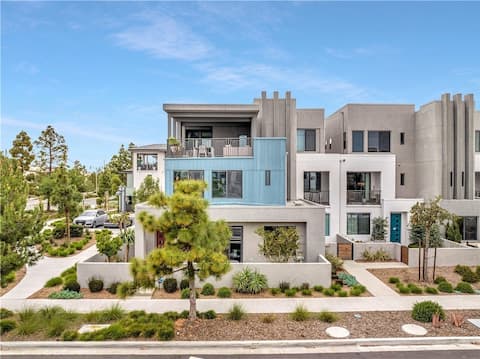
Top Performing Airbnb Properties in Irvine (2026)
Benchmark your potential! Explore examples of top-performing Airbnb properties in Irvinebased on Trailing Twelve Month (TTM) revenue. Analyze their characteristics, revenue, occupancy rate, and ADR to understand what drives success in this market.
#OC#Renovated stylish HOUSE/Beach/Pool/park
Entire Place • 4 bedrooms

Irvine Stonegate 4BR&4Bath Home
Entire Place • 4 bedrooms

Breathtaking City Skyline Views!
Entire Place • 2 bedrooms

Madrina | Urban Luxe-Stylish 2 Bedrooms/2 Bathrooms
Entire Place • 2 bedrooms

Cozy 1 Bedroom 1 Bathroom Retreat in Irvine
Entire Place • 1 bedroom
King Size, Patio, Xbox, Great Park
Entire Place • 4 bedrooms
Note: Performance varies based on location, size, amenities, seasonality, and management quality. Data reflects the past 12 months.
Top Performing Airbnb Hosts in Irvine (2026)
Learn from the best! This table showcases top-performing Airbnb hosts in Irvine based on the number of properties managed and estimated total revenue over the past year. Analyze their scale and performance metrics.
| Host Name | Properties | Grossing Revenue | Stay Reviews | Avg Rating |
|---|---|---|---|---|
| Amanda | 29 | $742,570 | 293 | 4.91/5.0 |
| OC Rentals | 18 | $550,130 | 634 | 4.59/5.0 |
| Brandon | 13 | $426,760 | 576 | 4.89/5.0 |
| World Class | 21 | $408,773 | 94 | 4.95/5.0 |
| Sunshine Getaways | 12 | $360,628 | 284 | 4.74/5.0 |
| Eric | 12 | $261,268 | 16 | 5.00/5.0 |
| Alira Properties | 10 | $254,050 | 61 | 4.94/5.0 |
| Cheryl | 6 | $223,937 | 230 | 4.92/5.0 |
| Nate | 3 | $217,468 | 242 | 4.96/5.0 |
| Mia | 8 | $217,040 | 316 | 4.86/5.0 |
Analyzing the strategies of top hosts, such as their property selection, pricing, and guest communication, can offer valuable lessons for optimizing your own Airbnb operations in Irvine.
Dive Deeper: Advanced Irvine STR Market Data (2026)
Ready to unlock more insights? AirROI provides access to advanced metrics and comprehensive Airbnb data for Irvine. Explore detailed analytics beyond this report to refine your investment strategy, optimize pricing, and maximize your vacation rental profits.
Explore Advanced MetricsIrvine Short-Term Rental Market Composition (2026): Property & Room Types
Room Type Distribution
Property Type Distribution
Market Composition Insights for Irvine
- The Irvine Airbnb market composition is heavily skewed towards Entire Home/Apt listings, which make up 75.7% of the 531 active rentals. This indicates strong guest preference for privacy and space.
- Looking at the property type distribution in Irvine, Apartment/Condo properties are the most common (52.7%), reflecting the local real estate landscape.
- Houses represent a significant 46% portion, catering likely to families or larger groups.
- Smaller segments like others, hotel/boutique (combined 1.4%) offer potential for unique stay experiences.
Irvine Airbnb Room Capacity Analysis (2026): Bedroom Distribution
Distribution of Listings by Number of Bedrooms
Room Capacity Insights for Irvine
- The dominant room capacity in Irvine is 2 bedrooms listings, making up 30.5% of the market. This suggests a strong demand for properties suitable for couples or solo travelers.
- Together, 2 bedrooms and 1 bedroom properties represent 51.8% of the active Airbnb listings in Irvine, indicating a high concentration in these sizes.
- A significant 24.7% of listings offer 3+ bedrooms, catering to larger groups and families seeking more space in Irvine.
Irvine Vacation Rental Guest Capacity Trends (2026)
Distribution of Listings by Guest Capacity
Guest Capacity Insights for Irvine
- The most common guest capacity trend in Irvine vacation rentals is listings accommodating 6 guests (19.6%). This suggests the primary traveler segment is likely larger groups.
- Properties designed for 6 guests and 4 guests dominate the Irvine STR market, accounting for 35.4% of listings.
- 38.7% of properties accommodate 6+ guests, serving the market segment for larger families or group travel in Irvine.
- On average, properties in Irvine are equipped to host 4.0 guests.
Irvine Airbnb Booking Patterns (2026): Available vs. Booked Days
Available Days Distribution
Booked Days Distribution
Booking Pattern Insights for Irvine
- The most common availability pattern in Irvine falls within the 271-366 days range, representing 66.9% of listings. This suggests many properties have significant open periods on their calendars.
- Approximately 90.4% of listings show high availability (181+ days open annually), indicating potential for increased bookings or specific owner usage patterns.
- For booked days, the 31-90 days range is most frequent in Irvine (41.1%), reflecting common guest stay durations or potential owner blocking patterns.
- A notable 10.6% of properties secure long booking periods (181+ days booked per year), highlighting successful long-term rental strategies or significant owner usage.
Irvine Airbnb Minimum Stay Requirements Analysis
Distribution of Listings by Minimum Night Requirement
1 Night
52 listings
9.8% of total
2 Nights
24 listings
4.5% of total
4-6 Nights
3 listings
0.6% of total
7-29 Nights
37 listings
7% of total
30+ Nights
415 listings
78.2% of total
Key Insights
- The most prevalent minimum stay requirement in Irvine is 30+ Nights, adopted by 78.2% of listings. This highlights the market's preference for longer commitments.
- Very short stays (1-2 nights) are less common (14.3%), suggesting hosts prefer slightly longer bookings to optimize turnover.
- A significant segment (78.2%) caters to monthly stays (30+ nights) in Irvine, pointing to opportunities in the extended-stay market.
Recommendations
- Align with the market by considering a 30+ Nights minimum stay, as 78.2% of Irvine hosts use this setting.
- If feasible, allowing 1-night stays, especially midweek or during low season, could capture last-minute bookings, as only 9.8% currently do.
- Explore offering discounts for stays of 30+ nights to attract the 78.2% of the market seeking extended stays.
- Adjust minimum nights based on seasonality – potentially shorter during low season and longer during peak demand periods in Irvine.
Irvine Airbnb Cancellation Policy Trends Analysis (2026)
Limited
1 listings
0.2% of total
Super Strict 30 Days
1 listings
0.2% of total
Flexible
105 listings
20% of total
Moderate
53 listings
10.1% of total
Firm
197 listings
37.5% of total
Strict
168 listings
32% of total
Cancellation Policy Insights for Irvine
- The prevailing Airbnb cancellation policy trend in Irvine is Firm, used by 37.5% of listings.
- A majority (69.5%) of hosts in Irvine utilize Firm or Strict policies, indicating a market where hosts prioritize booking security.
Recommendations for Hosts
- Consider adopting a Firm policy to align with the 37.5% market standard in Irvine.
- With 32% using Strict terms, this is a viable option in Irvine, particularly for high-value properties or during peak demand periods.
- Regularly review your cancellation policy against competitors and market demand shifts in Irvine.
Irvine STR Booking Lead Time Analysis (2026)
Average Booking Lead Time by Month
Booking Lead Time Insights for Irvine
- The overall average booking lead time for vacation rentals in Irvine is 27 days.
- Guests book furthest in advance for stays during July (average 40 days), likely coinciding with peak travel demand or local events.
- The shortest booking windows occur for stays in March (average 19 days), indicating more last-minute travel plans during this time.
- Seasonally, Summer (32 days avg.) sees the longest lead times, while Spring (21 days avg.) has the shortest, reflecting typical travel planning cycles.
Recommendations for Hosts
- Use the overall average lead time (27 days) as a baseline for your pricing and availability strategy in Irvine.
- For July stays, consider implementing length-of-stay discounts or slightly higher rates for bookings made less than 40 days out to capitalize on advance planning.
- Target marketing efforts for the Summer season well in advance (at least 32 days) to capture early planners.
- Monitor your own booking lead times against these Irvine averages to identify opportunities for dynamic pricing adjustments.
Popular & Essential Airbnb Amenities in Irvine (2026)
Amenity Prevalence
Amenity Insights for Irvine
- Essential amenities in Irvine that guests expect include: Wifi, Air conditioning, Smoke alarm, Washer. Lacking these (any) could significantly impact bookings.
- Popular amenities like Kitchen, Carbon monoxide alarm, Heating are common but not universal. Offering these can provide a competitive edge.
Recommendations for Hosts
- Ensure your listing includes all essential amenities for Irvine: Wifi, Air conditioning, Smoke alarm, Washer.
- Prioritize adding missing essentials: Wifi, Air conditioning, Smoke alarm, Washer.
- Consider adding popular differentiators like Kitchen or Carbon monoxide alarm to increase appeal.
- Highlight unique or less common amenities you offer (e.g., hot tub, dedicated workspace, EV charger) in your listing description and photos.
- Regularly check competitor amenities in Irvine to stay competitive.
Irvine Airbnb Guest Demographics & Profile Analysis (2026)
Guest Profile Summary for Irvine
- The typical guest profile for Airbnb in Irvine consists of primarily domestic travelers (78%), often arriving from nearby Irvine, typically belonging to the Post-2000s (Gen Z/Alpha) group (50%), primarily speaking English or Spanish.
- Domestic travelers account for 78.3% of guests.
- Key international markets include United States (78.3%) and China (3.5%).
- Top languages spoken are English (57%) followed by Spanish (12.4%).
- A significant demographic segment is the Post-2000s (Gen Z/Alpha) group, representing 50% of guests.
Recommendations for Hosts
- Target domestic marketing efforts towards travelers from Irvine and Los Angeles.
- Tailor amenities and listing descriptions to appeal to the dominant Post-2000s (Gen Z/Alpha) demographic (e.g., highlight fast WiFi, smart home features, local guides).
- Highlight unique local experiences or amenities relevant to the primary guest profile.
- Consider seasonal promotions aligned with peak travel times for key origin markets.
Nearby Short-Term Rental Market Comparison
How does the Irvine Airbnb market stack up against its neighbors? Compare key performance metrics like average monthly revenue, ADR, and occupancy rates in surrounding areas to understand the broader regional STR landscape.
| Market | Active Properties | Monthly Revenue | Daily Rate | Avg. Occupancy |
|---|---|---|---|---|
| Newport Beach | 1,273 | $8,950 | $744.06 | 47% |
| Rancho San Diego | 25 | $8,649 | $568.72 | 48% |
| Malibu | 251 | $8,293 | $1263.89 | 35% |
| Thousand Palms | 33 | $8,119 | $725.48 | 36% |
| Manhattan Beach | 267 | $7,875 | $585.30 | 53% |
| Lakeside | 33 | $7,537 | $604.33 | 44% |
| GlenOak Hills | 41 | $7,394 | $648.65 | 41% |
| Bermuda Dunes | 143 | $7,324 | $664.90 | 39% |
| Mount Helix | 33 | $7,163 | $594.94 | 50% |
| Del Mar | 128 | $7,011 | $671.56 | 45% |