Kirkwood Airbnb Market Analysis 2026: Short Term Rental Data & Vacation Rental Statistics in California, United States
Is Airbnb profitable in Kirkwood in 2026? Explore comprehensive Airbnb analytics for Kirkwood, California, United States to uncover income potential. This 2026 STR market report for Kirkwood, based on AirROI data from February 2025 to January 2026, reveals key trends in the niche market of 101 active listings.
Whether you're considering an Airbnb investment in Kirkwood, optimizing your existing vacation rental, or exploring rental arbitrage opportunities, understanding the Kirkwood Airbnb data is crucial. Leveraging the low regulation environment is key to maximizing your short term rental income potential. Let's dive into the specifics.
Key Kirkwood Airbnb Performance Metrics Overview
Monthly Airbnb Revenue Variations & Income Potential in Kirkwood (2026)
Understanding the monthly revenue variations for Airbnb listings in Kirkwood is key to maximizing your short term rental income potential. Seasonality significantly impacts earnings. Our analysis, based on data from the past 12 months, shows that the peak revenue month for STRs in Kirkwood is typically February, while October often presents the lowest earnings, highlighting opportunities for strategic pricing adjustments during shoulder and low seasons. Explore the typical Airbnb income in Kirkwood across different performance tiers:
- Best-in-class properties (Top 10%) achieve $9,052+ monthly, often utilizing dynamic pricing and superior guest experiences.
- Strong performing properties (Top 25%) earn $5,922 or more, indicating effective management and desirable locations/amenities.
- Typical properties (Median) generate around $3,417 per month, representing the average market performance.
- Entry-level properties (Bottom 25%) see earnings around $1,883, often with potential for optimization.
Average Monthly Airbnb Earnings Trend in Kirkwood
Kirkwood Airbnb Occupancy Rate Trends (2026)
Maximize your bookings by understanding the Kirkwood STR occupancy trends. Seasonal demand shifts significantly influence how often properties are booked. Typically, Februarysees the highest demand (peak season occupancy), while October experiences the lowest (low season). Effective strategies, like adjusting minimum stays or offering promotions, can boost occupancy during slower periods. Here's how different property tiers perform in Kirkwood:
- Best-in-class properties (Top 10%) achieve 57%+ occupancy, indicating high desirability and potentially optimized availability.
- Strong performing properties (Top 25%) maintain 38% or higher occupancy, suggesting good market fit and guest satisfaction.
- Typical properties (Median) have an occupancy rate around 25%.
- Entry-level properties (Bottom 25%) average 15% occupancy, potentially facing higher vacancy.
Average Monthly Occupancy Rate Trend in Kirkwood
Average Daily Rate (ADR) Airbnb Trends in Kirkwood (2026)
Effective short term rental pricing strategy in Kirkwood involves understanding monthly ADR fluctuations. The Average Daily Rate (ADR) for Airbnb in Kirkwood typically peaks in January and dips lowest during August. Leveraging Airbnb dynamic pricing tools or strategies based on this seasonality can significantly boost revenue. Here's a look at the typical nightly rates achieved:
- Best-in-class properties (Top 10%) command rates of $826+ per night, often due to premium features or locations.
- Strong performing properties (Top 25%) achieve nightly rates of $622 or more.
- Typical properties (Median) charge around $423 per night.
- Entry-level properties (Bottom 25%) earn around $268 per night.
Average Daily Rate (ADR) Trend by Month in Kirkwood
Get Live Kirkwood Market Intelligence 👇

Explore Real-time Analytics
Airbnb Seasonality Analysis & Trends in Kirkwood (2026)
Peak Season (February, March, April)
- Revenue averages $7,384 per month
- Occupancy rates average 45.1%
- Daily rates average $522
Shoulder Season
- Revenue averages $3,890 per month
- Occupancy maintains around 26.6%
- Daily rates hold near $477
Low Season (September, October, November)
- Revenue drops to average $2,226 per month
- Occupancy decreases to average 18.2%
- Daily rates adjust to average $433
Seasonality Insights for Kirkwood
- The Airbnb seasonality in Kirkwood shows highly seasonal trends requiring careful strategy. While the sections above show seasonal averages, it's also insightful to look at the extremes:
- During the high season, the absolute peak month showcases Kirkwood's highest earning potential, with monthly revenues capable of climbing to $8,773, occupancy reaching a high of 57.0%, and ADRs peaking at $546.
- Conversely, the slowest single month of the year, typically falling within the low season, marks the market's lowest point. In this month, revenue might dip to $1,953, occupancy could drop to 16.6%, and ADRs may adjust down to $415.
- Understanding both the seasonal averages and these monthly peaks and troughs in revenue, occupancy, and ADR is crucial for maximizing your Airbnb profit potential in Kirkwood.
Seasonal Strategies for Maximizing Profit
- Peak Season: Maximize revenue through premium pricing and potentially longer minimum stays. Ensure high availability.
- Low Season: Offer competitive pricing, special promotions (e.g., extended stay discounts), and flexible cancellation policies. Target off-season travelers like remote workers or budget-conscious guests.
- Shoulder Seasons: Implement dynamic pricing that balances peak and low rates. Target weekend travelers or specific events. Offer slightly more flexible terms than peak season.
- Regularly analyze your own performance against these Kirkwood seasonality benchmarks and adjust your pricing and availability strategy accordingly.
Best Areas for Airbnb Investment in Kirkwood (2026)
Exploring the top neighborhoods for short-term rentals in Kirkwood? This section highlights key areas, outlining why they are attractive for hosts and guests, along with notable local attractions. Consider these locations based on your target guest profile and investment strategy.
| Neighborhood / Area | Why Host Here? (Target Guests & Appeal) | Key Attractions & Landmarks |
|---|---|---|
| Kirkwood Mountain Resort | Popular destination for skiing and outdoor activities, attracting year-round visitors seeking adventure and relaxation in a scenic mountain setting. | Kirkwood Ski Resort, Lake Caples, Kirkwood Mountain Bike Park, Caples Lake, Kirkwood Village |
| Silver Lake | Beautiful alpine lake area known for its tranquility and outdoor recreational opportunities, perfect for families and nature lovers. | Silver Lake, Hiking Trails, Fishing Spots, Picnic Areas, Scenic Views |
| Sierra-at-Tahoe | Nearby ski resort famous for its family-friendly atmosphere and close proximity to Kirkwood, attracting winter sports enthusiasts and summer mountain adventurers. | Sierra-at-Tahoe Resort, Hiking and Biking Trails, Plenty of Snow, Family-Friendly Activities, Scenic Chairlift Rides |
| Historic Kirkwood | The charming historic district of Kirkwood offers a unique glimpse into the area’s history with quaint shops and eateries, appealing to visitors looking for local culture. | Kirkwood Historical Museum, Local Shops, Restaurants, Scenic Views, Community Events |
| Caples Lake | A serene spot for nature enthusiasts and photographers, offering stunning views and a peaceful environment for those looking to escape from the hustle and bustle. | Caples Lake, Fishing, Hiking Trails, Scenic Drives, Wildlife Sightings |
| Devil’s Corral | A picturesque spot known for its rugged beauty and outdoor activities, appealing to thrill-seekers and nature lovers alike. | Hiking Trails, Scenic Views, Wildlife Spotting, Camping Opportunities, Mountain Biking |
| Wolf Creek | A lesser-known gem that provides a quieter experience for visitors, ideal for those seeking solitude and natural beauty in Kirkwood. | Wolf Creek Trailhead, Hiking Opportunities, Photography, Tranquil Environment, Nature Exploration |
| Meadowview Lodge | A cozy lodge area that provides a perfect home base for exploring Kirkwood’s outdoor offerings, inviting families and small groups looking for comfort and convenience. | Meadowview Lodge, Family-Friendly Activities, Proximity to Trails, Winter Sports Access, Relaxing Atmosphere |
Understanding Airbnb License Requirements & STR Laws in Kirkwood (2026)
While Kirkwood, California, United States currently shows low STR regulations, specific Airbnb license requirements might still exist or change. Always verify the latest short term rental regulations and Airbnb license requirements directly with local government authorities for Kirkwood to ensure full compliance before hosting.
(Source: AirROI data, 2026, finding no licensed listings among those analyzed)
Top Performing Airbnb Properties in Kirkwood (2026)
Benchmark your potential! Explore examples of top-performing Airbnb properties in Kirkwoodbased on Trailing Twelve Month (TTM) revenue. Analyze their characteristics, revenue, occupancy rate, and ADR to understand what drives success in this market.
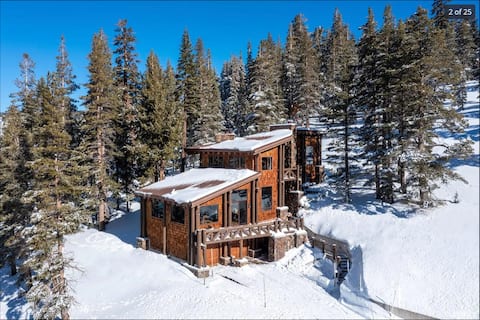
Luxury Kirkwood Mountain House with Amazing Views!
Entire Place • 4 bedrooms
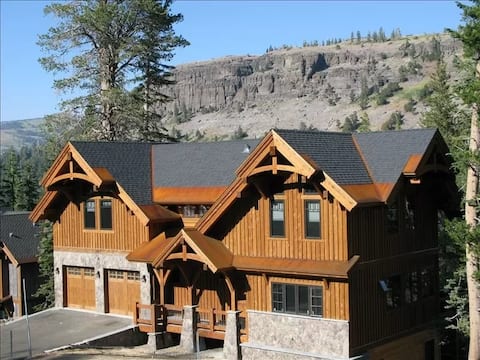
Kirkwood Luxury Palisades Home
Entire Place • 6 bedrooms
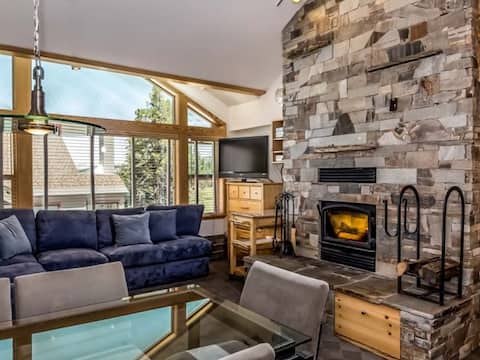
4 Bed + Loft, Gorgeous Kirkwood Condo
Entire Place • 4 bedrooms
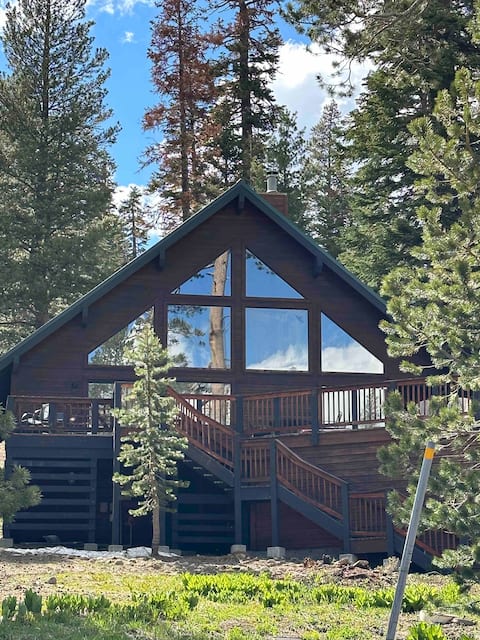
Sunrise Kirkwood Chalet with Red Cliffs View
Entire Place • 3 bedrooms

Wonderful 3 bedroom + loft townhome in Kirkwood
Entire Place • 3 bedrooms

Kirkwood Mountainside Cabin w/Views, Walk to Lifts
Entire Place • 3 bedrooms
Note: Performance varies based on location, size, amenities, seasonality, and management quality. Data reflects the past 12 months.
Top Performing Airbnb Hosts in Kirkwood (2026)
Learn from the best! This table showcases top-performing Airbnb hosts in Kirkwood based on the number of properties managed and estimated total revenue over the past year. Analyze their scale and performance metrics.
| Host Name | Properties | Grossing Revenue | Stay Reviews | Avg Rating |
|---|---|---|---|---|
| John | 7 | $294,264 | 203 | 4.88/5.0 |
| Doug | 12 | $291,587 | 737 | 4.97/5.0 |
| Amie | 3 | $189,703 | 141 | 4.93/5.0 |
| Tim | 5 | $181,382 | 13 | 4.55/5.0 |
| RedAwning | 5 | $163,998 | 59 | 4.08/5.0 |
| Karen | 1 | $157,872 | 31 | 4.97/5.0 |
| Solomon | 6 | $155,972 | 728 | 4.70/5.0 |
| Brett | 1 | $119,880 | 47 | 4.87/5.0 |
| John | 1 | $105,667 | 88 | 4.87/5.0 |
| Leavetown Vacations | 6 | $103,934 | 16 | 3.86/5.0 |
Analyzing the strategies of top hosts, such as their property selection, pricing, and guest communication, can offer valuable lessons for optimizing your own Airbnb operations in Kirkwood.
Dive Deeper: Advanced Kirkwood STR Market Data (2026)
Ready to unlock more insights? AirROI provides access to advanced metrics and comprehensive Airbnb data for Kirkwood. Explore detailed analytics beyond this report to refine your investment strategy, optimize pricing, and maximize your vacation rental profits.
Explore Advanced MetricsKirkwood Short-Term Rental Market Composition (2026): Property & Room Types
Room Type Distribution
Property Type Distribution
Market Composition Insights for Kirkwood
- The Kirkwood Airbnb market composition is heavily skewed towards Entire Home/Apt listings, which make up 94.1% of the 101 active rentals. This indicates strong guest preference for privacy and space.
- Looking at the property type distribution in Kirkwood, Apartment/Condo properties are the most common (67.3%), reflecting the local real estate landscape.
- Houses represent a significant 19.8% portion, catering likely to families or larger groups.
- The presence of 5.9% Hotel/Boutique listings indicates integration with traditional hospitality.
- Smaller segments like others (combined 2.0%) offer potential for unique stay experiences.
Kirkwood Airbnb Room Capacity Analysis (2026): Bedroom Distribution
Distribution of Listings by Number of Bedrooms
Room Capacity Insights for Kirkwood
- The dominant room capacity in Kirkwood is 1 bedroom listings, making up 37.6% of the market. This suggests a strong demand for properties suitable for couples or solo travelers.
- Together, 1 bedroom and 2 bedrooms properties represent 60.4% of the active Airbnb listings in Kirkwood, indicating a high concentration in these sizes.
- A significant 28.7% of listings offer 3+ bedrooms, catering to larger groups and families seeking more space in Kirkwood.
Kirkwood Vacation Rental Guest Capacity Trends (2026)
Distribution of Listings by Guest Capacity
Guest Capacity Insights for Kirkwood
- The most common guest capacity trend in Kirkwood vacation rentals is listings accommodating 8+ guests (38.6%). This suggests the primary traveler segment is likely larger groups.
- Properties designed for 8+ guests and 4 guests dominate the Kirkwood STR market, accounting for 70.3% of listings.
- 51.5% of properties accommodate 6+ guests, serving the market segment for larger families or group travel in Kirkwood.
- On average, properties in Kirkwood are equipped to host 5.7 guests.
Kirkwood Airbnb Booking Patterns (2026): Available vs. Booked Days
Available Days Distribution
Booked Days Distribution
Booking Pattern Insights for Kirkwood
- The most common availability pattern in Kirkwood falls within the 271-366 days range, representing 76.2% of listings. This suggests many properties have significant open periods on their calendars.
- Approximately 98.0% of listings show high availability (181+ days open annually), indicating potential for increased bookings or specific owner usage patterns.
- For booked days, the 31-90 days range is most frequent in Kirkwood (56.4%), reflecting common guest stay durations or potential owner blocking patterns.
- A notable 3.0% of properties secure long booking periods (181+ days booked per year), highlighting successful long-term rental strategies or significant owner usage.
Kirkwood Airbnb Minimum Stay Requirements Analysis
Distribution of Listings by Minimum Night Requirement
1 Night
33 listings
32.7% of total
2 Nights
19 listings
18.8% of total
3 Nights
5 listings
5% of total
30+ Nights
44 listings
43.6% of total
Key Insights
- The most prevalent minimum stay requirement in Kirkwood is 30+ Nights, adopted by 43.6% of listings. This highlights the market's preference for longer commitments.
- A significant segment (43.6%) caters to monthly stays (30+ nights) in Kirkwood, pointing to opportunities in the extended-stay market.
Recommendations
- Align with the market by considering a 30+ Nights minimum stay, as 43.6% of Kirkwood hosts use this setting.
- Explore offering discounts for stays of 30+ nights to attract the 43.6% of the market seeking extended stays.
- Adjust minimum nights based on seasonality – potentially shorter during low season and longer during peak demand periods in Kirkwood.
Kirkwood Airbnb Cancellation Policy Trends Analysis (2026)
Limited
12 listings
11.9% of total
Non-refundable
1 listings
1% of total
Refundable
1 listings
1% of total
Super Strict 60 Days
1 listings
1% of total
Super Strict 30 Days
9 listings
8.9% of total
Flexible
1 listings
1% of total
Moderate
5 listings
5% of total
Firm
56 listings
55.4% of total
Strict
15 listings
14.9% of total
Cancellation Policy Insights for Kirkwood
- The prevailing Airbnb cancellation policy trend in Kirkwood is Firm, used by 55.4% of listings.
- A majority (70.3%) of hosts in Kirkwood utilize Firm or Strict policies, indicating a market where hosts prioritize booking security.
Recommendations for Hosts
- Consider adopting a Firm policy to align with the 55.4% market standard in Kirkwood.
- Using a Strict policy might deter some guests, as only 14.9% of listings use it. Evaluate if potential revenue protection outweighs possible lower booking rates.
- Regularly review your cancellation policy against competitors and market demand shifts in Kirkwood.
Kirkwood STR Booking Lead Time Analysis (2026)
Average Booking Lead Time by Month
Booking Lead Time Insights for Kirkwood
- The overall average booking lead time for vacation rentals in Kirkwood is 59 days.
- Guests book furthest in advance for stays during January (average 85 days), likely coinciding with peak travel demand or local events.
- The shortest booking windows occur for stays in May (average 21 days), indicating more last-minute travel plans during this time.
- Seasonally, Winter (76 days avg.) sees the longest lead times, while Spring (42 days avg.) has the shortest, reflecting typical travel planning cycles.
Recommendations for Hosts
- Use the overall average lead time (59 days) as a baseline for your pricing and availability strategy in Kirkwood.
- For January stays, consider implementing length-of-stay discounts or slightly higher rates for bookings made less than 85 days out to capitalize on advance planning.
- Target marketing efforts for the Winter season well in advance (at least 76 days) to capture early planners.
- Monitor your own booking lead times against these Kirkwood averages to identify opportunities for dynamic pricing adjustments.
Popular & Essential Airbnb Amenities in Kirkwood (2026)
Amenity Prevalence
Amenity Insights for Kirkwood
- Essential amenities in Kirkwood that guests expect include: Wifi, Smoke alarm, TV. Lacking these (any) could significantly impact bookings.
- Popular amenities like Carbon monoxide alarm, Heating, Microwave are common but not universal. Offering these can provide a competitive edge.
Recommendations for Hosts
- Ensure your listing includes all essential amenities for Kirkwood: Wifi, Smoke alarm, TV.
- Prioritize adding missing essentials: Wifi, Smoke alarm, TV.
- Consider adding popular differentiators like Carbon monoxide alarm or Heating to increase appeal.
- Highlight unique or less common amenities you offer (e.g., hot tub, dedicated workspace, EV charger) in your listing description and photos.
- Regularly check competitor amenities in Kirkwood to stay competitive.
Kirkwood Airbnb Guest Demographics & Profile Analysis (2026)
Guest Profile Summary for Kirkwood
- The typical guest profile for Airbnb in Kirkwood consists of primarily domestic travelers (97%), often arriving from nearby San Francisco, typically belonging to the Post-2000s (Gen Z/Alpha) group (50%), primarily speaking English or Spanish.
- Domestic travelers account for 97.4% of guests.
- Key international markets include United States (97.4%) and Canada (0.8%).
- Top languages spoken are English (60.7%) followed by Spanish (11.9%).
- A significant demographic segment is the Post-2000s (Gen Z/Alpha) group, representing 50% of guests.
Recommendations for Hosts
- Target domestic marketing efforts towards travelers from San Francisco and San Jose.
- Tailor amenities and listing descriptions to appeal to the dominant Post-2000s (Gen Z/Alpha) demographic (e.g., highlight fast WiFi, smart home features, local guides).
- Highlight unique local experiences or amenities relevant to the primary guest profile.
- Consider seasonal promotions aligned with peak travel times for key origin markets.
Nearby Short-Term Rental Market Comparison
How does the Kirkwood Airbnb market stack up against its neighbors? Compare key performance metrics like average monthly revenue, ADR, and occupancy rates in surrounding areas to understand the broader regional STR landscape.
| Market | Active Properties | Monthly Revenue | Daily Rate | Avg. Occupancy |
|---|---|---|---|---|
| Wawona | 66 | $7,186 | $548.44 | 45% |
| Yosemite National Park | 227 | $6,835 | $511.03 | 44% |
| Zephyr Cove | 192 | $6,404 | $642.42 | 37% |
| Homewood | 150 | $5,842 | $595.57 | 40% |
| Meyers | 177 | $5,840 | $500.97 | 43% |
| Glenbrook | 32 | $5,788 | $841.74 | 35% |
| Yosemite West | 29 | $5,597 | $423.79 | 49% |
| Carnelian Bay | 349 | $5,362 | $561.69 | 39% |
| Incline Village-Crystal Bay | 204 | $5,197 | $589.54 | 35% |
| Tahoma | 199 | $5,011 | $605.47 | 36% |