Lake Elsinore Airbnb Market Analysis 2026: Short Term Rental Data & Vacation Rental Statistics in California, United States
Is Airbnb profitable in Lake Elsinore in 2026? Explore comprehensive Airbnb analytics for Lake Elsinore, California, United States to uncover income potential. This 2026 STR market report for Lake Elsinore, based on AirROI data from February 2025 to January 2026, reveals key trends in the niche market of 65 active listings.
Whether you're considering an Airbnb investment in Lake Elsinore, optimizing your existing vacation rental, or exploring rental arbitrage opportunities, understanding the Lake Elsinore Airbnb data is crucial. Leveraging the low regulation environment is key to maximizing your short term rental income potential. Let's dive into the specifics.
Key Lake Elsinore Airbnb Performance Metrics Overview
Monthly Airbnb Revenue Variations & Income Potential in Lake Elsinore (2026)
Understanding the monthly revenue variations for Airbnb listings in Lake Elsinore is key to maximizing your short term rental income potential. Seasonality significantly impacts earnings. Our analysis, based on data from the past 12 months, shows that the peak revenue month for STRs in Lake Elsinore is typically July, while February often presents the lowest earnings, highlighting opportunities for strategic pricing adjustments during shoulder and low seasons. Explore the typical Airbnb income in Lake Elsinore across different performance tiers:
- Best-in-class properties (Top 10%) achieve $8,376+ monthly, often utilizing dynamic pricing and superior guest experiences.
- Strong performing properties (Top 25%) earn $5,466 or more, indicating effective management and desirable locations/amenities.
- Typical properties (Median) generate around $3,165 per month, representing the average market performance.
- Entry-level properties (Bottom 25%) see earnings around $1,398, often with potential for optimization.
Average Monthly Airbnb Earnings Trend in Lake Elsinore
Lake Elsinore Airbnb Occupancy Rate Trends (2026)
Maximize your bookings by understanding the Lake Elsinore STR occupancy trends. Seasonal demand shifts significantly influence how often properties are booked. Typically, Julysees the highest demand (peak season occupancy), while January experiences the lowest (low season). Effective strategies, like adjusting minimum stays or offering promotions, can boost occupancy during slower periods. Here's how different property tiers perform in Lake Elsinore:
- Best-in-class properties (Top 10%) achieve 76%+ occupancy, indicating high desirability and potentially optimized availability.
- Strong performing properties (Top 25%) maintain 64% or higher occupancy, suggesting good market fit and guest satisfaction.
- Typical properties (Median) have an occupancy rate around 44%.
- Entry-level properties (Bottom 25%) average 22% occupancy, potentially facing higher vacancy.
Average Monthly Occupancy Rate Trend in Lake Elsinore
Average Daily Rate (ADR) Airbnb Trends in Lake Elsinore (2026)
Effective short term rental pricing strategy in Lake Elsinore involves understanding monthly ADR fluctuations. The Average Daily Rate (ADR) for Airbnb in Lake Elsinore typically peaks in June and dips lowest during February. Leveraging Airbnb dynamic pricing tools or strategies based on this seasonality can significantly boost revenue. Here's a look at the typical nightly rates achieved:
- Best-in-class properties (Top 10%) command rates of $498+ per night, often due to premium features or locations.
- Strong performing properties (Top 25%) achieve nightly rates of $351 or more.
- Typical properties (Median) charge around $215 per night.
- Entry-level properties (Bottom 25%) earn around $93 per night.
Average Daily Rate (ADR) Trend by Month in Lake Elsinore
Get Live Lake Elsinore Market Intelligence 👇
Explore Real-time Analytics
Airbnb Seasonality Analysis & Trends in Lake Elsinore (2026)
Peak Season (July, June, October)
- Revenue averages $4,962 per month
- Occupancy rates average 51.1%
- Daily rates average $263
Shoulder Season
- Revenue averages $3,894 per month
- Occupancy maintains around 43.7%
- Daily rates hold near $252
Low Season (January, February, September)
- Revenue drops to average $2,926 per month
- Occupancy decreases to average 36.7%
- Daily rates adjust to average $243
Seasonality Insights for Lake Elsinore
- The Airbnb seasonality in Lake Elsinore shows highly seasonal trends requiring careful strategy. While the sections above show seasonal averages, it's also insightful to look at the extremes:
- During the high season, the absolute peak month showcases Lake Elsinore's highest earning potential, with monthly revenues capable of climbing to $5,324, occupancy reaching a high of 53.1%, and ADRs peaking at $278.
- Conversely, the slowest single month of the year, typically falling within the low season, marks the market's lowest point. In this month, revenue might dip to $2,403, occupancy could drop to 35.1%, and ADRs may adjust down to $225.
- Understanding both the seasonal averages and these monthly peaks and troughs in revenue, occupancy, and ADR is crucial for maximizing your Airbnb profit potential in Lake Elsinore.
Seasonal Strategies for Maximizing Profit
- Peak Season: Maximize revenue through premium pricing and potentially longer minimum stays. Ensure high availability.
- Low Season: Offer competitive pricing, special promotions (e.g., extended stay discounts), and flexible cancellation policies. Target off-season travelers like remote workers or budget-conscious guests.
- Shoulder Seasons: Implement dynamic pricing that balances peak and low rates. Target weekend travelers or specific events. Offer slightly more flexible terms than peak season.
- Regularly analyze your own performance against these Lake Elsinore seasonality benchmarks and adjust your pricing and availability strategy accordingly.
Best Areas for Airbnb Investment in Lake Elsinore (2026)
Exploring the top neighborhoods for short-term rentals in Lake Elsinore? This section highlights key areas, outlining why they are attractive for hosts and guests, along with notable local attractions. Consider these locations based on your target guest profile and investment strategy.
| Neighborhood / Area | Why Host Here? (Target Guests & Appeal) | Key Attractions & Landmarks |
|---|---|---|
| Canyon Lake | A desirable residential area known for its picturesque views and access to water activities. Attracts families and outdoor enthusiasts looking for a peaceful getaway. | Canyon Lake, Canyon Lake Village, Lake Elsinore Diamond Stadium, Boating and Fishing activities, Canyon Lake Golf Club |
| Lake Elsinore Main Street District | The heart of Lake Elsinore, rich in history and community events. A great location for guests wanting to experience local culture, dining, and entertainment. | Historic Old Town, Lake Elsinore Historical Society, Local shops and cafes, Community events, Lake Elsinore Storm Baseball games |
| Summerly | A developing area with growing amenities and proximity to the lake. Ideal for families and those seeking a suburban lifestyle while still being close to recreational activities. | Summerly Community Park, Lake Elsinore Outlet Center, Historic Elsinore Theater, Outdoor activities at the lake, Nearby golf courses |
| Rosetta Canyon | Known for its family-friendly neighborhoods and convenient access to parks and nature trails. Attractive to families visiting the area and renters looking for comfort. | Rosetta Canyon Sports Park, Lake Elsinore Public Library, Riverside County Regional Park, Hiking and biking trails, Community events |
| Lake Elsinore Wetlands | A natural oasis perfect for outdoor and nature lovers. Offers a unique experience for guests looking to explore the natural beauty and wildlife of the area. | Lake Elsinore Wetlands, Bird watching, Hiking trails, Nature photography, Outdoor picnics |
| Terra Cotta | An upcoming neighborhood featuring modern homes and access to various amenities. Attracts younger guests and professionals looking for a comfortable stay. | Nearby shopping centers, Dining options, Parks and outdoor spaces, Proximity to Lake Elsinore, Fitness centers |
| Ortega Highway | A scenic highway area offering stunning views of the mountains and access to outdoor adventures. Great for visitors interested in hiking and nature explorations. | Cleveland National Forest, Ortega Falls, Hiking and biking trails, Scenic drives, Lake access points |
| East Lake Elsinore | An expanding area with newer developments and family-friendly activities. Offers a suburban feel with easy access to outdoor and recreational pursuits. | Lake Elsinore Sports Park, Nearby schools and educational resources, Access to the lake, Parks and nature spots, Family-friendly amenities |
Understanding Airbnb License Requirements & STR Laws in Lake Elsinore (2026)
While Lake Elsinore, California, United States currently shows low STR regulations, specific Airbnb license requirements might still exist or change. Always verify the latest short term rental regulations and Airbnb license requirements directly with local government authorities for Lake Elsinore to ensure full compliance before hosting.
(Source: AirROI data, 2026, based on 2% licensed listings)
Top Performing Airbnb Properties in Lake Elsinore (2026)
Benchmark your potential! Explore examples of top-performing Airbnb properties in Lake Elsinorebased on Trailing Twelve Month (TTM) revenue. Analyze their characteristics, revenue, occupancy rate, and ADR to understand what drives success in this market.

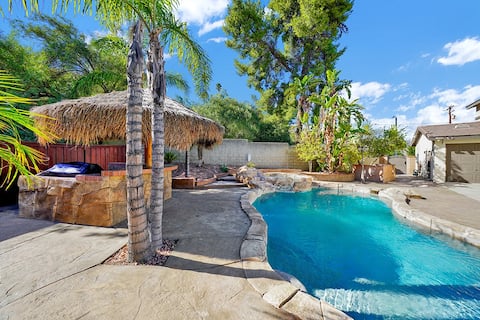
Kimberlys Private Palm Resort w/Salt Pool & Spa*
Entire Place • 6 bedrooms

New 4 Bed Home w/pool/spa, 20 mins from winery’s
Entire Place • 4 bedrooms

Spacious 5-bedroom home for your relaxation needs
Entire Place • 5 bedrooms
Pool•BBQ•View•Balcony•Fireplace•King•W/D
Entire Place • 5 bedrooms

Secluded Large Country Ranch Estate
Entire Place • 5 bedrooms

𝟜𝐵𝑅 /Pool & SPA |Pool Table|Mini Golf|Fire pit
Entire Place • 4 bedrooms
Note: Performance varies based on location, size, amenities, seasonality, and management quality. Data reflects the past 12 months.
Top Performing Airbnb Hosts in Lake Elsinore (2026)
Learn from the best! This table showcases top-performing Airbnb hosts in Lake Elsinore based on the number of properties managed and estimated total revenue over the past year. Analyze their scale and performance metrics.
| Host Name | Properties | Grossing Revenue | Stay Reviews | Avg Rating |
|---|---|---|---|---|
| David | 3 | $222,337 | 415 | 4.93/5.0 |
| Kimberly | 1 | $158,965 | 164 | 4.97/5.0 |
| Seraph | 2 | $148,008 | 186 | 4.83/5.0 |
| Vanessa | 1 | $112,309 | 114 | 4.91/5.0 |
| Ashley | 1 | $101,366 | 100 | 4.92/5.0 |
| Erin | 1 | $97,300 | 109 | 4.99/5.0 |
| Dee | 2 | $94,059 | 205 | 4.98/5.0 |
| Patrick | 1 | $83,059 | 71 | 4.87/5.0 |
| Evolve | 1 | $80,444 | 48 | 4.79/5.0 |
| Sherry | 3 | $77,606 | 56 | 4.62/5.0 |
Analyzing the strategies of top hosts, such as their property selection, pricing, and guest communication, can offer valuable lessons for optimizing your own Airbnb operations in Lake Elsinore.
Dive Deeper: Advanced Lake Elsinore STR Market Data (2026)
Ready to unlock more insights? AirROI provides access to advanced metrics and comprehensive Airbnb data for Lake Elsinore. Explore detailed analytics beyond this report to refine your investment strategy, optimize pricing, and maximize your vacation rental profits.
Explore Advanced MetricsLake Elsinore Short-Term Rental Market Composition (2026): Property & Room Types
Room Type Distribution
Property Type Distribution
Market Composition Insights for Lake Elsinore
- The Lake Elsinore Airbnb market composition is heavily skewed towards Entire Home/Apt listings, which make up 73.8% of the 65 active rentals. This indicates strong guest preference for privacy and space.
- Looking at the property type distribution in Lake Elsinore, House properties are the most common (92.3%), reflecting the local real estate landscape.
- Houses represent a significant 92.3% portion, catering likely to families or larger groups.
- Smaller segments like others, hotel/boutique (combined 7.7%) offer potential for unique stay experiences.
Lake Elsinore Airbnb Room Capacity Analysis (2026): Bedroom Distribution
Distribution of Listings by Number of Bedrooms
Room Capacity Insights for Lake Elsinore
- The dominant room capacity in Lake Elsinore is 4 bedrooms listings, making up 23.1% of the market. This suggests a strong demand for properties suitable for families or small groups.
- Together, 4 bedrooms and 3 bedrooms properties represent 41.6% of the active Airbnb listings in Lake Elsinore, indicating a high concentration in these sizes.
- A significant 57.0% of listings offer 3+ bedrooms, catering to larger groups and families seeking more space in Lake Elsinore.
Lake Elsinore Vacation Rental Guest Capacity Trends (2026)
Distribution of Listings by Guest Capacity
Guest Capacity Insights for Lake Elsinore
- The most common guest capacity trend in Lake Elsinore vacation rentals is listings accommodating 8+ guests (49.2%). This suggests the primary traveler segment is likely larger groups.
- Properties designed for 8+ guests and 4 guests dominate the Lake Elsinore STR market, accounting for 56.9% of listings.
- 55.3% of properties accommodate 6+ guests, serving the market segment for larger families or group travel in Lake Elsinore.
- On average, properties in Lake Elsinore are equipped to host 5.2 guests.
Lake Elsinore Airbnb Booking Patterns (2026): Available vs. Booked Days
Available Days Distribution
Booked Days Distribution
Booking Pattern Insights for Lake Elsinore
- The most common availability pattern in Lake Elsinore falls within the 271-366 days range, representing 47.7% of listings. This suggests many properties have significant open periods on their calendars.
- Approximately 76.9% of listings show high availability (181+ days open annually), indicating potential for increased bookings or specific owner usage patterns.
- For booked days, the 31-90 days range is most frequent in Lake Elsinore (27.7%), reflecting common guest stay durations or potential owner blocking patterns.
- A notable 26.2% of properties secure long booking periods (181+ days booked per year), highlighting successful long-term rental strategies or significant owner usage.
Lake Elsinore Airbnb Minimum Stay Requirements Analysis
Distribution of Listings by Minimum Night Requirement
1 Night
24 listings
36.9% of total
2 Nights
13 listings
20% of total
3 Nights
3 listings
4.6% of total
4-6 Nights
6 listings
9.2% of total
7-29 Nights
1 listings
1.5% of total
30+ Nights
18 listings
27.7% of total
Key Insights
- The most prevalent minimum stay requirement in Lake Elsinore is 1 Night, adopted by 36.9% of listings. This highlights the market's preference for shorter, flexible bookings.
- A significant segment (27.7%) caters to monthly stays (30+ nights) in Lake Elsinore, pointing to opportunities in the extended-stay market.
Recommendations
- Align with the market by considering a 1 Night minimum stay, as 36.9% of Lake Elsinore hosts use this setting.
- Explore offering discounts for stays of 30+ nights to attract the 27.7% of the market seeking extended stays.
- Adjust minimum nights based on seasonality – potentially shorter during low season and longer during peak demand periods in Lake Elsinore.
Lake Elsinore Airbnb Cancellation Policy Trends Analysis (2026)
Limited
1 listings
1.5% of total
Flexible
18 listings
27.7% of total
Moderate
14 listings
21.5% of total
Firm
25 listings
38.5% of total
Strict
7 listings
10.8% of total
Cancellation Policy Insights for Lake Elsinore
- The prevailing Airbnb cancellation policy trend in Lake Elsinore is Firm, used by 38.5% of listings.
- There's a relatively balanced mix between guest-friendly (49.2%) and stricter (49.3%) policies, offering choices for different guest needs.
Recommendations for Hosts
- Consider adopting a Firm policy to align with the 38.5% market standard in Lake Elsinore.
- Using a Strict policy might deter some guests, as only 10.8% of listings use it. Evaluate if potential revenue protection outweighs possible lower booking rates.
- Regularly review your cancellation policy against competitors and market demand shifts in Lake Elsinore.
Lake Elsinore STR Booking Lead Time Analysis (2026)
Average Booking Lead Time by Month
Booking Lead Time Insights for Lake Elsinore
- The overall average booking lead time for vacation rentals in Lake Elsinore is 25 days.
- Guests book furthest in advance for stays during September (average 41 days), likely coinciding with peak travel demand or local events.
- The shortest booking windows occur for stays in February (average 16 days), indicating more last-minute travel plans during this time.
- Seasonally, Fall (39 days avg.) sees the longest lead times, while Winter (23 days avg.) has the shortest, reflecting typical travel planning cycles.
Recommendations for Hosts
- Use the overall average lead time (25 days) as a baseline for your pricing and availability strategy in Lake Elsinore.
- For September stays, consider implementing length-of-stay discounts or slightly higher rates for bookings made less than 41 days out to capitalize on advance planning.
- Target marketing efforts for the Fall season well in advance (at least 39 days) to capture early planners.
- Monitor your own booking lead times against these Lake Elsinore averages to identify opportunities for dynamic pricing adjustments.
Popular & Essential Airbnb Amenities in Lake Elsinore (2026)
Amenity Prevalence
Amenity Insights for Lake Elsinore
- Essential amenities in Lake Elsinore that guests expect include: Wifi, Smoke alarm. Lacking these (any) could significantly impact bookings.
- Popular amenities like Hot water, Free parking on premises, Carbon monoxide alarm are common but not universal. Offering these can provide a competitive edge.
Recommendations for Hosts
- Ensure your listing includes all essential amenities for Lake Elsinore: Wifi, Smoke alarm.
- Prioritize adding missing essentials: Smoke alarm.
- Consider adding popular differentiators like Hot water or Free parking on premises to increase appeal.
- Highlight unique or less common amenities you offer (e.g., hot tub, dedicated workspace, EV charger) in your listing description and photos.
- Regularly check competitor amenities in Lake Elsinore to stay competitive.
Lake Elsinore Airbnb Guest Demographics & Profile Analysis (2026)
Guest Profile Summary for Lake Elsinore
- The typical guest profile for Airbnb in Lake Elsinore consists of primarily domestic travelers (92%), often arriving from nearby Los Angeles, typically belonging to the Post-2000s (Gen Z/Alpha) group (50%), primarily speaking English or Spanish.
- Domestic travelers account for 91.5% of guests.
- Key international markets include United States (91.5%) and United Kingdom (1.7%).
- Top languages spoken are English (62.1%) followed by Spanish (21%).
- A significant demographic segment is the Post-2000s (Gen Z/Alpha) group, representing 50% of guests.
Recommendations for Hosts
- Target domestic marketing efforts towards travelers from Los Angeles and San Diego.
- Tailor amenities and listing descriptions to appeal to the dominant Post-2000s (Gen Z/Alpha) demographic (e.g., highlight fast WiFi, smart home features, local guides).
- Highlight unique local experiences or amenities relevant to the primary guest profile.
- Consider seasonal promotions aligned with peak travel times for key origin markets.
Nearby Short-Term Rental Market Comparison
How does the Lake Elsinore Airbnb market stack up against its neighbors? Compare key performance metrics like average monthly revenue, ADR, and occupancy rates in surrounding areas to understand the broader regional STR landscape.
| Market | Active Properties | Monthly Revenue | Daily Rate | Avg. Occupancy |
|---|---|---|---|---|
| Newport Beach | 1,273 | $8,950 | $744.06 | 47% |
| Rancho San Diego | 25 | $8,649 | $568.72 | 48% |
| Malibu | 251 | $8,293 | $1263.89 | 35% |
| Thousand Palms | 33 | $8,119 | $725.48 | 36% |
| Manhattan Beach | 267 | $7,875 | $585.30 | 53% |
| Lakeside | 33 | $7,537 | $604.33 | 44% |
| GlenOak Hills | 41 | $7,394 | $648.65 | 41% |
| Bermuda Dunes | 143 | $7,324 | $664.90 | 39% |
| Mount Helix | 33 | $7,163 | $594.94 | 50% |
| Del Mar | 128 | $7,011 | $671.56 | 45% |