Livermore Airbnb Market Analysis 2026: Short Term Rental Data & Vacation Rental Statistics in California, United States
Is Airbnb profitable in Livermore in 2026? Explore comprehensive Airbnb analytics for Livermore, California, United States to uncover income potential. This 2026 STR market report for Livermore, based on AirROI data from February 2025 to January 2026, reveals key trends in the niche market of 77 active listings.
Whether you're considering an Airbnb investment in Livermore, optimizing your existing vacation rental, or exploring rental arbitrage opportunities, understanding the Livermore Airbnb data is crucial. Leveraging the low regulation environment is key to maximizing your short term rental income potential. Let's dive into the specifics.
Key Livermore Airbnb Performance Metrics Overview
Monthly Airbnb Revenue Variations & Income Potential in Livermore (2026)
Understanding the monthly revenue variations for Airbnb listings in Livermore is key to maximizing your short term rental income potential. Seasonality significantly impacts earnings. Our analysis, based on data from the past 12 months, shows that the peak revenue month for STRs in Livermore is typically July, while January often presents the lowest earnings, highlighting opportunities for strategic pricing adjustments during shoulder and low seasons. Explore the typical Airbnb income in Livermore across different performance tiers:
- Best-in-class properties (Top 10%) achieve $6,216+ monthly, often utilizing dynamic pricing and superior guest experiences.
- Strong performing properties (Top 25%) earn $3,959 or more, indicating effective management and desirable locations/amenities.
- Typical properties (Median) generate around $2,209 per month, representing the average market performance.
- Entry-level properties (Bottom 25%) see earnings around $1,030, often with potential for optimization.
Average Monthly Airbnb Earnings Trend in Livermore
Livermore Airbnb Occupancy Rate Trends (2026)
Maximize your bookings by understanding the Livermore STR occupancy trends. Seasonal demand shifts significantly influence how often properties are booked. Typically, Julysees the highest demand (peak season occupancy), while January experiences the lowest (low season). Effective strategies, like adjusting minimum stays or offering promotions, can boost occupancy during slower periods. Here's how different property tiers perform in Livermore:
- Best-in-class properties (Top 10%) achieve 85%+ occupancy, indicating high desirability and potentially optimized availability.
- Strong performing properties (Top 25%) maintain 70% or higher occupancy, suggesting good market fit and guest satisfaction.
- Typical properties (Median) have an occupancy rate around 50%.
- Entry-level properties (Bottom 25%) average 23% occupancy, potentially facing higher vacancy.
Average Monthly Occupancy Rate Trend in Livermore
Average Daily Rate (ADR) Airbnb Trends in Livermore (2026)
Effective short term rental pricing strategy in Livermore involves understanding monthly ADR fluctuations. The Average Daily Rate (ADR) for Airbnb in Livermore typically peaks in January and dips lowest during February. Leveraging Airbnb dynamic pricing tools or strategies based on this seasonality can significantly boost revenue. Here's a look at the typical nightly rates achieved:
- Best-in-class properties (Top 10%) command rates of $398+ per night, often due to premium features or locations.
- Strong performing properties (Top 25%) achieve nightly rates of $213 or more.
- Typical properties (Median) charge around $138 per night.
- Entry-level properties (Bottom 25%) earn around $94 per night.
Average Daily Rate (ADR) Trend by Month in Livermore
Get Live Livermore Market Intelligence 👇

Explore Real-time Analytics
Airbnb Seasonality Analysis & Trends in Livermore (2026)
Peak Season (July, June, August)
- Revenue averages $3,971 per month
- Occupancy rates average 55.6%
- Daily rates average $194
Shoulder Season
- Revenue averages $3,218 per month
- Occupancy maintains around 47.2%
- Daily rates hold near $195
Low Season (January, February, September)
- Revenue drops to average $2,470 per month
- Occupancy decreases to average 42.2%
- Daily rates adjust to average $189
Seasonality Insights for Livermore
- The Airbnb seasonality in Livermore shows moderate seasonality with distinct peak and low periods. While the sections above show seasonal averages, it's also insightful to look at the extremes:
- During the high season, the absolute peak month showcases Livermore's highest earning potential, with monthly revenues capable of climbing to $4,277, occupancy reaching a high of 56.6%, and ADRs peaking at $201.
- Conversely, the slowest single month of the year, typically falling within the low season, marks the market's lowest point. In this month, revenue might dip to $2,383, occupancy could drop to 38.6%, and ADRs may adjust down to $174.
- Understanding both the seasonal averages and these monthly peaks and troughs in revenue, occupancy, and ADR is crucial for maximizing your Airbnb profit potential in Livermore.
Seasonal Strategies for Maximizing Profit
- Peak Season: Maximize revenue through premium pricing and potentially longer minimum stays. Ensure high availability.
- Low Season: Offer competitive pricing, special promotions (e.g., extended stay discounts), and flexible cancellation policies. Target off-season travelers like remote workers or budget-conscious guests.
- Shoulder Seasons: Implement dynamic pricing that balances peak and low rates. Target weekend travelers or specific events. Offer slightly more flexible terms than peak season.
- Regularly analyze your own performance against these Livermore seasonality benchmarks and adjust your pricing and availability strategy accordingly.
Best Areas for Airbnb Investment in Livermore (2026)
Exploring the top neighborhoods for short-term rentals in Livermore? This section highlights key areas, outlining why they are attractive for hosts and guests, along with notable local attractions. Consider these locations based on your target guest profile and investment strategy.
| Neighborhood / Area | Why Host Here? (Target Guests & Appeal) | Key Attractions & Landmarks |
|---|---|---|
| Downtown Livermore | The heart of Livermore with a charming small-town feel. It offers various dining, shopping, and entertainment options, making it appealing for both tourists and locals. | Livermore Valley Wine Country, Livermore Performing Arts Center, Livermore Downtown Plaza, Wine Tasting Rooms, Local Art Galleries |
| Livermore Wine Country | Famous for its wineries and vineyards, this area attracts wine lovers and tourists seeking wine tasting experiences in a beautiful setting. | Concannon Vineyard, Wente Vineyards, Mitchell Katz Winery, Domaine Carneros, Veterans Park |
| Laguna Oaks | A residential area that provides a suburban feel with parks and family-friendly amenities. It’s ideal for families looking for longer stays. | Laguna Oaks Park, Nearby schools and community events, Local restaurants and shops |
| South Livermore | Close to several acclaimed wineries and rural landscapes, offering a peaceful retreat for nature lovers and wine enthusiasts. | Garre Vineyard & Winery, Tamas Estates, Ravenswood Historic Site, Hiking trails around Livermore |
| North Livermore | An area with a mix of rural charm and accessibility to the city. Appeals to visitors wanting a quiet stay while being close to urban amenities. | Shadow Cliffs Regional Recreation Area, Del Valle Regional Park, Local farms and markets |
| East Livermore | Features a combination of parks, schools, and residential neighborhoods, making it appealing for families and longer stays. | Sycamore Grove Park, Livermore Community Center, Nearby shopping centers |
| West Livermore | Home to beautiful landscapes, parks, and quick access to hiking trails. It’s perfect for outdoor enthusiasts. | Lake Del Valle, Brentwood Regional Community Center, Livermore Municipal Airport |
| Livermore's Historic District | Rich in history, this area attracts visitors interested in the heritage of Livermore with many preserved buildings and local attractions. | Livermore History Museum, The Bankhead Theater, Historic Main Street shops |
Understanding Airbnb License Requirements & STR Laws in Livermore (2026)
While Livermore, California, United States currently shows low STR regulations, specific Airbnb license requirements might still exist or change. Always verify the latest short term rental regulations and Airbnb license requirements directly with local government authorities for Livermore to ensure full compliance before hosting.
(Source: AirROI data, 2026, finding no licensed listings among those analyzed)
Top Performing Airbnb Properties in Livermore (2026)
Benchmark your potential! Explore examples of top-performing Airbnb properties in Livermorebased on Trailing Twelve Month (TTM) revenue. Analyze their characteristics, revenue, occupancy rate, and ADR to understand what drives success in this market.
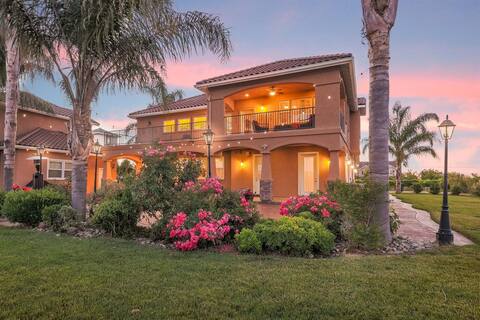
Superbowl HQ Estate | 35 Minutes To Levi Stadium
Entire Place • 8 bedrooms
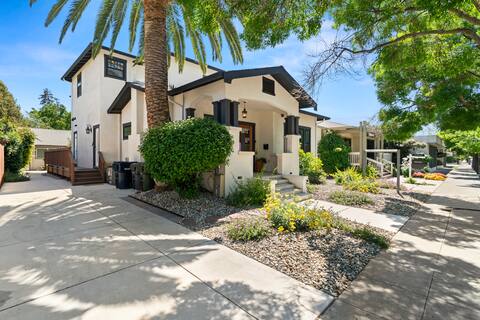
High Design 5 bedroom In Downtown Livermore
Entire Place • 5 bedrooms
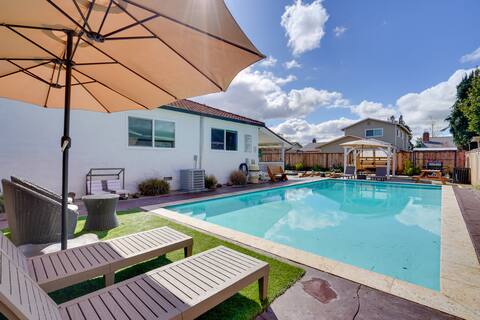
Sun-Soaked Livermore Gem with Patio & Fire Pit!
Entire Place • 4 bedrooms

Vin de Livermore -Stylish House - DTWN Close
Entire Place • 3 bedrooms

Heart of Livermore
Entire Place • 2 bedrooms

Walk to Downtown Livermore ~ Patio ~ New Kitchen
Entire Place • 2 bedrooms
Note: Performance varies based on location, size, amenities, seasonality, and management quality. Data reflects the past 12 months.
Top Performing Airbnb Hosts in Livermore (2026)
Learn from the best! This table showcases top-performing Airbnb hosts in Livermore based on the number of properties managed and estimated total revenue over the past year. Analyze their scale and performance metrics.
| Host Name | Properties | Grossing Revenue | Stay Reviews | Avg Rating |
|---|---|---|---|---|
| Alissa | 1 | $322,832 | 81 | 4.99/5.0 |
| Amy | 4 | $162,527 | 496 | 4.98/5.0 |
| Carol | 1 | $110,501 | 61 | 5.00/5.0 |
| Evolve | 1 | $90,213 | 82 | 4.96/5.0 |
| Blanca | 2 | $83,540 | 135 | 4.67/5.0 |
| Hamzeh | 2 | $83,065 | 634 | 4.92/5.0 |
| Gladys | 1 | $73,660 | 124 | 4.96/5.0 |
| Katie | 3 | $65,154 | 337 | 4.90/5.0 |
| Edmond | 2 | $62,677 | 15 | 4.94/5.0 |
| Mercina | 1 | $60,417 | 38 | 4.97/5.0 |
Analyzing the strategies of top hosts, such as their property selection, pricing, and guest communication, can offer valuable lessons for optimizing your own Airbnb operations in Livermore.
Dive Deeper: Advanced Livermore STR Market Data (2026)
Ready to unlock more insights? AirROI provides access to advanced metrics and comprehensive Airbnb data for Livermore. Explore detailed analytics beyond this report to refine your investment strategy, optimize pricing, and maximize your vacation rental profits.
Explore Advanced MetricsLivermore Short-Term Rental Market Composition (2026): Property & Room Types
Room Type Distribution
Property Type Distribution
Market Composition Insights for Livermore
- The Livermore Airbnb market composition is heavily skewed towards Entire Home/Apt listings, which make up 70.1% of the 77 active rentals. This indicates strong guest preference for privacy and space.
- Looking at the property type distribution in Livermore, House properties are the most common (59.7%), reflecting the local real estate landscape.
- Houses represent a significant 59.7% portion, catering likely to families or larger groups.
- The presence of 28.6% Hotel/Boutique listings indicates integration with traditional hospitality.
- Smaller segments like outdoor/unique (combined 1.3%) offer potential for unique stay experiences.
Livermore Airbnb Room Capacity Analysis (2026): Bedroom Distribution
Distribution of Listings by Number of Bedrooms
Room Capacity Insights for Livermore
- The dominant room capacity in Livermore is 1 bedroom listings, making up 39% of the market. This suggests a strong demand for properties suitable for couples or solo travelers.
- Together, 1 bedroom and 3 bedrooms properties represent 52.0% of the active Airbnb listings in Livermore, indicating a high concentration in these sizes.
Livermore Vacation Rental Guest Capacity Trends (2026)
Distribution of Listings by Guest Capacity
Guest Capacity Insights for Livermore
- The most common guest capacity trend in Livermore vacation rentals is listings accommodating 2 guests (31.2%). This suggests the primary traveler segment is likely couples or solo travelers.
- Properties designed for 2 guests and 8+ guests dominate the Livermore STR market, accounting for 44.2% of listings.
- 22.1% of properties accommodate 6+ guests, serving the market segment for larger families or group travel in Livermore.
- On average, properties in Livermore are equipped to host 2.9 guests.
Livermore Airbnb Booking Patterns (2026): Available vs. Booked Days
Available Days Distribution
Booked Days Distribution
Booking Pattern Insights for Livermore
- The most common availability pattern in Livermore falls within the 271-366 days range, representing 45.5% of listings. This suggests many properties have significant open periods on their calendars.
- Approximately 74.1% of listings show high availability (181+ days open annually), indicating potential for increased bookings or specific owner usage patterns.
- For booked days, the 31-90 days range is most frequent in Livermore (32.5%), reflecting common guest stay durations or potential owner blocking patterns.
- A notable 28.6% of properties secure long booking periods (181+ days booked per year), highlighting successful long-term rental strategies or significant owner usage.
Livermore Airbnb Minimum Stay Requirements Analysis
Distribution of Listings by Minimum Night Requirement
1 Night
19 listings
24.7% of total
2 Nights
11 listings
14.3% of total
3 Nights
4 listings
5.2% of total
4-6 Nights
5 listings
6.5% of total
7-29 Nights
15 listings
19.5% of total
30+ Nights
23 listings
29.9% of total
Key Insights
- The most prevalent minimum stay requirement in Livermore is 30+ Nights, adopted by 29.9% of listings. This highlights the market's preference for longer commitments.
- A significant segment (29.9%) caters to monthly stays (30+ nights) in Livermore, pointing to opportunities in the extended-stay market.
Recommendations
- Align with the market by considering a 30+ Nights minimum stay, as 29.9% of Livermore hosts use this setting.
- If feasible, allowing 1-night stays, especially midweek or during low season, could capture last-minute bookings, as only 24.7% currently do.
- Explore offering discounts for stays of 30+ nights to attract the 29.9% of the market seeking extended stays.
- Adjust minimum nights based on seasonality – potentially shorter during low season and longer during peak demand periods in Livermore.
Livermore Airbnb Cancellation Policy Trends Analysis (2026)
Super Strict 60 Days
2 listings
2.6% of total
Limited
1 listings
1.3% of total
Flexible
19 listings
24.7% of total
Moderate
21 listings
27.3% of total
Firm
23 listings
29.9% of total
Strict
11 listings
14.3% of total
Cancellation Policy Insights for Livermore
- The prevailing Airbnb cancellation policy trend in Livermore is Firm, used by 29.9% of listings.
- There's a relatively balanced mix between guest-friendly (52.0%) and stricter (44.2%) policies, offering choices for different guest needs.
Recommendations for Hosts
- Consider adopting a Firm policy to align with the 29.9% market standard in Livermore.
- Using a Strict policy might deter some guests, as only 14.3% of listings use it. Evaluate if potential revenue protection outweighs possible lower booking rates.
- Regularly review your cancellation policy against competitors and market demand shifts in Livermore.
Livermore STR Booking Lead Time Analysis (2026)
Average Booking Lead Time by Month
Booking Lead Time Insights for Livermore
- The overall average booking lead time for vacation rentals in Livermore is 38 days.
- Guests book furthest in advance for stays during July (average 55 days), likely coinciding with peak travel demand or local events.
- The shortest booking windows occur for stays in January (average 20 days), indicating more last-minute travel plans during this time.
- Seasonally, Summer (50 days avg.) sees the longest lead times, while Winter (29 days avg.) has the shortest, reflecting typical travel planning cycles.
Recommendations for Hosts
- Use the overall average lead time (38 days) as a baseline for your pricing and availability strategy in Livermore.
- For July stays, consider implementing length-of-stay discounts or slightly higher rates for bookings made less than 55 days out to capitalize on advance planning.
- Target marketing efforts for the Summer season well in advance (at least 50 days) to capture early planners.
- Monitor your own booking lead times against these Livermore averages to identify opportunities for dynamic pricing adjustments.
Popular & Essential Airbnb Amenities in Livermore (2026)
Amenity Prevalence
Amenity Insights for Livermore
- Essential amenities in Livermore that guests expect include: Smoke alarm, Wifi. Lacking these (any) could significantly impact bookings.
- Popular amenities like Air conditioning, Hot water, Heating are common but not universal. Offering these can provide a competitive edge.
Recommendations for Hosts
- Ensure your listing includes all essential amenities for Livermore: Smoke alarm, Wifi.
- Prioritize adding missing essentials: Smoke alarm, Wifi.
- Consider adding popular differentiators like Air conditioning or Hot water to increase appeal.
- Highlight unique or less common amenities you offer (e.g., hot tub, dedicated workspace, EV charger) in your listing description and photos.
- Regularly check competitor amenities in Livermore to stay competitive.
Livermore Airbnb Guest Demographics & Profile Analysis (2026)
Guest Profile Summary for Livermore
- The typical guest profile for Airbnb in Livermore consists of primarily domestic travelers (93%), often arriving from nearby San Francisco, typically belonging to the Post-2000s (Gen Z/Alpha) group (50%), primarily speaking English or Spanish.
- Domestic travelers account for 92.8% of guests.
- Key international markets include United States (92.8%) and Switzerland (1.4%).
- Top languages spoken are English (69.2%) followed by Spanish (13.6%).
- A significant demographic segment is the Post-2000s (Gen Z/Alpha) group, representing 50% of guests.
Recommendations for Hosts
- Target domestic marketing efforts towards travelers from San Francisco and Grass Valley.
- Tailor amenities and listing descriptions to appeal to the dominant Post-2000s (Gen Z/Alpha) demographic (e.g., highlight fast WiFi, smart home features, local guides).
- Highlight unique local experiences or amenities relevant to the primary guest profile.
- Consider seasonal promotions aligned with peak travel times for key origin markets.
Nearby Short-Term Rental Market Comparison
How does the Livermore Airbnb market stack up against its neighbors? Compare key performance metrics like average monthly revenue, ADR, and occupancy rates in surrounding areas to understand the broader regional STR landscape.
| Market | Active Properties | Monthly Revenue | Daily Rate | Avg. Occupancy |
|---|---|---|---|---|
| Carmel Point | 15 | $14,483 | $1046.17 | 54% |
| Del Monte Forest | 105 | $10,280 | $964.89 | 47% |
| Moss Beach | 34 | $10,092 | $676.91 | 53% |
| Sonoma | 228 | $9,647 | $819.87 | 43% |
| Marshall | 18 | $8,897 | $607.75 | 50% |
| St. Helena | 50 | $8,684 | $924.70 | 38% |
| Carmel-by-the-Sea | 305 | $8,657 | $680.02 | 49% |
| Kenwood | 60 | $8,643 | $810.83 | 41% |
| Glen Ellen | 85 | $8,482 | $799.53 | 43% |
| Eldridge | 21 | $8,410 | $930.61 | 41% |