Los Angeles, California Airbnb Market Data 2026: STR Report & Statistics
How much can you earn on Airbnb in Los Angeles, California? Based on AirROI's 2026 dataset (August 2025 – July 2026), the short answer is $31,130 per year — at a $304 nightly rate, 41.5% occupancy, and a $126 RevPAR that reflects moderate rate-to-revenue efficiency with room to optimize.
Los Angeles's 9,919 active listings and moderate demand with room for well-positioned listings to outperform make it a major short-term rental market. Supply grew 5.2% and nightly rates have risen, creating an environment where the most bookable listings stand to capture outsized share. Hosts who pair competitive pricing with strong guest experience are well-positioned to convert the growing traveler base into consistent bookings.
Regulation is high, and hosts should factor licensing costs and compliance timelines into their launch plan. For data-driven hosts, the opportunity lies in reading these signals and positioning accordingly.

Table of Contents [hide] [show]
What Are the Key Airbnb Metrics in Los Angeles?
In Los Angeles, the headline Airbnb metrics are $31,130 in average annual revenue,41.5% occupancy, $304 ADR, and $126 in RevPAR, and guests book about 36 days in advance.
How Much Do Airbnb Hosts Earn Monthly in Los Angeles?
Understanding the monthly revenue variations for Airbnb listings in Los Angeles is key to maximizing your short term rental income potential. Seasonality significantly impacts earnings. Our analysis, based on data from the past 12 months, shows that the peak revenue month for STRs in Los Angeles is typically June, while January often presents the lowest earnings, highlighting opportunities for strategic pricing adjustments during shoulder and low seasons. Explore the typical Airbnb income in Los Angeles across different performance tiers:
- Best-in-class properties (Top 10%) achieve $10,528+ monthly, often utilizing dynamic pricing and superior guest experiences.
- Strong performing properties (Top 25%) earn $5,839 or more, indicating effective management and desirable locations/amenities.
- Typical properties (Median) generate around $2,969 per month, representing the average market performance.
- Entry-level properties (Bottom 25%) see earnings around $1,212, often with potential for optimization.
Average Monthly Airbnb Earnings Trend in Los Angeles
What Is the Monthly Airbnb Occupancy Rate in Los Angeles?
Maximize your bookings by understanding the Los Angeles STR occupancy trends. Seasonal demand shifts significantly influence how often properties are booked. Typically, Augustsees the highest demand (peak season occupancy), while July experiences the lowest (low season). Effective strategies, like adjusting minimum stays or offering promotions, can boost occupancy during slower periods. Here's how different property tiers perform in Los Angeles:
- Best-in-class properties (Top 10%) achieve 84%+ occupancy, indicating high desirability and potentially optimized availability.
- Strong performing properties (Top 25%) maintain 69% or higher occupancy, suggesting good market fit and guest satisfaction.
- Typical properties (Median) have an occupancy rate around 46%.
- Entry-level properties (Bottom 25%) average 21% occupancy, potentially facing higher vacancy.
Average Monthly Occupancy Rate Trend in Los Angeles
What Is the Average Airbnb Nightly Rate in Los Angeles?
Effective short term rental pricing strategy in Los Angeles involves understanding monthly ADR fluctuations. The Average Daily Rate (ADR) for Airbnb in Los Angeles typically peaks in June and dips lowest during February. Leveraging Airbnb dynamic pricing tools or strategies based on this seasonality can significantly boost revenue. Here's a look at the typical nightly rates achieved:
- Best-in-class properties (Top 10%) command rates of $614+ per night, often due to premium features or locations.
- Strong performing properties (Top 25%) achieve nightly rates of $335 or more.
- Typical properties (Median) charge around $176 per night.
- Entry-level properties (Bottom 25%) earn around $105 per night.
Average Daily Rate (ADR) Trend by Month in Los Angeles
What Is the RevPAR for Airbnb in Los Angeles?
RevPAR in Los Angeles is currently $126. Because RevPAR combines nightly rates with realized occupancy, it is one of the cleanest ways to compare how efficiently listings turn demand into revenue across the market.
- Entry-level properties (Bottom 25%) see $39 RevPAR.
- Typical properties (Median) generate $80 RevPAR.
- Strong performers (Top 25%) earn $156 RevPAR.
- Best-in-class (Top 10%) achieve $281 RevPAR.
Average Monthly RevPAR Trend in Los Angeles
RevPAR Insights for Los Angeles
- The average RevPAR in Los Angeles is $126. This metric combines nightly rates with realized occupancy, making it one of the best single-number indicators of market efficiency.
- The gap between the top 10% ($281) and bottom 25% ($39) is $242, indicating significant performance disparity driven by property quality, pricing strategy, and location.
- RevPAR peaks in Jun and bottoms out in Jan, mirroring the broader seasonal demand pattern and suggesting opportunities for dynamic pricing.
Recommendations for Hosts
- Track your own RevPAR monthly against these Los Angeles benchmarks. If your RevPAR falls below the median of $80, examine whether low occupancy or low ADR is the primary drag.
- Top-quartile listings achieve $156+ RevPAR through a combination of competitive pricing, strong reviews, and strategic amenities. Target this tier through incremental improvements.
- Use RevPAR rather than revenue alone when comparing properties of different sizes — it normalizes for available nights and gives a more accurate picture of performance.
Get Live Los Angeles Market Intelligence 👇
Explore Real-time Analytics
When Is the Peak Season for Airbnb in Los Angeles?
Los Angeles's peak Airbnb season falls in June, August, March, while the softest stretch is January, February, July. Overall, the market shows moderate seasonality with distinct peak and low periods, which should guide pricing, minimum stays, and cash-flow planning.
Peak Season (June, August, March)
- Revenue averages $5,419 per month
- Occupancy rates average 47.8%
- Daily rates average $307
Shoulder Season
- Revenue averages $4,575 per month
- Occupancy maintains around 47.1%
- Daily rates hold near $284
Low Season (January, February, July)
- Revenue drops to average $4,074 per month
- Occupancy decreases to average 41.5%
- Daily rates adjust to average $294
Seasonality Insights for Los Angeles
- The Airbnb seasonality pattern in Los Angeles shows moderate seasonality with distinct peak and low periods. While the sections above show seasonal averages, it is also insightful to look at the extremes:
- During the high season, the absolute peak month showcases Los Angeles's highest earning potential, with monthly revenues climbing to $5,969, occupancy reaching 51.0%, and ADRs peaking at $353.
- Conversely, the slowest single month marks the market's lowest point — revenue may dip to $4,035, occupancy could drop to 30.0%, and ADRs may adjust to $272.
- Understanding both the seasonal averages and these monthly peaks and troughs in revenue, occupancy, and ADR is crucial for maximizing your Airbnb profit potential in Los Angeles.
Seasonal Strategies for Maximizing Profit
- Peak Season: Maximize revenue through premium pricing. In a high-regulation market like Los Angeles, ensure your permit covers the number of nights you plan to book — some jurisdictions cap annual rental days.
- Low Season: Offer competitive pricing, extended-stay discounts, and flexible cancellation policies. Target off-season travelers like remote workers, budget-conscious guests, and travelers with flexible schedules.
- Shoulder Seasons: Implement dynamic pricing that bridges peak and low rates. Target weekend travelers, local events, and business visitors. Slightly more flexible terms than peak season can help maintain occupancy without deep discounting.
- Regularly analyze your own performance against these Los Angeles seasonality benchmarks and adjust your pricing and availability strategy accordingly.
Do You Need a License for Airbnb in Los Angeles?
Los Angeles, California, United States has a high regulation classification, yet only 55% of listings show registration evidence. That gap between regulation on the books and compliance on the ground can shift quickly — municipalities often tighten enforcement in waves, putting unregistered operators at risk of fines or delisting. Always verify the latest short-term rental regulations and Airbnb license requirements directly with local government authorities for Los Angeles to ensure full compliance before hosting.
(Source: AirROI data, 2026, based on 55% licensed listings)
What Are the Best Neighborhoods for Airbnb in Los Angeles?
In a large, heavily regulated market like Los Angeles, neighborhood selection is one of the strongest levers for Airbnb investment performance. Zoning rules, permitting availability, and guest demand patterns can vary block by block. The 8 neighborhoods below represent areas where short-term rental activity concentrates — understanding why each one attracts guests and hosts helps investors evaluate where their property type and budget fit best.
| Neighborhood / Area | Why Host Here? (Target Guests & Appeal) | Key Attractions & Landmarks |
|---|---|---|
| Hollywood | Famous for its entertainment industry, Hollywood attracts tourists interested in movies, stars, and nightlife. It's a vibrant neighborhood with numerous attractions and events. | Hollywood Walk of Fame, Hollywood Sign, TCL Chinese Theatre, Hollywood Bowl, Griffith Observatory |
| Santa Monica | A coastal paradise known for its beautiful beaches, Santa Monica is a prime destination for tourists. The iconic pier and shopping areas attract many visitors year-round. | Santa Monica Pier, Third Street Promenade, Santa Monica State Beach, Palisades Park, Annenberg Community Beach House |
| Venice Beach | Known for its bohemian spirit, Venice Beach is famous for its boardwalk, street performers, and artistic vibe. It's popular among tourists looking for a unique beach experience. | Venice Beach Boardwalk, Muscle Beach, Venice Canals, Abbot Kinney Boulevard, Venice Skate Park |
| Downtown LA | The cultural and financial hub of Los Angeles, Downtown offers a mix of business and leisure. Attractions like LA Live and the Arts District draw a lot of visitors. | Walt Disney Concert Hall, The Broad Museum, LA Live, Staples Center, Pershing Square |
| West Hollywood | Known for its trendy nightlife and upscale shopping, West Hollywood attracts a fashionable crowd and tourists looking to experience luxury and entertainment. | Sunset Strip, Melrose Avenue, The Getty Center, Santa Monica Boulevard, West Hollywood Park |
| Beverly Hills | Famous for its luxurious lifestyle, Beverly Hills attracts visitors who want to experience high-end shopping and celebrity culture. It's home to stunning homes and scenic drives. | Rodeo Drive, Beverly Hills Hotel, Greystone Mansion, Beverly Gardens Park, Los Angeles County Museum of Art (LACMA) |
| Pasadena | Known for its historic charm and cultural attractions, Pasadena offers a more relaxed vibe with beautiful architecture and outdoor spaces, appealing to families and art lovers. | Rose Bowl, Pasadena Playhouse, Norton Simon Museum, Old Town Pasadena, Brookside Park |
| Silver Lake | A trendy neighborhood known for its artistic community and diverse culture. Silver Lake attracts a hip, young crowd looking for unique neighborhoods and local experiences. | Silver Lake Reservoir, Sunset Junction, Griffith Park, Local boutiques and cafes, Silver Lake Farmers Market |
Because Los Angeles has a high regulation profile, confirming that short-term rental permits are available in your target neighborhood is a critical first step before committing to a property purchase. Regulation can vary at the neighborhood or district level even within the same city.
What Types of Properties Are on Airbnb in Los Angeles?
Room Type Distribution
Property Type Distribution
Market Composition Insights for Los Angeles
- The Los Angeles Airbnb market composition is heavily skewed towards Entire Home/Apt listings, which make up 82% of the 9,919 active rentals. This indicates strong guest preference for privacy and space.
- Looking at the property type distribution in Los Angeles, House properties are the most common (51.8%), reflecting the local real estate landscape.
- Houses represent a significant 51.8% portion, catering likely to families or larger groups.
- The presence of 11.5% Hotel/Boutique listings indicates integration with traditional hospitality.
- Smaller segments like others, outdoor/unique (combined 5.0%) offer potential for unique stay experiences.
Los Angeles Airbnb Room Capacity Analysis (2026): Bedroom Distribution
Distribution of Listings by Number of Bedrooms
Room Capacity Insights for Los Angeles
- The dominant room capacity in Los Angeles is 1 bedroom listings, making up 32% of the market. This suggests a strong demand for properties suitable for couples or solo travelers.
- Together, 1 bedroom and 2 bedrooms properties represent 51.9% of the active Airbnb listings in Los Angeles, indicating a high concentration in these sizes.
- A significant 26.4% of listings offer 3+ bedrooms, catering to larger groups and families seeking more space in Los Angeles.
Los Angeles Vacation Rental Guest Capacity Trends (2026)
Distribution of Listings by Guest Capacity
Guest Capacity Insights for Los Angeles
- The most common guest capacity trend in Los Angeles vacation rentals is listings accommodating 2 guests (26.1%). This suggests the primary traveler segment is likely couples or solo travelers.
- Properties designed for 2 guests and 4 guests dominate the Los Angeles STR market, accounting for 42.6% of listings.
- 29.9% of properties accommodate 6+ guests, serving the market segment for larger families or group travel in Los Angeles.
- On average, properties in Los Angeles are equipped to host 3.8 guests.
How Do Listings in Los Angeles Compare on Quality?
Listing quality in Los Angeles can be approximated through presentation depth, bedroom count, and how often hosts disclose exact locations. These signals show how professionally the local supply base is merchandised.
Listing Quality Insights for Los Angeles
- At 29.8 photos per listing on average, Los Angeles hosts invest well in visual presentation. Listings with 20+ photos consistently outperform in search ranking and conversion.
- 17.5% of listings show their exact location. Lower disclosure rates can increase booking hesitation — guests want to know exactly where they are staying.
Recommendations for Hosts
- Enable exact location if possible — it removes a common source of guest uncertainty and can improve your listing's position in map-based searches.
- Use these quality indicators as a self-audit checklist. Listings that exceed the Los Angeles averages across all three metrics are better positioned for premium pricing.
What Amenities Do Airbnb Guests Expect in Los Angeles?
Amenity Prevalence
Amenity Insights for Los Angeles
- Essential amenities in Los Angeles that guests expect include: Wifi, Smoke alarm, Air conditioning, Heating. Lacking these (any) could significantly impact bookings.
- Popular amenities like TV, Carbon monoxide alarm, Hot water are common but not universal. Offering these can provide a competitive edge.
Recommendations for Hosts
- Ensure your listing includes all essential amenities for Los Angeles: Wifi, Smoke alarm, Air conditioning, Heating.
- Prioritize adding missing essentials: Wifi, Smoke alarm, Air conditioning, Heating.
- Consider adding popular differentiators like TV or Carbon monoxide alarm to increase appeal.
- Highlight unique or less common amenities you offer (e.g., hot tub, dedicated workspace, EV charger) in your listing description and photos.
- Regularly check competitor amenities in Los Angeles to stay competitive.
Which Airbnb Amenities Boost Revenue in Los Angeles?
Not every amenity matters equally. This table focuses on the amenities most associated with higher revenue in Los Angeles, which makes it more useful for prioritizing upgrades than a simple popularity list alone.
| Amenity | Prevalence | Revenue With | Revenue Without | Revenue Uplift |
|---|---|---|---|---|
Kitchen | 91.1% | $34,084 | $826 | 4027.0% |
Dishes and silverware | 86.0% | $35,638 | $3,399 | 948.5% |
Hair dryer | 82.3% | $36,968 | $3,956 | 834.5% |
Security systemHigh opportunity | 0.1% | $250,140 | $31,020 | 706.4% |
BarHigh opportunity | 0.1% | $196,862 | $30,963 | 535.8% |
Gated propertyHigh opportunity | 0.2% | $135,443 | $30,972 | 337.3% |
Cooking basics | 82.0% | $36,088 | $8,615 | 318.9% |
Washer | 82.3% | $35,385 | $11,406 | 210.2% |
Life size gamesHigh opportunity | 1.3% | $92,055 | $30,352 | 203.3% |
Dryer | 77.9% | $36,357 | $12,703 | 186.2% |
Revenue Impact Insights for Los Angeles
- Kitchen tops the revenue impact list with a 4027.0% uplift — listings with this amenity earn $34,084 vs. $826 without it.
- High-opportunity amenities — Security system, Bar, Gated property — combine revenue uplift above 100% with prevalence under 10%, meaning most competitors haven't adopted them yet.
- Kitchen, Dishes and silverware, Hair dryer, Cooking basics, Washer — while widespread — still correlate with meaningful revenue gains, making them table stakes rather than true differentiators.
Recommendations for Hosts
- Prioritize adding Security system — it has the best combination of high revenue impact and low market saturation in Los Angeles.
- Focus your upgrade budget on amenities in the top half of this table. Below-median amenities may improve guest experience but contribute less to revenue growth.
- Highlight revenue-impacting amenities prominently in your listing title, photos, and description — guests can't value what they don't notice.
Dive Deeper: Advanced Los Angeles STR Market Data (2026)
Ready to unlock more insights? AirROI provides access to advanced metrics and comprehensive Airbnb data for Los Angeles. Explore detailed analytics beyond this report to refine your investment strategy, optimize pricing, and maximize your vacation rental profits.
Explore Advanced MetricsLos Angeles Airbnb Guest Demographics & Profile Analysis (2026)
Guest Profile Summary for Los Angeles
- The typical guest profile for Airbnb in Los Angeles consists of primarily domestic travelers (82%), often arriving from nearby Los Angeles, typically belonging to the Post-2000s (Gen Z/Alpha) group (50%), primarily speaking English or Spanish.
- Domestic travelers account for 82.4% of guests.
- Key international markets include United States (82.4%) and United Kingdom (2.8%).
- Top languages spoken are English (58.4%) followed by Spanish (16%).
- A significant demographic segment is the Post-2000s (Gen Z/Alpha) group, representing 50% of guests.
Recommendations for Hosts
- Target domestic marketing efforts towards travelers from Los Angeles and New York.
- Tailor amenities and listing descriptions to appeal to the dominant Post-2000s (Gen Z/Alpha) demographic (e.g., highlight fast WiFi, smart home features, local guides).
- Highlight unique local experiences or amenities relevant to the primary guest profile.
- Consider seasonal promotions aligned with peak travel times for key origin markets.
What Are Airbnb Guest Ratings in Los Angeles?
Listings in Los Angeles average 4.82 out of 5 overall, with about 64.4 reviews per active listing and 35.2% of listings carrying the Guest Favorite badge.
Rating Breakdown by Category
Guest Rating Insights for Los Angeles
- With an overall rating of 4.82, Los Angeles listings meet an exceptionally high bar. Guests consistently report strong satisfaction, which drives repeat bookings and referral traffic.
- The strongest subcategory is Communication (4.89), while Value (4.73) trails behind — a useful signal for hosts looking to prioritize upgrades.
- 35.2% of listings carry the Guest Favorite badge, a strong trust signal that can meaningfully lift click-through and booking rates.
Recommendations for Hosts
- Focus improvement efforts on Value — even small gains in the weakest subcategory can lift overall ratings and search ranking.
- Encourage guests to leave reviews after checkout. Listings with more reviews rank higher in search results and convert browsers into bookers more effectively.
Los Angeles Airbnb Booking Patterns (2026): Available vs. Booked Days
Available Days Distribution
Booked Days Distribution
Booking Pattern Insights for Los Angeles
- The most common availability pattern in Los Angeles falls within the 271-366 days range, representing 57.1% of listings. This suggests many properties have significant open periods on their calendars.
- Approximately 81.8% of listings show high availability (181+ days open annually), indicating potential for increased bookings or specific owner usage patterns.
- For booked days, the 31-90 days range is most frequent in Los Angeles (28.8%), reflecting common guest stay durations or potential owner blocking patterns.
- A notable 19.2% of properties secure long booking periods (181+ days booked per year), highlighting successful long-term rental strategies or significant owner usage.
How Far in Advance Do Guests Book Airbnb in Los Angeles?
Average Booking Lead Time by Month
Booking Lead Time Insights for Los Angeles
- The overall average booking lead time for vacation rentals in Los Angeles is 36 days.
- Guests book furthest in advance for stays during July (average 63 days), likely coinciding with peak travel demand or local events.
- The shortest booking windows occur for stays in January (average 29 days), indicating more last-minute travel plans during this time.
- Seasonally, Summer (51 days avg.) sees the longest lead times, while Winter (31 days avg.) has the shortest, reflecting typical travel planning cycles.
Recommendations for Hosts
- Use the overall average lead time (36 days) as a baseline for your pricing and availability strategy in Los Angeles.
- For July stays, consider implementing length-of-stay discounts or slightly higher rates for bookings made less than 63 days out to capitalize on advance planning.
- Target marketing efforts for the Summer season well in advance (at least 51 days) to capture early planners.
- Monitor your own booking lead times against these Los Angeles averages to identify opportunities for dynamic pricing adjustments.
What Is the Average Length of Stay for Airbnb in Los Angeles?
Guests in Los Angeles stay about 10.7 nights on average, generating roughly 161,094 reservations and 16.4 bookings per listing in the latest AirROI dataset. The most common check-in time is 3:00 PM and check-out is 11:00 AM.
Monthly Length of Stay in Los Angeles
Check-in Time Distribution
Check-out Time Distribution
Stay Pattern Insights for Los Angeles
- Longer stays mean fewer turnovers and lower cleaning costs per revenue dollar. This pattern also opens the door to monthly discount strategies that attract remote workers and extended-stay travelers.
- 16.4 bookings per listing is a manageable pace that balances revenue with operational overhead.
- Stay lengths peak in Jul (9.7 nights) and shorten in Jun (5 nights). Adjust minimum-night requirements seasonally to match.
Recommendations for Hosts
- Leverage the longer-stay pattern by offering weekly discounts — even 5-10% off can convert browsing into bookings for guests considering an extended stay.
- Set your check-in time to match or beat the market standard of 3:00 PM. Offering early check-in flexibility can be a low-cost differentiator.
- Monitor length-of-stay seasonality to adjust minimum-night requirements — longer minimums during peak periods maximize revenue while shorter minimums fill gaps in shoulder seasons.
Los Angeles Airbnb Minimum Stay Requirements Analysis
Distribution of Listings by Minimum Night Requirement
1 Night
972 listings
9.8% of total
2 Nights
958 listings
9.7% of total
3 Nights
289 listings
2.9% of total
4-6 Nights
477 listings
4.8% of total
7-29 Nights
959 listings
9.7% of total
30+ Nights
6263 listings
63.1% of total
Key Insights
- The most prevalent minimum stay requirement in Los Angeles is 30+ Nights, adopted by 63.1% of listings. This highlights the market's preference for longer commitments.
- Very short stays (1-2 nights) are less common (19.5%), suggesting hosts prefer slightly longer bookings to optimize turnover.
- A significant segment (63.1%) caters to monthly stays (30+ nights) in Los Angeles, pointing to opportunities in the extended-stay market.
Recommendations
- Align with the market by considering a 30+ Nights minimum stay, as 63.1% of Los Angeles hosts use this setting.
- If feasible, allowing 1-night stays, especially midweek or during low season, could capture last-minute bookings, as only 9.8% currently do.
- Explore offering discounts for stays of 30+ nights to attract the 63.1% of the market seeking extended stays.
- Adjust minimum nights based on seasonality – potentially shorter during low season and longer during peak demand periods in Los Angeles.
Los Angeles Airbnb Cancellation Policy Trends Analysis (2026)
Super Strict 30 Days
96 listings
1% of total
Limited
375 listings
3.8% of total
Super Strict 60 Days
69 listings
0.7% of total
Flexible
2078 listings
21% of total
Moderate
2035 listings
20.5% of total
Firm
3797 listings
38.3% of total
Strict
1465 listings
14.8% of total
Cancellation Policy Insights for Los Angeles
- The prevailing Airbnb cancellation policy trend in Los Angeles is Firm, used by 38.3% of listings.
- A majority (53.1%) of hosts in Los Angeles utilize Firm or Strict policies, indicating a market where hosts prioritize booking security.
Recommendations for Hosts
- Consider adopting a Firm policy to align with the 38.3% market standard in Los Angeles.
- Using a Strict policy might deter some guests, as only 14.8% of listings use it. Evaluate if potential revenue protection outweighs possible lower booking rates.
- Regularly review your cancellation policy against competitors and market demand shifts in Los Angeles.
How Much Are Airbnb Cleaning Fees in Los Angeles?
Cleaning fees in Los Angeles are meaningful operating levers, not just pass-through charges. What matters most is how often hosts charge them, how high they run relative to market norms, and how large a share of gross revenue they consume.
Cleaning Fee Insights for Los Angeles
- 88.4% of listings charge a cleaning fee, making it standard practice in Los Angeles. Guests expect it and factor it into their booking decisions.
- The gap between the average ($2,331) and median ($400) cleaning fee indicates some high-end properties are pulling the average up considerably.
- Cleaning fees represent 5.6% of gross revenue on average — a modest component of the overall booking price.
Recommendations for Hosts
- Price your cleaning fee competitively against the Los Angeles median of $400. Fees significantly above market norms can deter bookings, especially for shorter stays.
- Monitor competitor cleaning fees regularly. Airbnb's search algorithm factors in total price, so a well-calibrated cleaning fee can improve your listing's ranking.
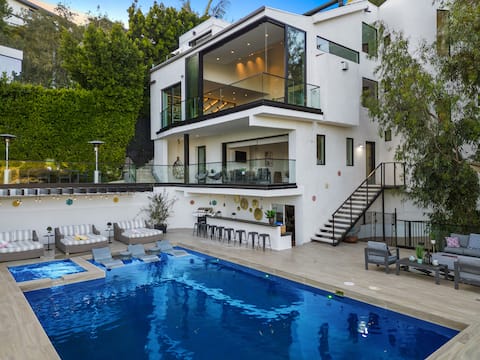
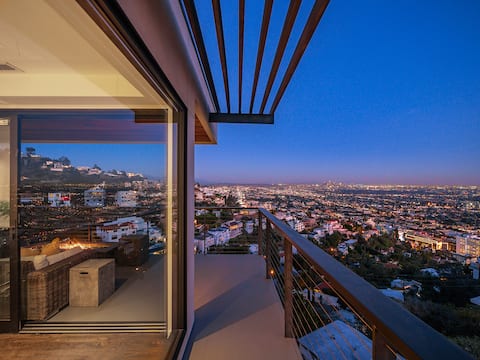
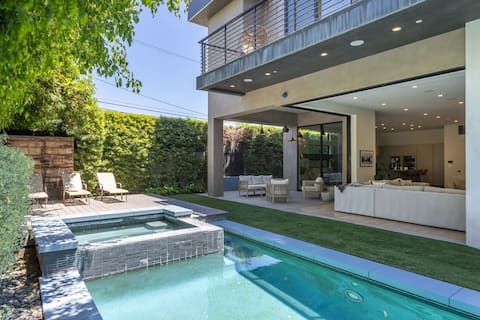
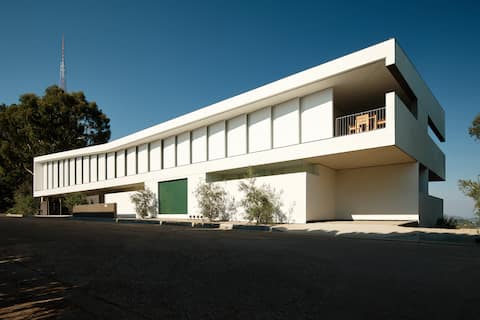
What Do the Top Airbnb Listings in Los Angeles Look Like?
Benchmark your potential! Explore examples of top-performing Airbnb properties in Los Angelesbased on Trailing Twelve Month (TTM) revenue. Analyze their characteristics, revenue, occupancy rate, and ADR to understand what drives success in this market.

Exquisite Private Oasis in Beverly Hills
Entire Place • 5 bedrooms
Scenic Hollywood Hills Oasis with Stunning Vistas
Entire Place • 4 bedrooms

Bel Air Luxury Villa View & Pool Los Angeles
Entire Place • 6 bedrooms
LUXE - Skyline Views & Heated Infinity Pool!
Entire Place • 3 bedrooms
Casa Bella by Oraklus
Entire Place • 5 bedrooms
Eterne by Stay Awhile Villas
Entire Place • 4 bedrooms
Note: Performance varies based on location, size, amenities, seasonality, and management quality. Data reflects the past 12 months.
Who Are the Top Airbnb Hosts in Los Angeles?
Learn from the best! This table showcases top-performing Airbnb hosts in Los Angeles based on the number of properties managed and estimated total revenue over the past year. Analyze their scale and performance metrics.
| Host Name | Properties | Grossing Revenue | Stay Reviews | Avg Rating |
|---|---|---|---|---|
| The Maimon Group | 50 | $5,599,670 | 614 | 4.80/5.0 |
| Stay Awhile | 21 | $4,705,832 | 788 | 4.92/5.0 |
| Greg And Maylen | 22 | $2,998,272 | 1439 | 4.87/5.0 |
| Shawn | 21 | $2,888,429 | 3190 | 4.92/5.0 |
| Oraklus Rental Properties | 12 | $2,638,725 | 292 | 4.91/5.0 |
| AvantStay Los Angeles | 30 | $2,138,623 | 533 | 4.74/5.0 |
| Mk | 22 | $1,890,066 | 799 | 4.91/5.0 |
| Chinar | 46 | $1,856,086 | 2084 | 4.55/5.0 |
| Kye | 31 | $1,670,123 | 1546 | 4.91/5.0 |
| Open Air | 15 | $1,436,891 | 380 | 4.86/5.0 |
Analyzing the strategies of top hosts, such as their property selection, pricing, and guest communication, can offer valuable lessons for optimizing your own Airbnb operations in Los Angeles.
Who Are the Airbnb Hosts in Los Angeles?
Los Angeles is a quality-focused market, with a high Superhost share and fairly mature operating standards.
Host Profile Insights for Los Angeles
- With 55.6% Superhosts, Los Angeles has an experienced host base that sets high guest expectations. New entrants should plan for competitive quality standards.
- 5.6% of listings are professionally managed, reflecting a market still dominated by individual hosts.
- 12.0% of listings have Instant Book enabled. Lower Instant Book adoption means many guests must request approval, which can slow conversions.
- 53.5% of listings use Airbnb's simplified pricing (host-only fee), where the host pays the entire platform service fee and the guest sees one all-in price with no separate Airbnb service charge. High adoption signals a professional, PMS-connected host base — Airbnb mandates simplified pricing for software-connected listings.
Recommendations for Hosts
- Consider enabling Instant Book — it reduces booking friction and Airbnb's algorithm tends to favor Instant Book listings in search results.
- With 34.9% cohosted listings, there may be a growing local market for property management services.
- Benchmark your host metrics against these Los Angeles averages regularly and adjust your hosting strategy based on what top performers do differently.
Top Professional Management Companies in Los Angeles
These are the highest-grossing professional property management operations in Los Angeles, ranked by total revenue across their portfolio. Their performance metrics offer a benchmark for what institutional-level hosting looks like in this market.
| Company | Listings | Revenue | ADR | Occ. | Rating |
|---|---|---|---|---|---|
| The Maimon Group | 50 | $5,599,670 | $1,755 | 28.7% | 4.80/5 |
| Stay Awhile | 21 | $4,705,832 | $1,886 | 38.7% | 4.92/5 |
| Shawn | 21 | $2,888,429 | $640 | 59.2% | 4.92/5 |
| Oraklus Rental Properties | 12 | $2,638,725 | $1,236 | 60.1% | 4.91/5 |
| AvantStay Los Angeles | 30 | $2,138,623 | $710 | 45.5% | 4.74/5 |
| Mk | 22 | $1,890,066 | $566 | 45.9% | 4.91/5 |
| Open Air | 15 | $1,436,891 | $685 | 51.8% | 4.86/5 |
| Lilly | 20 | $1,396,339 | $402 | 51.7% | 4.72/5 |
| Evan | 9 | $1,271,320 | $843 | 56.0% | 4.97/5 |
| Britney And Joseph | 23 | $1,249,355 | $520 | 45.8% | 4.90/5 |
Management Company Insights for Los Angeles
- The leading management company, The Maimon Group, operates 50 listings with $5,599,670 in gross revenue — a useful benchmark for what scale looks like in Los Angeles.
- Top managers average 22 properties each, pointing to a market where portfolio scale is a meaningful competitive factor.
- Professionally managed listings in the top tier average 4.87/5 in guest ratings — demonstrating that scale and quality can coexist.
Recommendations
- With only 5.6% of listings professionally managed, there may be an opportunity to differentiate through more structured operations and consistent guest experiences.
- Study how top management companies price, position, and maintain their portfolios — their ADR and occupancy rates reflect strategies refined across dozens of listings.
- If you're considering hiring a property manager, compare their portfolio performance against these benchmarks before committing.
How Does Los Angeles's Airbnb Market Compare to Nearby Cities?
How does the Los Angeles Airbnb market stack up against its neighbors? Compare key performance metrics like average monthly revenue, ADR, and occupancy rates in surrounding areas to understand the broader regional STR landscape.
Compared with La Palma, Los Angeles has 13 percentage points lower occupancy and about $92 lower ADR. That helps frame whether this market is winning more on demand, pricing, or both.
| Market | Active Properties | Monthly Revenue | Daily Rate | Avg. Occupancy |
|---|---|---|---|---|
| Montecito | 139 | $9,439 | $973.83 | 46% |
| Malibu | 269 | $9,218 | $1269.23 | 36% |
| Newport Beach | 1,300 | $8,158 | $778.54 | 44% |
| La Palma | 12 | $7,812 | $396.72 | 55% |
| Manhattan Beach | 288 | $6,939 | $621.98 | 46% |
| Avalon | 250 | $6,420 | $721.31 | 35% |
| Summerland | 88 | $6,295 | $520.05 | 47% |
| Unincorporated Santa Monica Mountains | 103 | $6,187 | $669.77 | 41% |
| Toro Canyon | 30 | $6,159 | $784.86 | 39% |
| Encinitas | 550 | $5,262 | $570.17 | 46% |
Frequently Asked Questions About Airbnb in Los Angeles
These quick answers summarize the most common investor and operator questions using AirROI's latest market data for Los Angeles.
How much do Airbnb hosts make in Los Angeles?
Los Angeles hosts earn about $31,130 per year on average, with an average nightly rate of $304 and RevPAR of $126. Those figures describe the typical revenue environment for active listings in Los Angeles, California, not the ceiling for the best operators. Source: AirROI 2026 data, Los Angeles market, August 2025 to July 2026.
What is the average Airbnb occupancy rate in Los Angeles?
The average Airbnb occupancy rate in Los Angeles is 41.5%. June is the strongest month and January is the softest, so hosts should expect demand to move meaningfully throughout the year rather than stay flat.
What is the average Airbnb daily rate in Los Angeles?
Listings in Los Angeles average $304 per night. The broader pricing spread also matters: lower-performing listings cluster closer to the lower quartiles, while premium homes can price materially above the city average when demand spikes or listing quality stands out.
How many Airbnb listings are active in Los Angeles?
Los Angeles currently has about 9,919 active Airbnb listings in AirROI's market dataset. That supply count helps explain how competitive the market is, how much depth there is for benchmarking, and whether the market behaves like a niche destination or a scaled urban market.
How strict are short-term rental regulations in Los Angeles?
AirROI currently classifies the short-term rental regulation level in Los Angeles as High. The dataset also shows about 55.2% of listings with registration evidence. That is a market signal, not legal advice, so hosts should still confirm current licensing and compliance rules locally before listing.
What is the RevPAR for Airbnb in Los Angeles?
RevPAR in Los Angeles is about $126. That metric combines pricing and occupancy into one efficiency number, so it is often a better quick benchmark than ADR alone when investors want to compare how well listings convert nightly rates into realized revenue.
Is Airbnb profitable in Los Angeles?
At 41.5% occupancy, Los Angeles can be profitable — but margins depend heavily on operating costs, property acquisition price, and how well hosts optimize pricing across seasons. Average annual revenue is $31,130, but individual returns depend on property type, location within the city, and the host's operating efficiency.
How far in advance do guests book Airbnb in Los Angeles?
The average booking lead time in Los Angeles is about 36 days — a moderate lead time that gives hosts planning visibility while still benefiting from last-minute bookings. Hosts who understand their market's booking cadence can adjust minimum stays and pricing windows accordingly.
What are the best neighborhoods for Airbnb in Los Angeles?
Based on AirROI's analysis, some of the top neighborhoods for short-term rentals in Los Angeles include Hollywood, Santa Monica, Venice Beach. Each area attracts different guest profiles — from business travelers to leisure visitors — so the best location depends on the property type and target audience a host is aiming for. See the full neighborhood breakdown above.
What type of property performs best on Airbnb in Los Angeles?
entire_home listings make up 82.0% of the active supply in Los Angeles. The most common configuration does not always mean the most profitable — operators who identify underserved property types or bedroom counts can sometimes outperform the market average by filling a gap in local supply.
How does Los Angeles compare to nearby Airbnb markets?
Among neighboring markets, Montecito posts $113,266 in average annual revenue with 45.9% occupancy, compared to Los Angeles's $31,130 and 41.5%. Comparing nearby markets helps investors understand whether a destination's performance reflects local demand or broader regional trends.
What is the average length of stay in Los Angeles?
The average Airbnb stay length in Los Angeles is about 10.7 nights. That matters for turnover, cleaning operations, and pricing strategy because shorter stays increase changeovers while longer stays can smooth occupancy and reduce operational friction.
What is the average Airbnb guest rating in Los Angeles?
Airbnb listings in Los Angeles average 4.82 out of 5 overall. About 35.2% of listings carry the guest favorite badge, which suggests a meaningful share of inventory is competing on review quality rather than price alone.
Which amenities boost Airbnb revenue in Los Angeles?
Kitchen and Dishes and silverware are among the strongest revenue-linked amenities in Los Angeles. In AirROI's latest dataset, listings with these amenities outperform those without on average revenue, which makes amenities analysis useful for prioritizing investment and listing upgrades.
Do Airbnb hosts charge cleaning fees in Los Angeles?
Yes. About 88.4% of active Airbnb listings in Los Angeles charge a cleaning fee, and the average fee is $2,331. The more important operating benchmark is how much of gross revenue that fee consumes, not just the absolute dollar amount.
What percentage of Airbnb hosts are Superhosts in Los Angeles?
A 55.6% Superhost rate signals a highly competitive market where review quality and responsiveness are table stakes, not differentiators.
About AirROI Market Data
AirROI tracks over 20 million properties across 190+ countries and maintains 15+ years of historical performance data, making it one of the deepest Airbnb and STR intelligence platforms available. The analytics pipeline aggregates listing-level data monthly — revenue, occupancy, nightly rates, RevPAR, guest demographics, booking patterns, and competitive supply — so investors and operators can benchmark any market against its own history and against neighboring destinations.
Real estate investors, property managers, financial institutions, hedge funds, tourism boards, hospitality consultants, tech platforms, and academic researchers rely on AirROI data to underwrite acquisitions, optimize pricing, model macro trends, and conduct peer-reviewed research. Data is available through in-depth market reports like this one and the Airbnb API with 22 endpoints and an Airbnb MCP Server for AI agents.
AirROI proprietary analytics as of 2026-07-31. Metrics reflect trailing twelve-month aggregates from active listings. Revenue figures are market averages, not projections. Neighborhood descriptions are AI-generated and reviewed for accuracy. For full methodology, see the data methodology page.