Marin City Airbnb Market Analysis 2026: Short Term Rental Data & Vacation Rental Statistics in California, United States
Is Airbnb profitable in Marin City in 2026? Explore comprehensive Airbnb analytics for Marin City, California, United States to uncover income potential. This 2026 STR market report for Marin City, based on AirROI data from February 2025 to January 2026, reveals key trends in the niche market of 19 active listings.
Whether you're considering an Airbnb investment in Marin City, optimizing your existing vacation rental, or exploring rental arbitrage opportunities, understanding the Marin City Airbnb data is crucial. Leveraging the low regulation environment is key to maximizing your short term rental income potential. Let's dive into the specifics.
Key Marin City Airbnb Performance Metrics Overview
Monthly Airbnb Revenue Variations & Income Potential in Marin City (2026)
Understanding the monthly revenue variations for Airbnb listings in Marin City is key to maximizing your short term rental income potential. Seasonality significantly impacts earnings. Our analysis, based on data from the past 12 months, shows that the peak revenue month for STRs in Marin City is typically August, while December often presents the lowest earnings, highlighting opportunities for strategic pricing adjustments during shoulder and low seasons. Explore the typical Airbnb income in Marin City across different performance tiers:
- Best-in-class properties (Top 10%) achieve $9,808+ monthly, often utilizing dynamic pricing and superior guest experiences.
- Strong performing properties (Top 25%) earn $7,164 or more, indicating effective management and desirable locations/amenities.
- Typical properties (Median) generate around $4,346 per month, representing the average market performance.
- Entry-level properties (Bottom 25%) see earnings around $2,816, often with potential for optimization.
Average Monthly Airbnb Earnings Trend in Marin City
Marin City Airbnb Occupancy Rate Trends (2026)
Maximize your bookings by understanding the Marin City STR occupancy trends. Seasonal demand shifts significantly influence how often properties are booked. Typically, Julysees the highest demand (peak season occupancy), while December experiences the lowest (low season). Effective strategies, like adjusting minimum stays or offering promotions, can boost occupancy during slower periods. Here's how different property tiers perform in Marin City:
- Best-in-class properties (Top 10%) achieve 85%+ occupancy, indicating high desirability and potentially optimized availability.
- Strong performing properties (Top 25%) maintain 76% or higher occupancy, suggesting good market fit and guest satisfaction.
- Typical properties (Median) have an occupancy rate around 60%.
- Entry-level properties (Bottom 25%) average 37% occupancy, potentially facing higher vacancy.
Average Monthly Occupancy Rate Trend in Marin City
Average Daily Rate (ADR) Airbnb Trends in Marin City (2026)
Effective short term rental pricing strategy in Marin City involves understanding monthly ADR fluctuations. The Average Daily Rate (ADR) for Airbnb in Marin City typically peaks in May and dips lowest during January. Leveraging Airbnb dynamic pricing tools or strategies based on this seasonality can significantly boost revenue. Here's a look at the typical nightly rates achieved:
- Best-in-class properties (Top 10%) command rates of $442+ per night, often due to premium features or locations.
- Strong performing properties (Top 25%) achieve nightly rates of $328 or more.
- Typical properties (Median) charge around $219 per night.
- Entry-level properties (Bottom 25%) earn around $174 per night.
Average Daily Rate (ADR) Trend by Month in Marin City
Get Live Marin City Market Intelligence 👇

Explore Real-time Analytics
Airbnb Seasonality Analysis & Trends in Marin City (2026)
Peak Season (August, May, July)
- Revenue averages $6,802 per month
- Occupancy rates average 68.8%
- Daily rates average $272
Shoulder Season
- Revenue averages $5,649 per month
- Occupancy maintains around 58.4%
- Daily rates hold near $269
Low Season (January, February, December)
- Revenue drops to average $3,758 per month
- Occupancy decreases to average 47.6%
- Daily rates adjust to average $256
Seasonality Insights for Marin City
- The Airbnb seasonality in Marin City shows moderate seasonality with distinct peak and low periods. While the sections above show seasonal averages, it's also insightful to look at the extremes:
- During the high season, the absolute peak month showcases Marin City's highest earning potential, with monthly revenues capable of climbing to $6,893, occupancy reaching a high of 72.4%, and ADRs peaking at $278.
- Conversely, the slowest single month of the year, typically falling within the low season, marks the market's lowest point. In this month, revenue might dip to $3,538, occupancy could drop to 46.1%, and ADRs may adjust down to $255.
- Understanding both the seasonal averages and these monthly peaks and troughs in revenue, occupancy, and ADR is crucial for maximizing your Airbnb profit potential in Marin City.
Seasonal Strategies for Maximizing Profit
- Peak Season: Maximize revenue through premium pricing and potentially longer minimum stays. Ensure high availability.
- Low Season: Offer competitive pricing, special promotions (e.g., extended stay discounts), and flexible cancellation policies. Target off-season travelers like remote workers or budget-conscious guests.
- Shoulder Seasons: Implement dynamic pricing that balances peak and low rates. Target weekend travelers or specific events. Offer slightly more flexible terms than peak season.
- Regularly analyze your own performance against these Marin City seasonality benchmarks and adjust your pricing and availability strategy accordingly.
Best Areas for Airbnb Investment in Marin City (2026)
Exploring the top neighborhoods for short-term rentals in Marin City? This section highlights key areas, outlining why they are attractive for hosts and guests, along with notable local attractions. Consider these locations based on your target guest profile and investment strategy.
| Neighborhood / Area | Why Host Here? (Target Guests & Appeal) | Key Attractions & Landmarks |
|---|---|---|
| Marin Headlands | A stunning coastal area, perfect for hikers and nature lovers. Offers breathtaking views of the Golden Gate Bridge and the Pacific Ocean, making it an exceptional spot for tourists seeking outdoor experiences. | Golden Gate Bridge, Point Bonita Lighthouse, Marine Mammal Center, Rodeo Beach, Marin Headlands Trails |
| Sausalito | A charming waterfront town known for its picturesque views, art galleries, and restaurants. Popular with tourists looking for a laid-back, scenic vacation. | Sausalito Ferry Terminal, Battery Spencer, Marin County Civic Center, Bay Area Discovery Museum, Sausalito Boardwalk |
| Mill Valley | A cozy town nestled in the redwoods, ideal for outdoor enthusiasts and those seeking a peaceful retreat. Great base for exploring Mount Tamalpais and surrounding parks. | Muir Woods National Monument, Mount Tamalpais State Park, Viola Fields, Mill Valley-Sausalito Pathway, Throckmorton Theatre |
| Tiburon | A picturesque town with views of San Francisco across the bay. Popular for water activities and upscale dining, attracting visitors looking for a luxurious stay. | Angel Island State Park, Tiburon ferry to San Francisco, Marin Country Mart, Ark Row, Old St. Hilary's Church |
| Fairfax | Known for its small-town vibe and access to nature trails. It attracts visitors looking for hiking opportunities and a sense of community. | Fairfax Forest EcoPark, Pioneer Park, Mount Tamalpais hiking trails, Redwood High School's environmental projects, Farmers Market |
| Novato | A suburban gem with a family-friendly atmosphere and proximity to outdoor activities. Offers a quieter experience compared to other Marin County towns. | Novato History Museum, Marin Museum of Contemporary Art, Hamilton Field History Museum, Indian Valley Golf Club, Mount Burdell |
| Corte Madera | Strategically located near shopping and dining, offering convenience to tourists and easy access to both Marin and San Francisco. | Town Center at Corte Madera, Marin Country Mart, Corte Madera Creek, Corte Madera Town Park, Old Corte Madera Square |
| Point Reyes Station | A charming small town known for its proximity to Point Reyes National Seashore, popular with nature lovers and wildlife enthusiasts. | Point Reyes National Seashore, Tomales Bay, Point Reyes Lighthouse, Bear Valley Trail, Cowgirl Creamery |
Understanding Airbnb License Requirements & STR Laws in Marin City (2026)
While Marin City, California, United States currently shows low STR regulations, specific Airbnb license requirements might still exist or change. Always verify the latest short term rental regulations and Airbnb license requirements directly with local government authorities for Marin City to ensure full compliance before hosting.
(Source: AirROI data, 2026, finding no licensed listings among those analyzed)
Top Performing Airbnb Properties in Marin City (2026)
Benchmark your potential! Explore examples of top-performing Airbnb properties in Marin Citybased on Trailing Twelve Month (TTM) revenue. Analyze their characteristics, revenue, occupancy rate, and ADR to understand what drives success in this market.
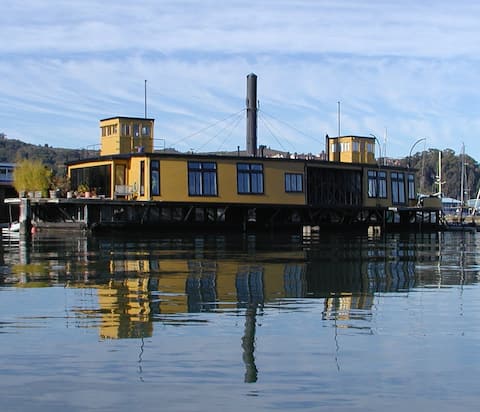
Historic Ferryboat In Sausalito
Entire Place • 3 bedrooms

Floating condo 'D' on Sausalito's Richardson Bay
Entire Place • 1 bedroom

R&R - GG Bridge/Mt Tam mins away
Entire Place • 2 bedrooms

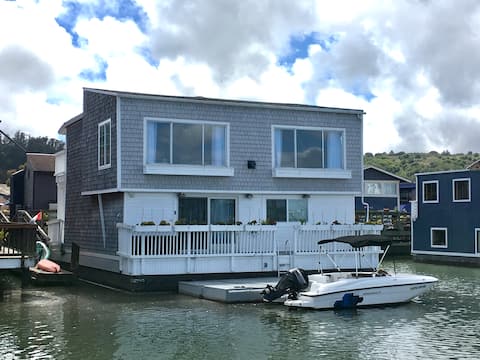
Floating Guest Cottage (houseboat)
Entire Place • 2 bedrooms

Ahoy, Seekers of Serenity!
Entire Place • 2 bedrooms
Modern and Spacious 2 Bedroom Houseboat Living
Entire Place • 2 bedrooms
Note: Performance varies based on location, size, amenities, seasonality, and management quality. Data reflects the past 12 months.
Top Performing Airbnb Hosts in Marin City (2026)
Learn from the best! This table showcases top-performing Airbnb hosts in Marin City based on the number of properties managed and estimated total revenue over the past year. Analyze their scale and performance metrics.
| Host Name | Properties | Grossing Revenue | Stay Reviews | Avg Rating |
|---|---|---|---|---|
| Chris | 1 | $165,344 | 273 | 4.93/5.0 |
| Annie | 3 | $136,974 | 429 | 4.70/5.0 |
| Harold | 1 | $108,209 | 268 | 4.92/5.0 |
| Raphael | 1 | $87,880 | 65 | 4.98/5.0 |
| Lois | 1 | $84,083 | 516 | 4.98/5.0 |
| Katy | 1 | $83,183 | 18 | 4.94/5.0 |
| Wesley | 2 | $76,819 | 126 | 4.94/5.0 |
| Katherine | 1 | $68,193 | 12 | 5.00/5.0 |
| Johnny | 1 | $39,835 | 387 | 4.97/5.0 |
| John | 1 | $30,812 | 4 | 5.00/5.0 |
Analyzing the strategies of top hosts, such as their property selection, pricing, and guest communication, can offer valuable lessons for optimizing your own Airbnb operations in Marin City.
Dive Deeper: Advanced Marin City STR Market Data (2026)
Ready to unlock more insights? AirROI provides access to advanced metrics and comprehensive Airbnb data for Marin City. Explore detailed analytics beyond this report to refine your investment strategy, optimize pricing, and maximize your vacation rental profits.
Explore Advanced MetricsMarin City Short-Term Rental Market Composition (2026): Property & Room Types
Room Type Distribution
Property Type Distribution
Market Composition Insights for Marin City
- The Marin City Airbnb market composition is heavily skewed towards Entire Home/Apt listings, which make up 94.7% of the 19 active rentals. This indicates strong guest preference for privacy and space.
- Looking at the property type distribution in Marin City, House properties are the most common (36.8%), reflecting the local real estate landscape.
- Houses represent a significant 36.8% portion, catering likely to families or larger groups.
- The presence of 5.3% Hotel/Boutique listings indicates integration with traditional hospitality.
Marin City Airbnb Room Capacity Analysis (2026): Bedroom Distribution
Distribution of Listings by Number of Bedrooms
Room Capacity Insights for Marin City
- The dominant room capacity in Marin City is 1 bedroom listings, making up 31.6% of the market. This suggests a strong demand for properties suitable for couples or solo travelers.
- Together, 1 bedroom and 2 bedrooms properties represent 57.9% of the active Airbnb listings in Marin City, indicating a high concentration in these sizes.
- A significant 21.1% of listings offer 3+ bedrooms, catering to larger groups and families seeking more space in Marin City.
Marin City Vacation Rental Guest Capacity Trends (2026)
Distribution of Listings by Guest Capacity
Guest Capacity Insights for Marin City
- The most common guest capacity trend in Marin City vacation rentals is listings accommodating 2 guests (42.1%). This suggests the primary traveler segment is likely couples or solo travelers.
- Properties designed for 2 guests and 4 guests dominate the Marin City STR market, accounting for 63.2% of listings.
- A significant 42.1% of listings cater specifically to 1-2 guests, highlighting strong demand from couples and solo travelers in Marin City.
- 21.1% of properties accommodate 6+ guests, serving the market segment for larger families or group travel in Marin City.
- On average, properties in Marin City are equipped to host 3.5 guests.
Marin City Airbnb Booking Patterns (2026): Available vs. Booked Days
Available Days Distribution
Booked Days Distribution
Booking Pattern Insights for Marin City
- The most common availability pattern in Marin City falls within the 271-366 days range, representing 31.6% of listings. This suggests many properties have significant open periods on their calendars.
- Approximately 52.7% of listings show high availability (181+ days open annually), indicating potential for increased bookings or specific owner usage patterns.
- For booked days, the 181-270 days range is most frequent in Marin City (31.6%), reflecting common guest stay durations or potential owner blocking patterns.
- A notable 47.4% of properties secure long booking periods (181+ days booked per year), highlighting successful long-term rental strategies or significant owner usage.
Marin City Airbnb Minimum Stay Requirements Analysis
Distribution of Listings by Minimum Night Requirement
1 Night
2 listings
10.5% of total
2 Nights
3 listings
15.8% of total
3 Nights
2 listings
10.5% of total
4-6 Nights
2 listings
10.5% of total
7-29 Nights
2 listings
10.5% of total
30+ Nights
8 listings
42.1% of total
Key Insights
- The most prevalent minimum stay requirement in Marin City is 30+ Nights, adopted by 42.1% of listings. This highlights the market's preference for longer commitments.
- A significant segment (42.1%) caters to monthly stays (30+ nights) in Marin City, pointing to opportunities in the extended-stay market.
Recommendations
- Align with the market by considering a 30+ Nights minimum stay, as 42.1% of Marin City hosts use this setting.
- If feasible, allowing 1-night stays, especially midweek or during low season, could capture last-minute bookings, as only 10.5% currently do.
- Explore offering discounts for stays of 30+ nights to attract the 42.1% of the market seeking extended stays.
- Adjust minimum nights based on seasonality – potentially shorter during low season and longer during peak demand periods in Marin City.
Marin City Airbnb Cancellation Policy Trends Analysis (2026)
Super Strict 30 Days
1 listings
5.3% of total
Flexible
2 listings
10.5% of total
Moderate
8 listings
42.1% of total
Firm
7 listings
36.8% of total
Strict
1 listings
5.3% of total
Cancellation Policy Insights for Marin City
- The prevailing Airbnb cancellation policy trend in Marin City is Moderate, used by 42.1% of listings.
- There's a relatively balanced mix between guest-friendly (52.6%) and stricter (42.1%) policies, offering choices for different guest needs.
- Strict cancellation policies are quite rare (5.3%), potentially making listings with this policy less competitive unless justified by high demand or property type.
Recommendations for Hosts
- Consider adopting a Moderate policy to align with the 42.1% market standard in Marin City.
- Using a Strict policy might deter some guests, as only 5.3% of listings use it. Evaluate if potential revenue protection outweighs possible lower booking rates.
- Regularly review your cancellation policy against competitors and market demand shifts in Marin City.
Marin City STR Booking Lead Time Analysis (2026)
Average Booking Lead Time by Month
Booking Lead Time Insights for Marin City
- The overall average booking lead time for vacation rentals in Marin City is 54 days.
- Guests book furthest in advance for stays during March (average 73 days), likely coinciding with peak travel demand or local events.
- The shortest booking windows occur for stays in January (average 46 days), indicating more last-minute travel plans during this time.
- Seasonally, Spring (65 days avg.) sees the longest lead times, while Winter (51 days avg.) has the shortest, reflecting typical travel planning cycles.
Recommendations for Hosts
- Use the overall average lead time (54 days) as a baseline for your pricing and availability strategy in Marin City.
- For March stays, consider implementing length-of-stay discounts or slightly higher rates for bookings made less than 73 days out to capitalize on advance planning.
- Target marketing efforts for the Spring season well in advance (at least 65 days) to capture early planners.
- Monitor your own booking lead times against these Marin City averages to identify opportunities for dynamic pricing adjustments.
Popular & Essential Airbnb Amenities in Marin City (2026)
Amenity Prevalence
Amenity Insights for Marin City
- Essential amenities in Marin City that guests expect include: Smoke alarm, Fire extinguisher, Wifi, Heating, Hot water. Lacking these (any) could significantly impact bookings.
- Popular amenities like Essentials, Carbon monoxide alarm, Microwave are common but not universal. Offering these can provide a competitive edge.
Recommendations for Hosts
- Ensure your listing includes all essential amenities for Marin City: Smoke alarm, Fire extinguisher, Wifi, Heating, Hot water.
- Consider adding popular differentiators like Essentials or Carbon monoxide alarm to increase appeal.
- Highlight unique or less common amenities you offer (e.g., hot tub, dedicated workspace, EV charger) in your listing description and photos.
- Regularly check competitor amenities in Marin City to stay competitive.
Marin City Airbnb Guest Demographics & Profile Analysis (2026)
Guest Profile Summary for Marin City
- The typical guest profile for Airbnb in Marin City consists of primarily domestic travelers (88%), often arriving from nearby San Francisco, typically belonging to the Post-2000s (Gen Z/Alpha) group (50%), primarily speaking English or Spanish.
- Domestic travelers account for 88.0% of guests.
- Key international markets include United States (88%) and United Kingdom (2.6%).
- Top languages spoken are English (62.2%) followed by Spanish (15.3%).
- A significant demographic segment is the Post-2000s (Gen Z/Alpha) group, representing 50% of guests.
Recommendations for Hosts
- Target domestic marketing efforts towards travelers from San Francisco and Los Angeles.
- Tailor amenities and listing descriptions to appeal to the dominant Post-2000s (Gen Z/Alpha) demographic (e.g., highlight fast WiFi, smart home features, local guides).
- Highlight unique local experiences or amenities relevant to the primary guest profile.
- Consider seasonal promotions aligned with peak travel times for key origin markets.
Nearby Short-Term Rental Market Comparison
How does the Marin City Airbnb market stack up against its neighbors? Compare key performance metrics like average monthly revenue, ADR, and occupancy rates in surrounding areas to understand the broader regional STR landscape.
| Market | Active Properties | Monthly Revenue | Daily Rate | Avg. Occupancy |
|---|---|---|---|---|
| Carmel Point | 15 | $14,483 | $1046.17 | 54% |
| Del Monte Forest | 105 | $10,280 | $964.89 | 47% |
| Moss Beach | 34 | $10,092 | $676.91 | 53% |
| Sonoma | 228 | $9,647 | $819.87 | 43% |
| Marshall | 18 | $8,897 | $607.75 | 50% |
| St. Helena | 50 | $8,684 | $924.70 | 38% |
| Carmel-by-the-Sea | 305 | $8,657 | $680.02 | 49% |
| Kenwood | 60 | $8,643 | $810.83 | 41% |
| Glen Ellen | 85 | $8,482 | $799.53 | 43% |
| Eldridge | 21 | $8,410 | $930.61 | 41% |