Midpines Airbnb Market Analysis 2026: Short Term Rental Data & Vacation Rental Statistics in California, United States
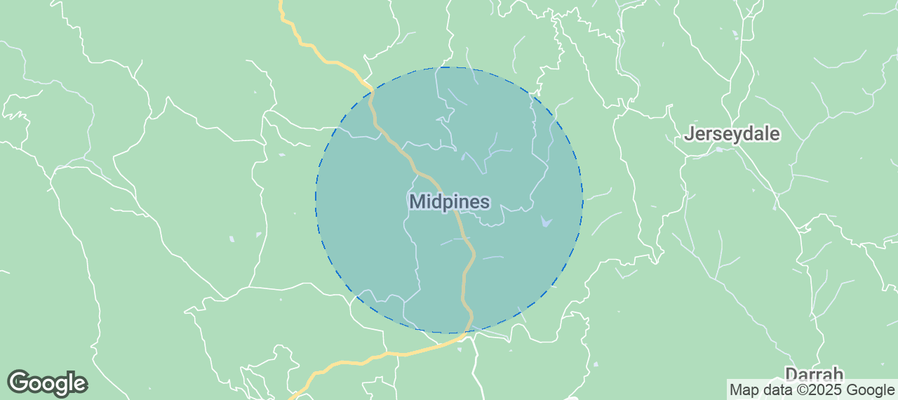
Is Airbnb profitable in Midpines in 2026? Explore comprehensive Airbnb analytics for Midpines, California, United States to uncover income potential. This 2026 STR market report for Midpines, based on AirROI data from February 2025 to January 2026, reveals key trends in the niche market of 49 active listings.
Whether you're considering an Airbnb investment in Midpines, optimizing your existing vacation rental, or exploring rental arbitrage opportunities, understanding the Midpines Airbnb data is crucial. Leveraging the low regulation environment is key to maximizing your short term rental income potential. Let's dive into the specifics.
Key Midpines Airbnb Performance Metrics Overview
Monthly Airbnb Revenue Variations & Income Potential in Midpines (2026)
Understanding the monthly revenue variations for Airbnb listings in Midpines is key to maximizing your short term rental income potential. Seasonality significantly impacts earnings. Our analysis, based on data from the past 12 months, shows that the peak revenue month for STRs in Midpines is typically June, while February often presents the lowest earnings, highlighting opportunities for strategic pricing adjustments during shoulder and low seasons. Explore the typical Airbnb income in Midpines across different performance tiers:
- Best-in-class properties (Top 10%) achieve $6,616+ monthly, often utilizing dynamic pricing and superior guest experiences.
- Strong performing properties (Top 25%) earn $4,789 or more, indicating effective management and desirable locations/amenities.
- Typical properties (Median) generate around $3,271 per month, representing the average market performance.
- Entry-level properties (Bottom 25%) see earnings around $1,952, often with potential for optimization.
Average Monthly Airbnb Earnings Trend in Midpines
Midpines Airbnb Occupancy Rate Trends (2026)
Maximize your bookings by understanding the Midpines STR occupancy trends. Seasonal demand shifts significantly influence how often properties are booked. Typically, Junesees the highest demand (peak season occupancy), while January experiences the lowest (low season). Effective strategies, like adjusting minimum stays or offering promotions, can boost occupancy during slower periods. Here's how different property tiers perform in Midpines:
- Best-in-class properties (Top 10%) achieve 64%+ occupancy, indicating high desirability and potentially optimized availability.
- Strong performing properties (Top 25%) maintain 52% or higher occupancy, suggesting good market fit and guest satisfaction.
- Typical properties (Median) have an occupancy rate around 35%.
- Entry-level properties (Bottom 25%) average 21% occupancy, potentially facing higher vacancy.
Average Monthly Occupancy Rate Trend in Midpines
Average Daily Rate (ADR) Airbnb Trends in Midpines (2026)
Effective short term rental pricing strategy in Midpines involves understanding monthly ADR fluctuations. The Average Daily Rate (ADR) for Airbnb in Midpines typically peaks in June and dips lowest during February. Leveraging Airbnb dynamic pricing tools or strategies based on this seasonality can significantly boost revenue. Here's a look at the typical nightly rates achieved:
- Best-in-class properties (Top 10%) command rates of $488+ per night, often due to premium features or locations.
- Strong performing properties (Top 25%) achieve nightly rates of $393 or more.
- Typical properties (Median) charge around $280 per night.
- Entry-level properties (Bottom 25%) earn around $228 per night.
Average Daily Rate (ADR) Trend by Month in Midpines
Get Live Midpines Market Intelligence 👇
Explore Real-time Analytics
Airbnb Seasonality Analysis & Trends in Midpines (2026)
Peak Season (June, July, May)
- Revenue averages $6,001 per month
- Occupancy rates average 55.7%
- Daily rates average $379
Shoulder Season
- Revenue averages $3,604 per month
- Occupancy maintains around 36.3%
- Daily rates hold near $338
Low Season (January, February, March)
- Revenue drops to average $1,764 per month
- Occupancy decreases to average 19.6%
- Daily rates adjust to average $319
Seasonality Insights for Midpines
- The Airbnb seasonality in Midpines shows highly seasonal trends requiring careful strategy. While the sections above show seasonal averages, it's also insightful to look at the extremes:
- During the high season, the absolute peak month showcases Midpines's highest earning potential, with monthly revenues capable of climbing to $6,765, occupancy reaching a high of 62.1%, and ADRs peaking at $392.
- Conversely, the slowest single month of the year, typically falling within the low season, marks the market's lowest point. In this month, revenue might dip to $1,499, occupancy could drop to 18.4%, and ADRs may adjust down to $306.
- Understanding both the seasonal averages and these monthly peaks and troughs in revenue, occupancy, and ADR is crucial for maximizing your Airbnb profit potential in Midpines.
Seasonal Strategies for Maximizing Profit
- Peak Season: Maximize revenue through premium pricing and potentially longer minimum stays. Ensure high availability.
- Low Season: Offer competitive pricing, special promotions (e.g., extended stay discounts), and flexible cancellation policies. Target off-season travelers like remote workers or budget-conscious guests.
- Shoulder Seasons: Implement dynamic pricing that balances peak and low rates. Target weekend travelers or specific events. Offer slightly more flexible terms than peak season.
- Regularly analyze your own performance against these Midpines seasonality benchmarks and adjust your pricing and availability strategy accordingly.
Best Areas for Airbnb Investment in Midpines (2026)
Exploring the top neighborhoods for short-term rentals in Midpines? This section highlights key areas, outlining why they are attractive for hosts and guests, along with notable local attractions. Consider these locations based on your target guest profile and investment strategy.
| Neighborhood / Area | Why Host Here? (Target Guests & Appeal) | Key Attractions & Landmarks |
|---|---|---|
| Yosemite National Park | World-renowned national park known for its stunning natural beauty, diverse wildlife, and outdoor recreational activities. Ideal for nature enthusiasts and tourists looking to explore Yosemite. | Yosemite Valley, El Capitan, Half Dome, Yosemite Falls, Glacier Point, Mariposa Grove of Giant Sequoias |
| Mariposa | Charming historic town that serves as a gateway to Yosemite National Park. Offers a quaint small-town atmosphere with plenty of shops and local attractions. | Mariposa Grove, California State Mining and Mineral Museum, Historic Courthouse, Butterfly Creek Winery, Mariposa Museum and History Center |
| Bass Lake | Picturesque lake destination offering a range of outdoor activities, including boating and fishing. Great for families and tourists seeking a lakeside retreat with proximity to the Sierra National Forest. | Bass Lake, Pine Slope Recreation Area, Bass Lake Roller Rink, Wishon Reservoir, Sierra National Forest |
| Oakhurst | Gateway to the southern entrance of Yosemite National Park, with a mix of outdoor activities, shopping, and dining options, making it popular among travelers. | Yosemite Mountain Sugar Pine Railroad, Visit Yosemite/Chowchilla River, Bass Lake, Oakhurst Community Center |
| Groveland | Charming town close to the Big Oak Flat entrance of Yosemite, known for its rustic charm and outdoor recreation options. | Groveland Yosemite Gateway Museum, Iron Door Saloon, Big Oak Flat Entrance to Yosemite National Park, Pine Mountain Lake |
| Fish Camp | Small community near the southern entrance to Yosemite, popular for its cozy cabins and proximity to Glacier Point and Mariposa Grove. | Yosemite Mountain Lodge, Historic Fish Camp, Glacier Point, Mariposa Grove, Tenaya Lodge |
| Pine Mountain Lake | A scenic community that features private lakes, golf courses, and access to nature trails. It's ideal for vacation rentals and outdoor enthusiasts. | Pine Mountain Lake Golf Course, Pine Mountain Lake Association, Hiking Trails, Fishing and Boating |
| Wawona Campground | Natural campsite located within the National Park, great for nature lovers and camping enthusiasts looking for immersive experiences in the woods. | Wawona Campground, Tuolumne River, Hiking Trails in the area, Proximity to Sequoias |
Understanding Airbnb License Requirements & STR Laws in Midpines (2026)
While Midpines, California, United States currently shows low STR regulations, specific Airbnb license requirements might still exist or change. Always verify the latest short term rental regulations and Airbnb license requirements directly with local government authorities for Midpines to ensure full compliance before hosting.
(Source: AirROI data, 2026, finding no licensed listings among those analyzed)
Top Performing Airbnb Properties in Midpines (2026)
Benchmark your potential! Explore examples of top-performing Airbnb properties in Midpinesbased on Trailing Twelve Month (TTM) revenue. Analyze their characteristics, revenue, occupancy rate, and ADR to understand what drives success in this market.
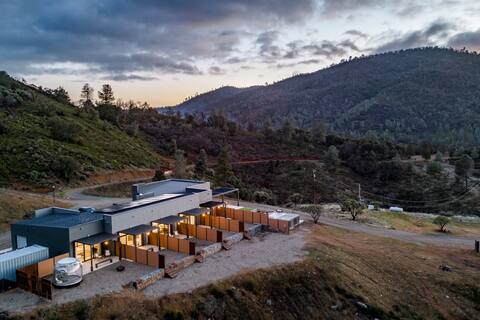
Horizon by Yosemite Entire Home - Mod/Luxury
Entire Place • 3 bedrooms

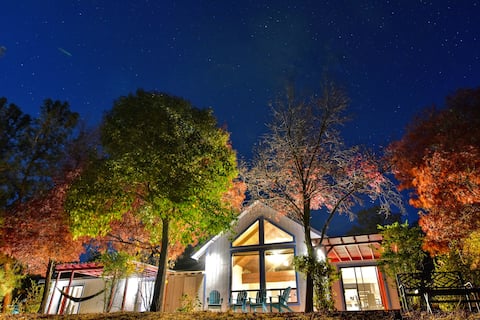
Yosemite cabin with private lake | Twin Springs
Entire Place • 2 bedrooms
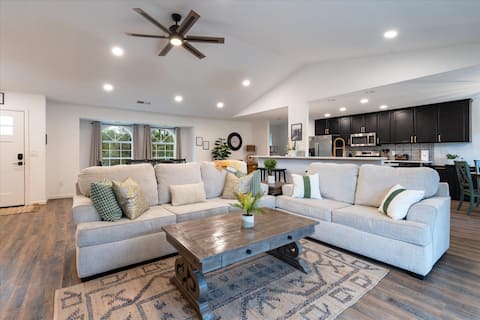
Stunning Views, Pickleball, 35 min to Yosemite, EV
Entire Place • 2 bedrooms

Homestead Ranch near Yosemite w/ Horses & Chickens
Entire Place • 3 bedrooms
ET Ranch House: Gateway to Yosemite, w/ Hot Tub
Entire Place • 4 bedrooms
Family-Friendly Yosemite Retreat w/ Stunning Views
Entire Place • 3 bedrooms
Note: Performance varies based on location, size, amenities, seasonality, and management quality. Data reflects the past 12 months.
Top Performing Airbnb Hosts in Midpines (2026)
Learn from the best! This table showcases top-performing Airbnb hosts in Midpines based on the number of properties managed and estimated total revenue over the past year. Analyze their scale and performance metrics.
| Host Name | Properties | Grossing Revenue | Stay Reviews | Avg Rating |
|---|---|---|---|---|
| Anne | 6 | $267,865 | 43 | 5.00/5.0 |
| Dylan | 3 | $179,778 | 249 | 4.81/5.0 |
| Charissa | 3 | $132,719 | 507 | 4.94/5.0 |
| Tchukon & Carolyn | 2 | $117,335 | 154 | 4.87/5.0 |
| Rekha & Shyam | 1 | $89,292 | 383 | 4.95/5.0 |
| Eve | 2 | $67,856 | 495 | 4.75/5.0 |
| Amy | 1 | $66,206 | 21 | 5.00/5.0 |
| Mark | 2 | $65,962 | 39 | 4.92/5.0 |
| Lily | 1 | $65,632 | 78 | 4.81/5.0 |
| Courtney | 1 | $63,120 | 248 | 4.88/5.0 |
Analyzing the strategies of top hosts, such as their property selection, pricing, and guest communication, can offer valuable lessons for optimizing your own Airbnb operations in Midpines.
Dive Deeper: Advanced Midpines STR Market Data (2026)
Ready to unlock more insights? AirROI provides access to advanced metrics and comprehensive Airbnb data for Midpines. Explore detailed analytics beyond this report to refine your investment strategy, optimize pricing, and maximize your vacation rental profits.
Explore Advanced MetricsMidpines Short-Term Rental Market Composition (2026): Property & Room Types
Room Type Distribution
Property Type Distribution
Market Composition Insights for Midpines
- The Midpines Airbnb market composition is heavily skewed towards Entire Home/Apt listings, which make up 81.6% of the 49 active rentals. This indicates strong guest preference for privacy and space.
- Looking at the property type distribution in Midpines, House properties are the most common (51%), reflecting the local real estate landscape.
- Houses represent a significant 51% portion, catering likely to families or larger groups.
- The presence of 22.4% Hotel/Boutique listings indicates integration with traditional hospitality.
- Smaller segments like apartment/condo, unique stays (combined 4.0%) offer potential for unique stay experiences.
Midpines Airbnb Room Capacity Analysis (2026): Bedroom Distribution
Distribution of Listings by Number of Bedrooms
Room Capacity Insights for Midpines
- The dominant room capacity in Midpines is 3 bedrooms listings, making up 34.7% of the market. This suggests a strong demand for properties suitable for families or small groups.
- Together, 3 bedrooms and 2 bedrooms properties represent 61.2% of the active Airbnb listings in Midpines, indicating a high concentration in these sizes.
- A significant 40.8% of listings offer 3+ bedrooms, catering to larger groups and families seeking more space in Midpines.
Midpines Vacation Rental Guest Capacity Trends (2026)
Distribution of Listings by Guest Capacity
Guest Capacity Insights for Midpines
- The most common guest capacity trend in Midpines vacation rentals is listings accommodating 6 guests (26.5%). This suggests the primary traveler segment is likely larger groups.
- Properties designed for 6 guests and 8+ guests dominate the Midpines STR market, accounting for 46.9% of listings.
- 53.0% of properties accommodate 6+ guests, serving the market segment for larger families or group travel in Midpines.
- On average, properties in Midpines are equipped to host 4.6 guests.
Midpines Airbnb Booking Patterns (2026): Available vs. Booked Days
Available Days Distribution
Booked Days Distribution
Booking Pattern Insights for Midpines
- The most common availability pattern in Midpines falls within the 271-366 days range, representing 44.9% of listings. This suggests many properties have significant open periods on their calendars.
- Approximately 89.8% of listings show high availability (181+ days open annually), indicating potential for increased bookings or specific owner usage patterns.
- For booked days, the 91-180 days range is most frequent in Midpines (44.9%), reflecting common guest stay durations or potential owner blocking patterns.
- A notable 12.2% of properties secure long booking periods (181+ days booked per year), highlighting successful long-term rental strategies or significant owner usage.
Midpines Airbnb Minimum Stay Requirements Analysis
Distribution of Listings by Minimum Night Requirement
1 Night
11 listings
22.4% of total
2 Nights
23 listings
46.9% of total
3 Nights
1 listings
2% of total
30+ Nights
14 listings
28.6% of total
Key Insights
- The most prevalent minimum stay requirement in Midpines is 2 Nights, adopted by 46.9% of listings. This highlights the market's preference for shorter, flexible bookings.
- A strong majority (69.3%) of the Midpines Airbnb data shows acceptance of very short stays (1-2 nights), indicating a dynamic, high-turnover market.
- A significant segment (28.6%) caters to monthly stays (30+ nights) in Midpines, pointing to opportunities in the extended-stay market.
Recommendations
- Align with the market by considering a 2 Nights minimum stay, as 46.9% of Midpines hosts use this setting.
- If feasible, allowing 1-night stays, especially midweek or during low season, could capture last-minute bookings, as only 22.4% currently do.
- Explore offering discounts for stays of 30+ nights to attract the 28.6% of the market seeking extended stays.
- Adjust minimum nights based on seasonality – potentially shorter during low season and longer during peak demand periods in Midpines.
Midpines Airbnb Cancellation Policy Trends Analysis (2026)
Limited
3 listings
6.1% of total
Super Strict 30 Days
1 listings
2% of total
Flexible
2 listings
4.1% of total
Moderate
14 listings
28.6% of total
Firm
23 listings
46.9% of total
Strict
6 listings
12.2% of total
Cancellation Policy Insights for Midpines
- The prevailing Airbnb cancellation policy trend in Midpines is Firm, used by 46.9% of listings.
- A majority (59.1%) of hosts in Midpines utilize Firm or Strict policies, indicating a market where hosts prioritize booking security.
Recommendations for Hosts
- Consider adopting a Firm policy to align with the 46.9% market standard in Midpines.
- Using a Strict policy might deter some guests, as only 12.2% of listings use it. Evaluate if potential revenue protection outweighs possible lower booking rates.
- Regularly review your cancellation policy against competitors and market demand shifts in Midpines.
Midpines STR Booking Lead Time Analysis (2026)
Average Booking Lead Time by Month
Booking Lead Time Insights for Midpines
- The overall average booking lead time for vacation rentals in Midpines is 53 days.
- Guests book furthest in advance for stays during May (average 70 days), likely coinciding with peak travel demand or local events.
- The shortest booking windows occur for stays in March (average 23 days), indicating more last-minute travel plans during this time.
- Seasonally, Summer (62 days avg.) sees the longest lead times, while Winter (49 days avg.) has the shortest, reflecting typical travel planning cycles.
Recommendations for Hosts
- Use the overall average lead time (53 days) as a baseline for your pricing and availability strategy in Midpines.
- For May stays, consider implementing length-of-stay discounts or slightly higher rates for bookings made less than 70 days out to capitalize on advance planning.
- Target marketing efforts for the Summer season well in advance (at least 62 days) to capture early planners.
- Monitor your own booking lead times against these Midpines averages to identify opportunities for dynamic pricing adjustments.
Popular & Essential Airbnb Amenities in Midpines (2026)
Amenity Prevalence
Amenity Insights for Midpines
- Essential amenities in Midpines that guests expect include: Smoke alarm, Coffee maker, Wifi, Free parking on premises, Fire extinguisher, Heating, Carbon monoxide alarm, Refrigerator, Kitchen, Hot water. Lacking these (any) could significantly impact bookings.
Recommendations for Hosts
- Ensure your listing includes all essential amenities for Midpines: Smoke alarm, Coffee maker, Wifi, Free parking on premises, Fire extinguisher, Heating, Carbon monoxide alarm, Refrigerator, Kitchen, Hot water.
- Prioritize adding missing essentials: Refrigerator, Kitchen, Hot water.
- Highlight unique or less common amenities you offer (e.g., hot tub, dedicated workspace, EV charger) in your listing description and photos.
- Regularly check competitor amenities in Midpines to stay competitive.
Midpines Airbnb Guest Demographics & Profile Analysis (2026)
Guest Profile Summary for Midpines
- The typical guest profile for Airbnb in Midpines consists of primarily domestic travelers (82%), often arriving from nearby Los Angeles, typically belonging to the Post-2000s (Gen Z/Alpha) group (50%), primarily speaking English or Spanish.
- Domestic travelers account for 81.6% of guests.
- Key international markets include United States (81.6%) and United Kingdom (4.5%).
- Top languages spoken are English (55.5%) followed by Spanish (11.6%).
- A significant demographic segment is the Post-2000s (Gen Z/Alpha) group, representing 50% of guests.
Recommendations for Hosts
- Target domestic marketing efforts towards travelers from Los Angeles and San Francisco.
- Tailor amenities and listing descriptions to appeal to the dominant Post-2000s (Gen Z/Alpha) demographic (e.g., highlight fast WiFi, smart home features, local guides).
- Highlight unique local experiences or amenities relevant to the primary guest profile.
- Consider seasonal promotions aligned with peak travel times for key origin markets.
Nearby Short-Term Rental Market Comparison
How does the Midpines Airbnb market stack up against its neighbors? Compare key performance metrics like average monthly revenue, ADR, and occupancy rates in surrounding areas to understand the broader regional STR landscape.
| Market | Active Properties | Monthly Revenue | Daily Rate | Avg. Occupancy |
|---|---|---|---|---|
| Wawona | 66 | $7,186 | $548.44 | 45% |
| Yosemite National Park | 227 | $6,835 | $511.03 | 44% |
| Zephyr Cove | 192 | $6,404 | $642.42 | 37% |
| Meyers | 177 | $5,840 | $500.97 | 43% |
| Yosemite West | 29 | $5,597 | $423.79 | 49% |
| Three Rivers | 407 | $5,504 | $387.06 | 50% |
| Lone Pine | 33 | $4,810 | $274.42 | 55% |
| June Lake | 90 | $4,648 | $346.20 | 49% |
| Fish Camp | 36 | $4,344 | $423.34 | 37% |
| Oakhurst | 671 | $4,321 | $347.81 | 44% |