Mission Canyon Airbnb Market Analysis 2026: Short Term Rental Data & Vacation Rental Statistics in California, United States
Is Airbnb profitable in Mission Canyon in 2026? Explore comprehensive Airbnb analytics for Mission Canyon, California, United States to uncover income potential. This 2026 STR market report for Mission Canyon, based on AirROI data from February 2025 to January 2026, reveals key trends in the niche market of 34 active listings.
Whether you're considering an Airbnb investment in Mission Canyon, optimizing your existing vacation rental, or exploring rental arbitrage opportunities, understanding the Mission Canyon Airbnb data is crucial. Leveraging the low regulation environment is key to maximizing your short term rental income potential. Let's dive into the specifics.
Key Mission Canyon Airbnb Performance Metrics Overview
Monthly Airbnb Revenue Variations & Income Potential in Mission Canyon (2026)
Understanding the monthly revenue variations for Airbnb listings in Mission Canyon is key to maximizing your short term rental income potential. Seasonality significantly impacts earnings. Our analysis, based on data from the past 12 months, shows that the peak revenue month for STRs in Mission Canyon is typically August, while October often presents the lowest earnings, highlighting opportunities for strategic pricing adjustments during shoulder and low seasons. Explore the typical Airbnb income in Mission Canyon across different performance tiers:
- Best-in-class properties (Top 10%) achieve $14,148+ monthly, often utilizing dynamic pricing and superior guest experiences.
- Strong performing properties (Top 25%) earn $9,168 or more, indicating effective management and desirable locations/amenities.
- Typical properties (Median) generate around $4,577 per month, representing the average market performance.
- Entry-level properties (Bottom 25%) see earnings around $2,711, often with potential for optimization.
Average Monthly Airbnb Earnings Trend in Mission Canyon
Mission Canyon Airbnb Occupancy Rate Trends (2026)
Maximize your bookings by understanding the Mission Canyon STR occupancy trends. Seasonal demand shifts significantly influence how often properties are booked. Typically, Augustsees the highest demand (peak season occupancy), while January experiences the lowest (low season). Effective strategies, like adjusting minimum stays or offering promotions, can boost occupancy during slower periods. Here's how different property tiers perform in Mission Canyon:
- Best-in-class properties (Top 10%) achieve 90%+ occupancy, indicating high desirability and potentially optimized availability.
- Strong performing properties (Top 25%) maintain 81% or higher occupancy, suggesting good market fit and guest satisfaction.
- Typical properties (Median) have an occupancy rate around 64%.
- Entry-level properties (Bottom 25%) average 41% occupancy, potentially facing higher vacancy.
Average Monthly Occupancy Rate Trend in Mission Canyon
Average Daily Rate (ADR) Airbnb Trends in Mission Canyon (2026)
Effective short term rental pricing strategy in Mission Canyon involves understanding monthly ADR fluctuations. The Average Daily Rate (ADR) for Airbnb in Mission Canyon typically peaks in November and dips lowest during February. Leveraging Airbnb dynamic pricing tools or strategies based on this seasonality can significantly boost revenue. Here's a look at the typical nightly rates achieved:
- Best-in-class properties (Top 10%) command rates of $635+ per night, often due to premium features or locations.
- Strong performing properties (Top 25%) achieve nightly rates of $467 or more.
- Typical properties (Median) charge around $278 per night.
- Entry-level properties (Bottom 25%) earn around $152 per night.
Average Daily Rate (ADR) Trend by Month in Mission Canyon
Get Live Mission Canyon Market Intelligence 👇

Explore Real-time Analytics
Airbnb Seasonality Analysis & Trends in Mission Canyon (2026)
Peak Season (August, March, July)
- Revenue averages $8,235 per month
- Occupancy rates average 65.0%
- Daily rates average $338
Shoulder Season
- Revenue averages $6,601 per month
- Occupancy maintains around 59.6%
- Daily rates hold near $351
Low Season (October, November, December)
- Revenue drops to average $5,779 per month
- Occupancy decreases to average 53.4%
- Daily rates adjust to average $384
Seasonality Insights for Mission Canyon
- The Airbnb seasonality in Mission Canyon shows moderate seasonality with distinct peak and low periods. While the sections above show seasonal averages, it's also insightful to look at the extremes:
- During the high season, the absolute peak month showcases Mission Canyon's highest earning potential, with monthly revenues capable of climbing to $8,845, occupancy reaching a high of 68.4%, and ADRs peaking at $384.
- Conversely, the slowest single month of the year, typically falling within the low season, marks the market's lowest point. In this month, revenue might dip to $5,726, occupancy could drop to 49.7%, and ADRs may adjust down to $319.
- Understanding both the seasonal averages and these monthly peaks and troughs in revenue, occupancy, and ADR is crucial for maximizing your Airbnb profit potential in Mission Canyon.
Seasonal Strategies for Maximizing Profit
- Peak Season: Maximize revenue through premium pricing and potentially longer minimum stays. Ensure high availability.
- Low Season: Offer competitive pricing, special promotions (e.g., extended stay discounts), and flexible cancellation policies. Target off-season travelers like remote workers or budget-conscious guests.
- Shoulder Seasons: Implement dynamic pricing that balances peak and low rates. Target weekend travelers or specific events. Offer slightly more flexible terms than peak season.
- Regularly analyze your own performance against these Mission Canyon seasonality benchmarks and adjust your pricing and availability strategy accordingly.
Best Areas for Airbnb Investment in Mission Canyon (2026)
Exploring the top neighborhoods for short-term rentals in Mission Canyon? This section highlights key areas, outlining why they are attractive for hosts and guests, along with notable local attractions. Consider these locations based on your target guest profile and investment strategy.
| Neighborhood / Area | Why Host Here? (Target Guests & Appeal) | Key Attractions & Landmarks |
|---|---|---|
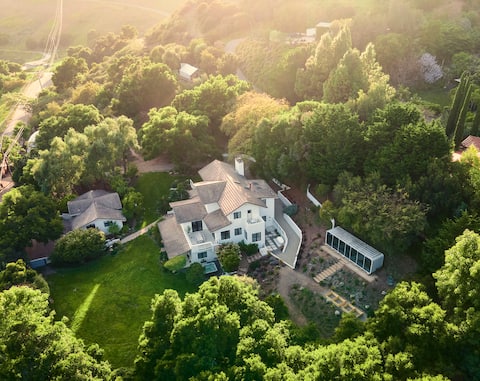
| Mission Canyon | A picturesque neighborhood located near Santa Barbara, known for its stunning views and proximity to the Santa Barbara Botanic Garden and hiking trails. Attracts nature lovers and those seeking a peaceful retreat close to the city. | Santa Barbara Botanic Garden, Mission Santa Barbara, Oak Park, Rattlesnake Canyon Trail, Santa Barbara Museum of Natural History |
| Santa Barbara Downtown | The vibrant heart of Santa Barbara filled with shops, restaurants, and cultural attractions. Ideal for tourists who want to be in the midst of activities and events. | State Street, Old Mission Santa Barbara, Santa Barbara County Courthouse, Stearns Wharf, Santa Barbara Museum of Art |
| West Beach | A lively beach area that offers easy access to the beach and water activities. Popular with families and visitors looking for a beachside experience. | West Beach, Santa Barbara Harbor, Cabrillo Boulevard, East Beach, Bike Path |
| Mesa | A charming residential area that offers stunning ocean views and is known for its laid-back vibe. Favored by those looking for a local experience while still being close to the beach. | Mesa Lane Beach, Shoreline Park, Douglas Family Preserve, The Mesa Center |
| Upper State Street | A bustling area with shops, restaurants, and easy access to the freeway. Great for travelers who want to experience the local conveniences of Santa Barbara. | La Cumbre Plaza, Santa Barbara Golf Club, Santa Barbara Zoo, parks and cafes |
| Hope Ranch | An exclusive residential area known for its luxury homes and beautiful landscapes. Attracts those looking for a premium getaway. | Hope Ranch Beach, Riviera Park, local horseback riding |
| Goleta | A neighboring city that offers affordable accommodations and proximity to UCSB. Ideal for visitors associated with the university and beachgoers. | Goleta Beach, Lake Los Carneros, UCSB Campus, Kellogg Wine Cellars |
| Carpinteria | A charming beach town just south of Santa Barbara, perfect for those looking for a quieter beach experience and beautiful nature. | Carpinteria State Beach, Carpinteria Salt Marsh Nature Park, Fowler Park |
Understanding Airbnb License Requirements & STR Laws in Mission Canyon (2026)
While Mission Canyon, California, United States currently shows low STR regulations, specific Airbnb license requirements might still exist or change. Always verify the latest short term rental regulations and Airbnb license requirements directly with local government authorities for Mission Canyon to ensure full compliance before hosting.
(Source: AirROI data, 2026, finding no licensed listings among those analyzed)
Top Performing Airbnb Properties in Mission Canyon (2026)
Benchmark your potential! Explore examples of top-performing Airbnb properties in Mission Canyonbased on Trailing Twelve Month (TTM) revenue. Analyze their characteristics, revenue, occupancy rate, and ADR to understand what drives success in this market.
Casa Calma - Retreat *10 people- Luxurious- Design
Entire Place • 4 bedrooms

Under the Oaks - Spa, Fire-pit, 10 min to beach
Entire Place • 4 bedrooms
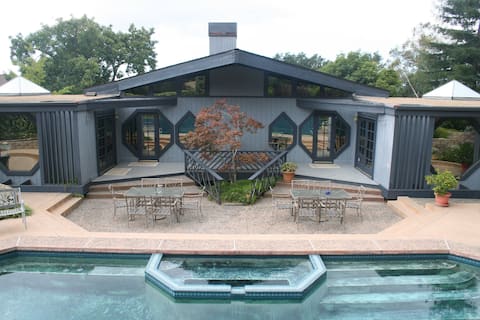
Private Pool Home on Superblooming Acre, Near town
Entire Place • 4 bedrooms
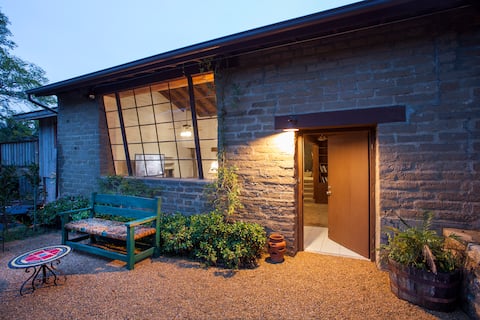
8ppl adobe w/studio w/jacuzzi -10 min 2 town
Entire Place • 4 bedrooms
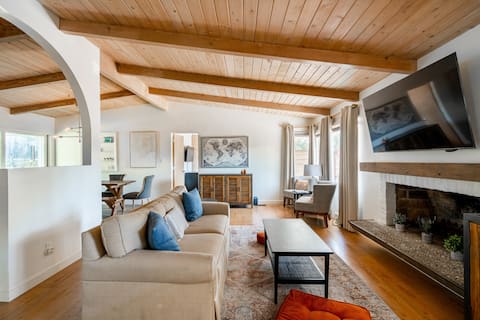
Mission Canyon Oak Haven
Entire Place • 3 bedrooms

Cozy Stone Cottage
Entire Place • 1 bedroom
Note: Performance varies based on location, size, amenities, seasonality, and management quality. Data reflects the past 12 months.
Top Performing Airbnb Hosts in Mission Canyon (2026)
Learn from the best! This table showcases top-performing Airbnb hosts in Mission Canyon based on the number of properties managed and estimated total revenue over the past year. Analyze their scale and performance metrics.
| Host Name | Properties | Grossing Revenue | Stay Reviews | Avg Rating |
|---|---|---|---|---|
| Seb | 2 | $414,030 | 179 | 4.90/5.0 |
| Carla | 5 | $282,716 | 1264 | 4.74/5.0 |
| Maya | 1 | $156,401 | 371 | 4.95/5.0 |
| Wendy | 1 | $148,274 | 36 | 4.97/5.0 |
| Njambi | 1 | $115,289 | 84 | 4.87/5.0 |
| Tom | 1 | $111,118 | 328 | 4.97/5.0 |
| Javier | 1 | $104,998 | 340 | 4.82/5.0 |
| Jennifer And John | 1 | $101,925 | 24 | 4.88/5.0 |
| Hilary | 1 | $95,268 | 161 | 4.84/5.0 |
| Lee | 2 | $80,581 | 47 | 4.91/5.0 |
Analyzing the strategies of top hosts, such as their property selection, pricing, and guest communication, can offer valuable lessons for optimizing your own Airbnb operations in Mission Canyon.
Dive Deeper: Advanced Mission Canyon STR Market Data (2026)
Ready to unlock more insights? AirROI provides access to advanced metrics and comprehensive Airbnb data for Mission Canyon. Explore detailed analytics beyond this report to refine your investment strategy, optimize pricing, and maximize your vacation rental profits.
Explore Advanced MetricsMission Canyon Short-Term Rental Market Composition (2026): Property & Room Types
Room Type Distribution
Property Type Distribution
Market Composition Insights for Mission Canyon
- The Mission Canyon Airbnb market composition is heavily skewed towards Entire Home/Apt listings, which make up 97.1% of the 34 active rentals. This indicates strong guest preference for privacy and space.
- Looking at the property type distribution in Mission Canyon, House properties are the most common (67.6%), reflecting the local real estate landscape.
- Houses represent a significant 67.6% portion, catering likely to families or larger groups.
- The presence of 14.7% Hotel/Boutique listings indicates integration with traditional hospitality.
Mission Canyon Airbnb Room Capacity Analysis (2026): Bedroom Distribution
Distribution of Listings by Number of Bedrooms
Room Capacity Insights for Mission Canyon
- The dominant room capacity in Mission Canyon is 3 bedrooms listings, making up 29.4% of the market. This suggests a strong demand for properties suitable for families or small groups.
- Together, 3 bedrooms and 1 bedroom properties represent 55.9% of the active Airbnb listings in Mission Canyon, indicating a high concentration in these sizes.
- A significant 41.2% of listings offer 3+ bedrooms, catering to larger groups and families seeking more space in Mission Canyon.
Mission Canyon Vacation Rental Guest Capacity Trends (2026)
Distribution of Listings by Guest Capacity
Guest Capacity Insights for Mission Canyon
- The most common guest capacity trend in Mission Canyon vacation rentals is listings accommodating 6 guests (29.4%). This suggests the primary traveler segment is likely larger groups.
- Properties designed for 6 guests and 2 guests dominate the Mission Canyon STR market, accounting for 55.9% of listings.
- 41.2% of properties accommodate 6+ guests, serving the market segment for larger families or group travel in Mission Canyon.
- On average, properties in Mission Canyon are equipped to host 4.2 guests.
Mission Canyon Airbnb Booking Patterns (2026): Available vs. Booked Days
Available Days Distribution
Booked Days Distribution
Booking Pattern Insights for Mission Canyon
- The most common availability pattern in Mission Canyon falls within the 91-180 days range, representing 29.4% of listings. This suggests many properties have significant open periods on their calendars.
- Approximately 53.0% of listings show high availability (181+ days open annually), indicating potential for increased bookings or specific owner usage patterns.
- For booked days, the 181-270 days range is most frequent in Mission Canyon (29.4%), reflecting common guest stay durations or potential owner blocking patterns.
- A notable 50.0% of properties secure long booking periods (181+ days booked per year), highlighting successful long-term rental strategies or significant owner usage.
Mission Canyon Airbnb Minimum Stay Requirements Analysis
Distribution of Listings by Minimum Night Requirement
1 Night
11 listings
32.4% of total
2 Nights
3 listings
8.8% of total
3 Nights
1 listings
2.9% of total
4-6 Nights
3 listings
8.8% of total
7-29 Nights
3 listings
8.8% of total
30+ Nights
13 listings
38.2% of total
Key Insights
- The most prevalent minimum stay requirement in Mission Canyon is 30+ Nights, adopted by 38.2% of listings. This highlights the market's preference for longer commitments.
- A significant segment (38.2%) caters to monthly stays (30+ nights) in Mission Canyon, pointing to opportunities in the extended-stay market.
Recommendations
- Align with the market by considering a 30+ Nights minimum stay, as 38.2% of Mission Canyon hosts use this setting.
- Explore offering discounts for stays of 30+ nights to attract the 38.2% of the market seeking extended stays.
- Adjust minimum nights based on seasonality – potentially shorter during low season and longer during peak demand periods in Mission Canyon.
Mission Canyon Airbnb Cancellation Policy Trends Analysis (2026)
Limited
2 listings
5.9% of total
Super Strict 30 Days
2 listings
5.9% of total
Flexible
5 listings
14.7% of total
Moderate
4 listings
11.8% of total
Firm
9 listings
26.5% of total
Strict
12 listings
35.3% of total
Cancellation Policy Insights for Mission Canyon
- The prevailing Airbnb cancellation policy trend in Mission Canyon is Strict, used by 35.3% of listings.
- A majority (61.8%) of hosts in Mission Canyon utilize Firm or Strict policies, indicating a market where hosts prioritize booking security.
Recommendations for Hosts
- Consider adopting a Strict policy to align with the 35.3% market standard in Mission Canyon.
- With 35.3% using Strict terms, this is a viable option in Mission Canyon, particularly for high-value properties or during peak demand periods.
- Regularly review your cancellation policy against competitors and market demand shifts in Mission Canyon.
Mission Canyon STR Booking Lead Time Analysis (2026)
Average Booking Lead Time by Month
Booking Lead Time Insights for Mission Canyon
- The overall average booking lead time for vacation rentals in Mission Canyon is 67 days.
- Guests book furthest in advance for stays during July (average 96 days), likely coinciding with peak travel demand or local events.
- The shortest booking windows occur for stays in February (average 35 days), indicating more last-minute travel plans during this time.
- Seasonally, Summer (91 days avg.) sees the longest lead times, while Winter (54 days avg.) has the shortest, reflecting typical travel planning cycles.
Recommendations for Hosts
- Use the overall average lead time (67 days) as a baseline for your pricing and availability strategy in Mission Canyon.
- For July stays, consider implementing length-of-stay discounts or slightly higher rates for bookings made less than 96 days out to capitalize on advance planning.
- Target marketing efforts for the Summer season well in advance (at least 91 days) to capture early planners.
- Monitor your own booking lead times against these Mission Canyon averages to identify opportunities for dynamic pricing adjustments.
Popular & Essential Airbnb Amenities in Mission Canyon (2026)
Amenity Prevalence
Amenity Insights for Mission Canyon
- Essential amenities in Mission Canyon that guests expect include: Wifi, Free parking on premises, TV. Lacking these (any) could significantly impact bookings.
- Popular amenities like Smoke alarm, Heating, Hot water are common but not universal. Offering these can provide a competitive edge.
Recommendations for Hosts
- Ensure your listing includes all essential amenities for Mission Canyon: Wifi, Free parking on premises, TV.
- Prioritize adding missing essentials: Free parking on premises, TV.
- Consider adding popular differentiators like Smoke alarm or Heating to increase appeal.
- Highlight unique or less common amenities you offer (e.g., hot tub, dedicated workspace, EV charger) in your listing description and photos.
- Regularly check competitor amenities in Mission Canyon to stay competitive.
Mission Canyon Airbnb Guest Demographics & Profile Analysis (2026)
Guest Profile Summary for Mission Canyon
- The typical guest profile for Airbnb in Mission Canyon consists of primarily domestic travelers (91%), often arriving from nearby Los Angeles, typically belonging to the Post-2000s (Gen Z/Alpha) group (50%), primarily speaking English or Spanish.
- Domestic travelers account for 90.6% of guests.
- Key international markets include United States (90.6%) and United Kingdom (2.1%).
- Top languages spoken are English (62.3%) followed by Spanish (16.8%).
- A significant demographic segment is the Post-2000s (Gen Z/Alpha) group, representing 50% of guests.
Recommendations for Hosts
- Target domestic marketing efforts towards travelers from Los Angeles and San Francisco.
- Tailor amenities and listing descriptions to appeal to the dominant Post-2000s (Gen Z/Alpha) demographic (e.g., highlight fast WiFi, smart home features, local guides).
- Highlight unique local experiences or amenities relevant to the primary guest profile.
- Consider seasonal promotions aligned with peak travel times for key origin markets.
Nearby Short-Term Rental Market Comparison
How does the Mission Canyon Airbnb market stack up against its neighbors? Compare key performance metrics like average monthly revenue, ADR, and occupancy rates in surrounding areas to understand the broader regional STR landscape.
| Market | Active Properties | Monthly Revenue | Daily Rate | Avg. Occupancy |
|---|---|---|---|---|
| Montecito | 127 | $10,744 | $950.35 | 51% |
| Malibu | 251 | $8,293 | $1263.89 | 35% |
| Manhattan Beach | 267 | $7,875 | $585.30 | 53% |
| Los Olivos | 30 | $7,240 | $705.20 | 43% |
| Santa Ynez | 119 | $6,967 | $589.34 | 42% |
| Toro Canyon | 33 | $6,935 | $717.58 | 42% |
| Avila Beach | 94 | $6,770 | $582.34 | 41% |
| Avalon | 249 | $6,705 | $696.60 | 38% |
| Summerland | 88 | $6,323 | $494.72 | 49% |
| Unincorporated Santa Monica Mountains | 119 | $6,008 | $699.60 | 38% |